ATLAS-CONF-2012-071 06July2012
ATLAS NOTE
ATLAS-CONF-2012-071
June 29, 2012
Search for a heavy top quark partner in final states with two leptons with the ATLAS detector
The ATLAS Collaboration
Abstract
The results of a search for direct pair production of heavy top quark partners in 4.7 fb−1 of integrated luminosity fromppcollisions at √
s=7 TeV collected by the ATLAS detector at the LHC are reported. Heavy top quark partners decaying into a top quark and a neutral non-interacting particle are searched for in events with two leptons in the final state. No excess above the Standard Model expectation is observed. Limits are placed on a supersym- metric scalar top and on a spin-1/2 top quark partner. A spin-1/2 top quark partner with a mass below 483 GeV, decaying to a top quark and a neutral non-interacting particle lighter than 100 GeV, is excluded at 95% confidence level.
c
Copyright 2012 CERN for the benefit of the ATLAS Collaboration.
Reproduction of this article or parts of it is allowed as specified in the CC-BY-3.0 license.
1 Introduction
Partners of the top quark are an ingredient of several models addressing the hierarchy problem of the Standard Model (SM). In order to stabilise the Higgs boson mass these new particles should have masses close to the electroweak symmetry breaking scale, and can be produced with high cross section at the LHC. One of these models is Supersymmetry (SUSY) [1–9] which naturally resolves the hierarchy problem [10–13] by introducing supersymmetric partners of the known bosons and fermions. In the MSSM [14–18], which is anR-parity conserving minimal supersymmetric extension of the SM, the scalar partners of right-handed and left-handed quarks, ˜qR and ˜qL, can mix to form two mass eigenstates. The mixing is proportional to the mass of the corresponding SM fermion and therefore becomes important for the third generation. Large mixing can yield scalar top (˜t1) mass eigenstates which are significantly lighter than other squarks. In this note a search for a scalar top which decays into a top quark and the lightest neutralino ˜χ01is performed. In the conserving R-parity MSSM, the ˜χ01is a stable particle which would escape detection.
A top quark partnerT also appears in other SM extensions, such as little Higgs models withT-parity conservation [19–21] or models of universal extra dimensions (UED) with Kaluza-Klein parity [22].
In all these models the top quark partner T can decay into a top quark and a stable, neutral, weakly interacting particle A0 which would escape detection. The ˜t1 is scalar in SUSY and the T a spin-1/2 fermion in the other models. The production cross section at the LHC is predicted to be approximately six times higher for fermionic T [23] than for the ˜t1. Furthermore, scalar top and T decay kinematic distributions are different because of polarization effects in the decay, yielding to different experimental acceptances.
Searches for these spin-1/2 heavy top quark partners were performed by the CDF Collaboration in proton-antiproton collisions at √
s = 1.96 TeV [24], excluding top quark partners with masses up to 400 GeV. A previous ATLAS analysis with 1.04 fb−1of proton-proton collisions at √
s = 7 TeV [25]
excludesT with masses up to 420 GeV.
In this note a search for the direct pair production of heavy top quark partners is presented, where t˜1 → t χ˜01orT →t A0. The final state thus includes two top quarks and additional missing transverse momentumpmissT , the magnitude of which is referred to as ETmiss, resulting from the undetected A0 or χ˜01. The present study addresses the two-lepton signature resulting from the leptonic decay of both the Wbosons from the top quark decays.The neutrinos from theWalso contribute to the transverse missing momentum. Only leptons`of the first two generations are considered. To separate the signal from the overwhelming irreducible background from top quark pair production, themT2variable [26, 27] is used.
It is defined as:
mT2(p`T1,p`T2,pmissT )= min
qT+rT=pmiss
T
nmax[mT(p`T1,qT),mT(p`T2,rT) ]o
wheremT indicates the transverse mass,p`T1 andp`T2 are the transverse momenta of the two leptons, and qT andrTare vectors which satisfyqT+rT=pmissT . The minimisation in the formula is performed over all the possible decompositions ofpmissT . The distribution of this variable presents a very sharp kinematic limit at theWmass fort¯tproduction [28,29], whereas for the signal topology considered here it decreases slowly towards a higher mass value, due to the presence of the two additional invisible particles produced in association with the top quark pair. The results are interpreted in the scalar top-neutralino mass plane as well as in a generic model producing a heavy spin-1/2 top quark partnerT decaying into an invisible particleA0and a top quark.
This analysis is sensitive to masses of the top quark partner in excess of about 200 GeV and is thus complementary to a parallel ATLAS study reported in Ref. [30] optimised for scalar top masses near or below the top quark mass.
2 The ATLAS detector
The ATLAS detector [31] consists of inner tracking devices surrounded by a superconducting solenoid, electromagnetic and hadronic calorimeters and a muon spectrometer with a toroidal magnetic field. The inner detector, in combination with the 2 T field from the solenoid, provides precision tracking of charged particles for|η| < 2.51. It consists of a silicon pixel detector, a silicon strip detector and a straw tube tracker that also provides transition radiation measurements for electron identification. The calorimeter system covers the pseudo rapidity range|η| < 4.9. It is composed of sampling calorimeters with either liquid argon or scintillating tiles as the active media. The muon spectrometer has separate trigger and high-precision tracking chambers which provide muon identification and measurement for|η|<2.47.
3 Monte Carlo samples
Simulated event samples are used to aid in the description of the background and to model the SUSY and spin-1/2 heavy top quark partner signals.
Top quark pair andWtproduction are simulated withmc@nlo[32, 33], fixing the top quark mass at 172.5 GeV, and using the next-to-leading-order (NLO) parton density function (PDF) set CTEQ10 [34].
Additional Monte Carlo (MC) samples are used to estimate the event generator systematic uncertainties:
twopowheg[35] samples, one interfaced withherwig[36] for the fragmentation and the hadronization, andjimmy[37] for the underlying event, and the other interfaced withpythia[38]; and analpgen[39]
sample. The alpgen and the mc@nlo samples are interfaced with herwig and jimmy. The impact of ISR/FSR modelling is assessed usingacermc[40] samples produced with variations to thepythiaparton shower parameters. These variations are chosen such that the two samples produce additional radiation consistent with the experimental uncertainty in the data [41, 42].
Samples ofZ/γ?produced in association with light and heavy flavor jets are generated withalpgen using the PDF set CTEQ6.1 [43]. Samples oft¯tZandt¯tWare generated withmadgraph[44] interfaced to pythia. Di-boson (WW,WZ,ZZ) samples are generated withsherpa[45]. Additional samples generated withalpgenandherwigare used for the evaluation of the event generator systematic uncertainties.
The background predictions are normalized to theoretical cross sections, including higher order QCD corrections when available, and are compared to data in control regions. Next-to-next-to-leading order (NNLO) cross sections are used for inclusiveZ production [46, 47]. Approximate NLO+NNLL (next- to-next-to-leading-logarithms) cross sections are used in the normalization of the t¯t [48] andWt [49]
samples. NLO cross sections are used for the di-boson [32, 50] and for the t¯tW andt¯tZ [51] samples.
Thet¯tproduction in association withbb¯ is normalized to leading order (LO) [39]. Table 1 gives cross sections and uncertainties.
SM processes that generate jets which are misidentified as leptons, or where a lepton from ab-hadron orc-hadron decay is selected, collectively referred to as “fake” leptons in the following, are estimated from data as described in Section 6.
Scalar top signal samples are generated withherwig++[52] while spin-1/2 heavy top quark partner signal samples are generated withmadgraph[44]. Signal cross sections are calculated to next-to-leading order in the strong coupling constant, including the resummation of soft gluon emission at next-to- leading-logarithmic accuracy (NLO+NLL) [53–55], as described in Ref. [56].
The Monte Carlo generator parameters have been tuned to ATLAS data [57,58] and generated events are processed through a detector simulation [59] based ongeant4 [60]. Effects of multiple proton-proton
1ATLAS uses a right-handed coordinate system with its origin at the nominal interaction point (IP) in the center of the detector and thez-axis coinciding with the axis of the beam pipe. Thex-axis points from the IP to the center of the LHC ring, and they-axis points upwards. Cylindrical coordinates (r, φ) are used in the transverse plane,φbeing the azimuthal angle around the beam pipe. The pseudo rapidity is defined in terms of the polar angleθasη=−ln tan(θ/2).
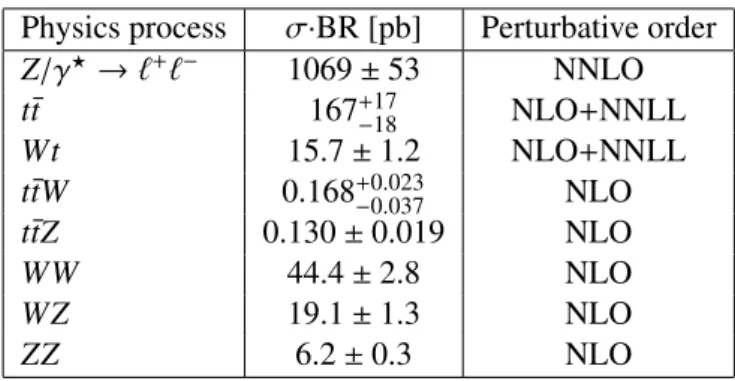
Table 1: The most important background processes, and their production cross sections, multiplied by the relevant branching ratios. The `indicates all three types of leptons (e, µ, τ) summed together. The Z/γ?cross section is given for events with a di-lepton invariant mass of at least 12 GeV.
Physics process σ·BR [pb] Perturbative order Z/γ? →`+`− 1069±53 NNLO
t¯t 167+17−18 NLO+NNLL
Wt 15.7±1.2 NLO+NNLL
t¯tW 0.168+−0.0370.023 NLO
t¯tZ 0.130±0.019 NLO
WW 44.4±2.8 NLO
WZ 19.1±1.3 NLO
ZZ 6.2±0.3 NLO
interactions in the same bunch crossing (pile-up) are included, with the MC samples re-weighted so that the distribution of the number of interactions per bunch crossing agrees with that in the data.
4 Object reconstruction
Jets are reconstructed from three-dimensional calorimeter energy clusters by using the anti-kt jet algo- rithm [61, 62] with a radius parameter of 0.4. The measured jet energy is corrected for inhomogeneities in, and the non-compensating nature of, the calorimeter withpTandηdependent correction factors [63].
Only jet candidates with pT > 20 GeV and|η| < 2.5 and a “jet vertex fraction”, which quantifies the fraction of track transverse momentum associated with a jet from the primary vertex, larger than 0.75 are retained. Events with any jet that fails the jet quality criteria designed to reject noise and non collision backgrounds [63] are rejected.
Electron candidates are required to havepT >20 GeV,|η|<2.47 and to satisfy the “medium” shower shape and track selection quality criteria defined in Ref. [64]. These electrons (“preselected” electrons in the following) are then required to pass “tight” quality criteria [64] which places additional requirements on the ratio of calorimetric energy to track momentum, and on the fraction of transition radiation hits in the straw tube tracker. The electron candidates are then required to be isolated: the scalar sum of thepT of inner detector tracks, not including the electron track, with pT > 1 GeV within a cone in theη−φ plane of radius∆R<0.2 around the electron candidate,ΣpT, must be less than 10% of the electron pT.
Muon candidates are reconstructed using either a full muon spectrometer track matched to an inner detector track, or a muon spectrometer segment matched to an extrapolated inner detector track [65].
They must be reconstructed with sufficient hits in the pixel, strip and straw tube detectors. They are required to have pT > 10 GeV,|η| < 2.4 and must have longitudinal and transverse impact parameters within 1 mm and 0.2 mm of the primary vertex, respectively. Such candidates (“preselected” muons in the following) are then required to haveΣpT < 1.8 GeV, whereΣpT is the isolation variable computed as described for the electrons.
Following the object reconstruction described above, overlaps between jet, electron and muon can- didates are resolved. Any jet within∆R= 0.2 of preselected electrons is discarded. Electrons or muons within∆R=0.4 of any remaining jet are then discarded.
TheETmissis the magnitude of the vectorial sum of thepT of the reconstructed jets (withpT >20 GeV and|η| < 4.5) after overlap removal, preselected leptons, and the calorimeter clusters not belonging to reconstructed objects [66].
Table 2: Efficiency of themT2selection, calculated after all other SR cuts, for signal samples for different values of the mass of the scalar top or of the spin-1/2 heavy top quark partner. The mass of the ˜χ01orA0 is zero in all cases. No signal sample withm(T)=200 GeV has been simulated.
Top quark partner mass [ GeV] 200 300 400 500 600 t˜1t˜1production 0.02% 7.7% 22.0% 35.6% 43.0%
T T production - 5.3% 15.8% 27.3% 34.3%
Ab-tagging algorithm exploiting both impact parameter and secondary vertex information [67] is used to identify jets containing ab-hadron decay. The chosen operating point has a 60% efficiency for taggingb-jets in an MC sample oft¯tevents, with a mis-tag probability for light quarks and gluons of less than 1%.
5 Event selection
This search uses proton-proton collisions recorded in 2011 at a center-of-mass energy of 7 TeV. After the application of beam, detector and data quality requirements, the data set corresponds to a total integrated luminosity of 4.7 fb−1, with an uncertainty of 3.9%, measured as described in Refs. [68, 69].
The data are selected with a three-level trigger system. Events are accepted if they pass either a single electron trigger reaching a plateau efficiency of about 97% for electrons withpT > 25 GeV, or a single muon or a combined muon+jet trigger which reach a plateau efficiency of about 75%(90%) in the barrel (end-caps) for events including muons with pT > 20 GeV and jets with pT > 50 GeV. The combined muon+jet trigger is used for the data taking periods with high instantaneous luminosity, because it is based on looser cuts on muon identification than the single muon trigger available for those periods, resulting in a higher plateau efficiency.
Events are required to have a reconstructed primary vertex with five or more tracks consistent with the beam spot position, and must pass the quality criteria [63] already mentioned in Section 4 to reject noise and non-collision backgrounds
Two signal regions (SRs) are defined, one for different flavor (DF), and one for same flavor (SF) leptons. For both SRs events are required to have exactly two opposite sign (OS) leptons (electrons or muons) with an invariant mass larger than 20 GeV. At least one electron or muon must have a momentum in the trigger efficiency plateau region described above. If the event contains a third preselected electron or muon, the event is rejected. At least two jets with pT > 25 GeV, and at least one of them with
pT>50 GeV, are required. This requirement suppressesWW andZ/γ?+jets backgrounds.
For the SF SR additional selections are imposed to suppress theZ/γ?+jets,WZandZZbackgrounds which present a significant population of events with largemT2: the invariant mass of the leptons must be outside the [ 71 GeV, 111 GeV] range, and at least one of the jets must be tagged as a b-jet. After these selections the background is dominated byt¯t.
Finally, for both SRs, signal candidate events are required to have a value ofmT2larger than 120 GeV.
This requirement suppresses the remainingt¯tandWW backgrounds by several orders of magnitude and was chosen to optimize the coverage of the analysis in the ˜t1−χ˜01andT −A0planes.
Before themT2 selection, t¯tproduction is by far the largest background. The efficiency of themT2 selection for t¯t events, calculated after all the other SR cuts, is 0.007%. The efficiency of the mT2 selection for scalar top and spin-1/2 heavy top quark partner signal samples is reported in Table 2 for several values of the top quark partner mass and for a massless ˜χ01 orA0. The efficiency is minimum when∆m=m(˜t1)−m( ˜χ01) orm(T)−m(A0) is close to the top quark mass, because the kinematics of the
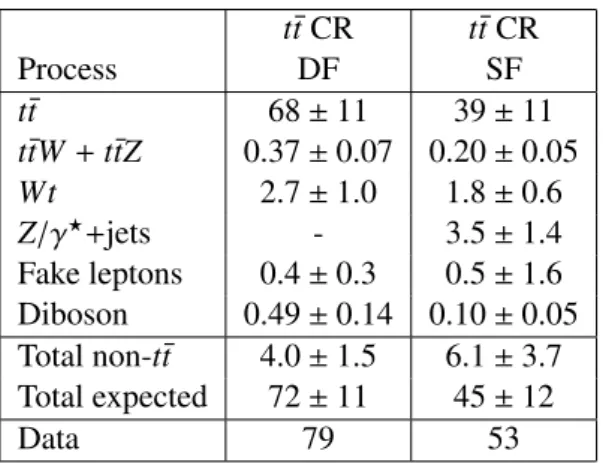
Table 3: Expected background composition and comparison of the predicted total SM event yield to the observed number of events in the top quark control regions described in the text. The expectedZ/γ?+jets rate in the DF channel is negligible. The quoted uncertainties include the systematic uncertainties de- scribed in Section 7.
t¯tCR t¯tCR
Process DF SF
t¯t 68±11 39±11
t¯tW +t¯tZ 0.37±0.07 0.20±0.05
Wt 2.7±1.0 1.8±0.6
Z/γ?+jets - 3.5±1.4
Fake leptons 0.4±0.3 0.5±1.6 Diboson 0.49±0.14 0.10±0.05 Total non-t¯t 4.0±1.5 6.1±3.7 Total expected 72±11 45±12
Data 79 53
signal are then similar to those of t¯tbackground event, and it increases with increasing ∆m. For equal masses, the spin-1/2 top quark partner signals have a slightly lower efficiency than scalar top signals, because of polarization effects in the decay.
6 Background estimation
The dominant SM background contributions to the SRs are top quark pair production and Z/γ?+jets.
They are extracted by defining a control region (CR) populated mostly by the targeted background, and using MC to extrapolate from the rate measured in the CR to the expected background yield in the SR:
N(SR)= NData(CR)−Nothers(CR) NMC(SR) NMC(CR)
whereNData(CR) is the number of data events observed in the CR,NMC(CR) andNMC(SR) are the number of events of the targeted background expected from MC in the CR and SR respectively, and the term Nothers(CR) is the contribution from the other background sources in the CR which is estimated from MC (except for the fake lepton background which is estimated using the data driven technique described below). The ratio between number of MC events in the SR and number of MC events in the CR for a given background source is referred to as transfer factor in the following.
Thet¯tCR is defined akin to the SR, except formT2, which is required to be between 85 GeV and 100 GeV. The expected background composition of thet¯tCR is reported in Table 3. The contamination due to fake leptons is evaluated from data with the technique described below, while all the other pro- cesses are obtained from the MC prediction. Thet¯tbackground is expected to account for 86% and 94%
of the SM rate in the SF and DF CRs, respectively. The number of observed events is in good agreement with the expected event yields.
The systematic uncertainties on the modelling of thet¯tbackground transfer factor due to the choice of the MC generator are assessed by comparing the baseline sample simulated with mc@nlowith the alternative samples described in Section 3.
The background fromZ/γ?+jets is only relevant for the SF selection in the case of the decay channels Z → eeorµµ. ForZ → ττdecays, which would contribute both to the SF and the DF samples, the
mT2 distribution falls very steeply, and the number of expected events formT2 in excess of 80 GeV is negligible.
The CR forZ/γ?+jets is defined with the same selections as for the SR, except for theZveto selection which is reversed. The observed number of events in this CR is 11, compared to 7.6±1.1 expected, of which 7.0±1.1 are fromZ production. The transfer factor between CR and SR is evaluated onZ/γ?+jet MC samples on which all the selections of the SF analysis except theb-tagging requirement are applied.
Detailed checks have been performed in order to verify that this transfer factor, which relates the number of events inside theZpeak to the number of events outside, is stable with respect to themT2 andb-tag requirements. The method is validated by using an auxiliary CR dominated byZ/γ?+jets events. It is defined as the SR except for the dropping of theb-jet requirement. The number of predicted background events is 7.5±1.3 (of which 7.2±1.3 from Z/γ?+jets) while the observed number is 10. The quoted uncertainty on the prediction is only statistical.
Additional SM processes yielding two isolated leptons andETmiss(Wt,WW, WZ, ZZ,t¯tW, t¯tZ) are estimated from the MC simulation. The contribution from diboson processes, particularlyWW produc- tion, provides a significant fraction of the backgrounds in the DF region. The highmT2 population in WW production is determined by events in which a strongly off-shellW is produced. The 18% relative difference in number of events with mT2 > 120 GeV between sherpaandherwigbefore jet selections is taken as systematic uncertainty on the simulation of the mT2 variable. The 45% relative difference betweensherpaandalpgenof the efficiency of the jet selections integrated over the wholemT2 range is taken as systematic uncertainty on theWW j jcross-section.
The fake lepton background consists of semi-leptonict¯t,s-channel andt-channel single top,W+jets and strong light- and heavy-flavor jet production. The contribution from this background is small (less than 10% of the total background). It is estimated from data with a method similar to that described in Refs. [70, 71]. Two types of lepton identification criteria are defined for this evaluation: ‘tight’, corresponding to the full identification criteria described above, and ‘loose’ corresponding to preselected electrons and muons. The method counts the number of observed events containing loose-loose, loose- tight, tight-loose and tight-tight lepton pairs in the SR. The probability of loose real leptons passing the tight selection criteria is obtained using a Z → `` sample. The probability of loose fake leptons passing the tight selection criteria is determined from multi-jet enriched control samples. From these probabilities the number of events containing a contribution from one or two fake leptons are calculated.
7 Systematic Uncertainties
Various systematic uncertainties affecting the predicted background rates in the signal regions are consid- ered. Their treatment is discussed in the following paragraphs, and their impact on the absolute predicted event yield in the control and signal regions is evaluated. Such uncertainties are either used directly (for diboson,Wt,t¯tW andt¯tZproduction) in the evaluation of the predicted background in the SR, or to com- pute the uncertainty on the transfer factor (t¯t, Z/γ?+jets) and propagated to the predicted event yields in the SR.
The following experimental systematic uncertainties have been found to be non negligible:
Jet energy scale and resolution.The uncertainty on the jet energy scale (JES), derived using single particle response and test beam data, varies as a function of the jet pT and pseudorapidity. Additional systematic uncertainties arise from the dependence of the jet response on the number of expected interac- tions per bunch crossing and on the jet flavor. The total jet energy scale uncertainty atpT=50 GeV in the central detector region is about 5% [63]. The components of the jet energy scale uncertainty are varied by±1σin the MC simulation in order to obtain the resulting uncertainty in the event yield. Uncertainties related to the jet energy resolution (JER) are obtained with an in-situ measurement of the jet response asymmetry in di-jet events [72]. Their impact on the event yield is estimated by applying an additional
smearing to the jet transverse momenta. The JES and JER variations on the jet momenta are propagated to theEmissT . The JES and JER relative uncertainties on the SF and DF signal region event yield amount to 16% and 22%, respectively.
Calorimeter cluster energy scale and pile-up modeling.The uncertainties related to the contribu- tion toETmissfrom the energy in the calorimeter cells not associated to electrons, muons or jets, and from low momentum (7 GeV < pT < 25 GeV) jets, and the uncertainty due to the modeling of pile-up have been evaluated to amount to 6% (25%) of the SF (DF) event yield. The fractional uncertainty is smaller in the SF channel because it has a very small impact (2%) on the estimation of theZ/γ+jets background, which is by far the largest contribution to the SF channel.
b-tagging efficiency and mis-tagging uncertainties. The uncertainty associated with the tagging procedure used to identifyb-jets is evaluated by varying theb-tagging efficiency and mis-tagging rates within the uncertainties evaluated on the central values measured in-situ [67]. Since the DF selection does not make use ofb-tagging, this uncertainty only affects the SF channel and is small (about 1% of the total event yield).
Fake-lepton background uncertainties : An uncertainty of 33% (25%) is assigned to the fake background in the SF (DF) channel from the comparison of results from different CRs, and an additional 30% is taken as systematic uncertainty due to the extrapolation procedure.
Other significant sources of uncertainty are the cross section and luminosity uncertainties for pro- cesses estimated from MC only; the theoretical uncertainties discussed in Section 6, the limited statistics of the CRs and of the MC samples.
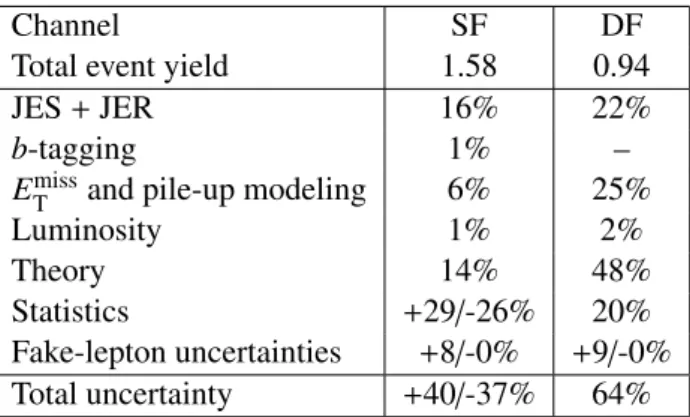
A summary of the uncertainties from each systematics source on the total expected background in the two channels is given in Table 4. The row labeled “statistics” includes the effects of the limited statistics in both CR data and MC. The theory uncertainties include the cross section, MC generator, and ISR/FSR uncertainties. They are larger for the DF channel because the theoretical uncertainty on the top quark pair and diboson backgrounds is found to be between 50% and 100%, depending on the process and the channel, while the theoretical uncertainty on theZ/γ+jets is smaller (about 10%).
Table 4: Total expected background yield and systematic uncertainties in the SF and DF signal regions.
When the uncertainty is not symmetric, the upwards and downwards values are given.
Channel SF DF
Total event yield 1.58 0.94
JES+JER 16% 22%
b-tagging 1% –
EmissT and pile-up modeling 6% 25%
Luminosity 1% 2%
Theory 14% 48%
Statistics +29/-26% 20%
Fake-lepton uncertainties +8/-0% +9/-0%
Total uncertainty +40/-37% 64%
The uncertainty on signal cross sections, which is used in the limit calculation, is calculated defining an envelope of cross section predictions is defined using the 68% confidence level (CL) ranges of the CTEQ [73] (including the αS uncertainty) and MSTW [74] PDF sets, together with variations of the factorisation and renormalisation scales by factors of two or one half. The nominal cross section value is taken to be the midpoint of the envelope and the uncertainty assigned is half the full width of the envelope, closely following the PDF4LHC recommendations [75] and following the procedure described
in Ref. [56].
8 Results
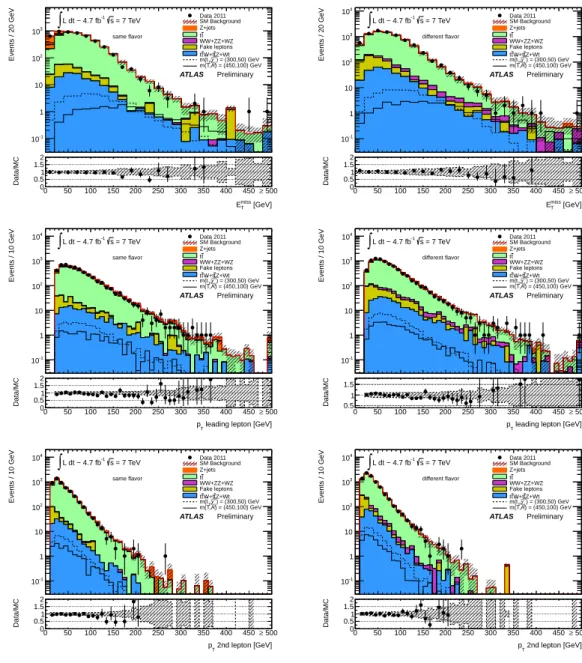
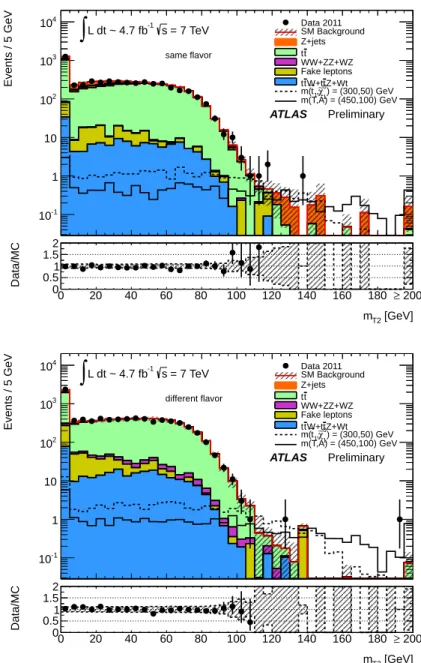
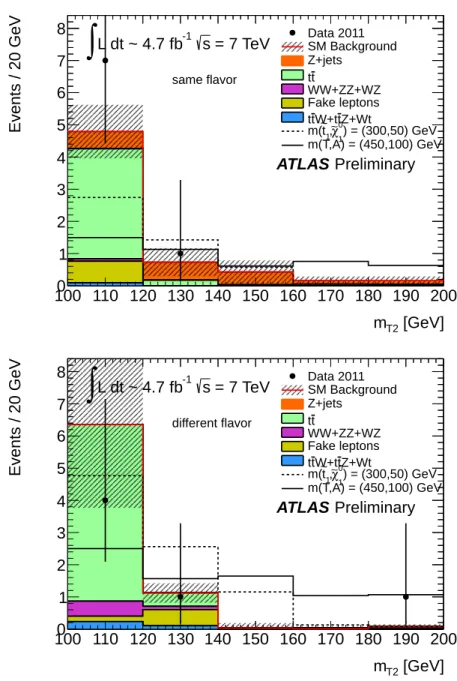
In Fig. 1 the distributions of ETmissand of the pT of the leading and subleading leptons are shown after all selection criteria except that onmT2. Fig. 2 shows the distributions of themT2variable after the same selections. In Fig. 3 themT2 distribution is shown in linear scale for events withmT2 > 100 GeV. The contributions from all SM backgrounds are shown together with their total statistical and systematics uncertainties. For illustration, the distributions for two possible signal hypotheses are also shown. The data agree with the SM background expectation within uncertainties.
Table 5 shows the expected number of events in the SR for each background source and the observed number of events. No excess of events in data is observed, and limits at 95% Confidence Level (CL) are derived on the visible cross sectionσvis = σ×× Awhereσis the total production cross section for any non-SM signal, A is the acceptance defined by the fraction of events passing the geometric and kinematic selections at particle level, and is the detector reconstruction, identification and trigger efficiency. Limits are set using a likelihood ratio method (CLs prescription), as described in Ref. [76].
The results are given in Table 5.
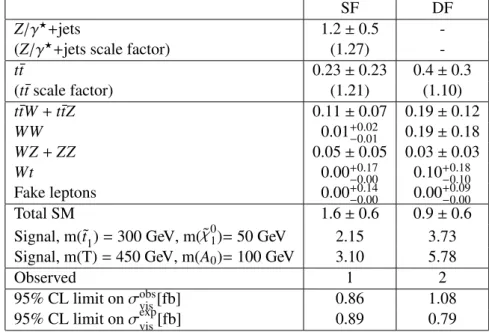
Table 5: Number of expected SM background events and number of observed events in data in both SRs.
The quoted errors are the total uncertainty on the expected rates. ForZ/γ?+jets andt¯tthe scale factors (SF) from measurements in the CR which have been applied to the MC predictions are also reported. A dash symbol indicates negligible background predictions. The expected yield for two signal models is also reported. Observed and expected upper limits at 95% confidence level onσvis=σ×× Aare also shown.
SF DF
Z/γ?+jets 1.2±0.5 -
(Z/γ?+jets scale factor) (1.27) -
t¯t 0.23±0.23 0.4±0.3
(t¯tscale factor) (1.21) (1.10)
t¯tW+t¯tZ 0.11±0.07 0.19±0.12
WW 0.01+−0.010.02 0.19±0.18
WZ+ZZ 0.05±0.05 0.03±0.03
Wt 0.00+−0.000.17 0.10+−0.100.18
Fake leptons 0.00+−0.000.14 0.00+−0.000.09
Total SM 1.6±0.6 0.9±0.6
Signal, m(˜t1)=300 GeV, m( ˜χ01)=50 GeV 2.15 3.73 Signal, m(T)=450 GeV, m(A0)=100 GeV 3.10 5.78
Observed 1 2
95% CL limit onσobsvis[fb] 0.86 1.08
95% CL limit onσexpvis[fb] 0.89 0.79
The results obtained are used to derive limits on the mass of a pair-produced heavy top quark partner decaying into a top quark and a weakly interacting particle with 100% branching ratio. The limits are derived in the plane defined by the mass of the two particles for two scenarios: a model with a scalar top t˜1and a spin-1/2 neutralino ˜χ01, and a scenario with a spin-1/2 top quark partnerT and a scalar bosonA0.
[GeV]
miss
ET
0 50 100 150 200 250 300 350 400 450 500
Events / 20 GeV
10-1
1 10 102
103 same flavor
ATLAS Preliminary = 7 TeV
-1s L dt ~ 4.7 fb
∫ Data 2011SM Background
Z+jets t t WW+ZZ+WZ Fake leptons Z+Wt t W+t t t
) = (300,50) GeV 1 χ∼0 1,
~t m(
m(T,A) = (450,100) GeV
[GeV]
miss ET
0 50 100 150 200 250 300 350 400 450 500
Data/MC 0
0.51 1.5 2
≥
[GeV]
miss
ET
0 50 100 150 200 250 300 350 400 450 500
Events / 20 GeV
10-1
1 10 102
103
104
different flavor
ATLAS Preliminary = 7 TeV
-1s L dt ~ 4.7 fb
∫ Data 2011SM Background
Z+jets t t WW+ZZ+WZ Fake leptons Z+Wt t W+t t t
) = (300,50) GeV 1 χ∼0 1, t~ m(
m(T,A) = (450,100) GeV
[GeV]
miss ET
0 50 100 150 200 250 300 350 400 450 500
Data/MC 0
0.51 1.5 2
≥
leading lepton [GeV]
pT
0 50 100 150 200 250 300 350 400 450 500
Events / 10 GeV
10-1
1 10 102
103
104
same flavor
ATLAS Preliminary = 7 TeV
-1s L dt ~ 4.7 fb
∫ Data 2011SM Background
Z+jets t t WW+ZZ+WZ Fake leptons Z+Wt t W+t t t
) = (300,50) GeV 1 χ∼0 1,
~t m(
m(T,A) = (450,100) GeV
leading lepton [GeV]
pT
0 50 100 150 200 250 300 350 400 450 500
Data/MC 00.51
1.52
≥
leading lepton [GeV]
pT
0 50 100 150 200 250 300 350 400 450 500
Events / 10 GeV
10-1
1 10 102
103
104
different flavor
ATLAS Preliminary = 7 TeV
-1s L dt ~ 4.7 fb
∫ Data 2011SM Background
Z+jets t t WW+ZZ+WZ Fake leptons Z+Wt t W+t t t
) = (300,50) GeV 1 χ∼0 1, t~ m(
m(T,A) = (450,100) GeV
leading lepton [GeV]
pT
0 50 100 150 200 250 300 350 400 450 500
Data/MC 0.5
1 1.5
≥
2nd lepton [GeV]
pT
0 50 100 150 200 250 300 350 400 450 500
Events / 10 GeV
10-1
1 10 102
103
104
same flavor
ATLAS Preliminary = 7 TeV
-1s L dt ~ 4.7 fb
∫ Data 2011SM Background
Z+jets t t WW+ZZ+WZ Fake leptons Z+Wt t W+t t t
) = (300,50) GeV 1 χ∼0 1,
~t m(
m(T,A) = (450,100) GeV
2nd lepton [GeV]
pT
0 50 100 150 200 250 300 350 400 450 500
Data/MC 0
0.51 1.52
≥
2nd lepton [GeV]
pT
0 50 100 150 200 250 300 350 400 450 500
Events / 10 GeV
10-1
1 10 102
103
104
different flavor
ATLAS Preliminary = 7 TeV
-1s L dt ~ 4.7 fb
∫ Data 2011SM Background
Z+jets t t WW+ZZ+WZ Fake leptons Z+Wt t W+t t t
) = (300,50) GeV 1 χ∼0 1, t~ m(
m(T,A) = (450,100) GeV
2nd lepton [GeV]
pT
0 50 100 150 200 250 300 350 400 450 500
Data/MC 0
0.51 1.52
≥
Figure 1: Distribution of missing transverse momentum (top plots), transverse momentum of the leading lepton (central plots) and transverse momentum of the second leading lepton (bottom plots) for events passing all the signal selection requirements, except that onmT2, for SF events (left plots) and DF events (right plots). The uncertainties on data points are statistical, while the bands on the SM backgrounds rep- resent the total uncertainties. The component labelled “fake leptons” is estimated from data as described in the text; the other backgrounds are estimated from MC, with scale factors measured in CRs fort¯tand Z/γ?+jets. The distributions of two signal models are also shown: the dashed line corresponds to signal with a 300 GeV scalar top and a 50 GeV neutralino, while the solid line corresponds to a signal with a 450 GeV spin-1/2 top quark partnerT and a 100 GeV scalarA0boson.
[GeV]
mT2
0 20 40 60 80 100 120 140 160 180 200
Events / 5 GeV
10-1
1 10 102
103
104
same flavor
ATLAS Preliminary = 7 TeV
-1 s L dt ~ 4.7 fb
∫
Data 2011SM BackgroundZ+jets t t WW+ZZ+WZ Fake leptons Z+Wt t W+t t t
) = (300,50) GeV
1
χ∼0 1,
~t m(
m(T,A) = (450,100) GeV
[GeV]
mT2
0 20 40 60 80 100 120 140 160 180 200
Data/MC 0
0.51 1.5 2
≥
[GeV]
mT2
0 20 40 60 80 100 120 140 160 180 200
Events / 5 GeV
10-1
1 10 102
103
104
different flavor
ATLAS Preliminary = 7 TeV
-1 s L dt ~ 4.7 fb
∫
Data 2011SM BackgroundZ+jets t t WW+ZZ+WZ Fake leptons Z+Wt t W+t t
t ) = (300,50) GeV
1
χ∼0 1,
~t m(
m(T,A) = (450,100) GeV
[GeV]
mT2
0 20 40 60 80 100 120 140 160 180 200
Data/MC 0
0.51 1.52
≥
Figure 2: Distribution ofmT2 for events passing all the signal candidate selection requirements, except that on mT2, for SF events (top) and DF events (bottom). Uncertainties on data points are statistical, while the bands on the SM backgrounds represent the total uncertainties. The component labelled “fake lepton” are estimated from data as described in the text; the other backgrounds are estimated from MC with scale factors measured in CRs described in Section 6 fort¯tandZ/γ?+jets . The distributions of two signal models are also shown: the dashed line corresponds to signal with a 300 GeV scalar top and a 50 GeV neutralino, while the solid line corresponds to a signal with a 450 GeV spin-1/2 top quark partner T and a 100 GeVA0.
[GeV]
mT2
100 110 120 130 140 150 160 170 180 190 200
Events / 20 GeV
0 1 2 3 4 5 6 7 8
same flavor
ATLAS Preliminary = 7 TeV
-1 s L dt ~ 4.7 fb
∫
Data 2011SM BackgroundZ+jets t t
WW+ZZ+WZ Fake leptons Z+Wt t W+t t
t ) = (300,50) GeV
1
χ∼0 1,
~t m(
m(T,A) = (450,100) GeV
[GeV]
mT2
100 110 120 130 140 150 160 170 180 190 200
Events / 20 GeV
0 1 2 3 4 5 6 7 8
different flavor
ATLAS Preliminary = 7 TeV
-1 s L dt ~ 4.7 fb
∫
Data 2011SM BackgroundZ+jets t t
WW+ZZ+WZ Fake leptons Z+Wt t W+t t t
) = (300,50) GeV
1
χ∼0 1,
~t m(
m(T,A) = (450,100) GeV
Figure 3: Distribution of mT2 for events passing all the signal selection requirements, except that on mT2, for SF events (top) and DF events (bottom). Uncertainties on data points are statistical, while the bands on the SM backgrounds represents the total uncertainties. The component labelled “fakes” are estimated from data as described in the text; the other backgrounds are estimated from MC with scale factors measured in the CR described in Section 6 fort¯tandZ/γ?+jets . The distributions of two signal models are also shown: the dashed line corresponds to signal with a 300 GeV scalar top and a 50 GeV neutralino, while the solid line corresponds to a signal with a 450 GeV spin-1/2 top quark partnerT and a 100 GeVA0.
[GeV]
t1
m~
250 300 350 400 450 500
[GeV]0 1χ∼m
0 20 40 60 80 100 120 140
= 7 TeV s
-1, L dt = 4.7 fb
∫
2 leptons DF+SF
0t χ∼1 1→
~t production, t1
~ t1
~
ATLAS Preliminary
theory) σSUSY
±1 Observed limit (
exp) σ
±1 Expected limit (
All limits at 95% CLS t
< m
0 χ∼1
- m
t1
m~
[GeV]
mT
300 350 400 450 500 550 600
[GeV] 0Am
0 50 100 150 200 250 300
= 7 TeV s
-1, L dt = 4.7 fb
∫
2 leptons DF+SF
0t
→ A production, T T
T
ATLAS Preliminary Observed limit (±1 σtheorySUSY) exp) σ
±1 Expected limit ( ATLAS 1 lepton 1.04 fb-1 CDF
All limits at 95% CLS t
< m
A0 T-m m
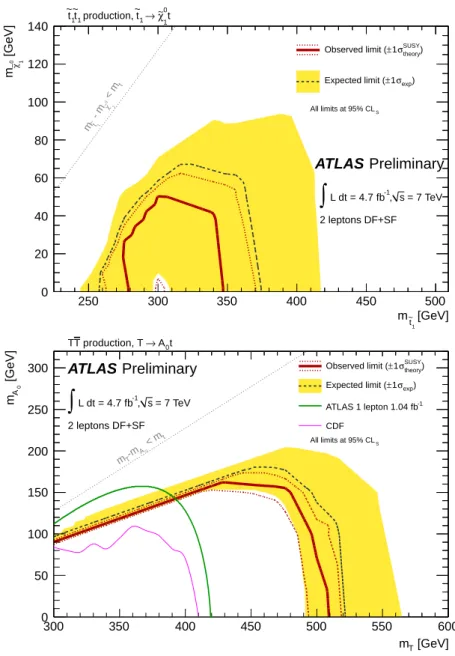
Figure 4: Expected and observed 95% CL limits in the ˜t → tχ˜01 model as a function of the scalar top and neutralino masses (top), and in theT → tA0 model as a function of the spin-1/2 top quark partner T and A0 masses (bottom). The dashed line and the yellow band are the expected limit and its ±1σ uncertainty, respectively. The thick solid line is the observed limit for the central value of the signal cross section. The expected and observed limits do not include the effect of the theoretical uncertainties on the signal cross section. The dotted lines show the effect of varying the signal cross section by±1σ of the theoretical uncertainty on the observed limit. The curve labeled “ATLAS 1 lepton 1.04 fb−1” is the previous ATLAS limit from Ref. [25] while the curve labeled “CDF” is from Ref. [24].
In both scenarios, the limits are derived after combining the SF and DF channels. Uncertainties on the detector response, cross section uncertainty, luminosity and from limited MC statistics are taken into account. The limits are shown in Fig. 4 for the scalar top (top figure) and spin-1/2 top quark partner (bottom figure) models. Conservatively using a signal cross section one standard deviation below the central value, a spin-1/2 top quark partner with a mass lower than 483 GeV (if theA0mass is lower than 100 GeV) is excluded at 95% CL. A small region in the mass plane, with a scalar top with a mass close to 300 GeV and a nearly massless neutralino is also excluded at 95% CL.
9 Conclusions
A search for a heavy partner of the top quark, which decays into a top quark and an invisible particle, has been performed using 4.7 fb−1of ATLAS data collected at √
s=7 TeV. The number of observed events has been found to be consistent with the Standard Model expectation.
Limits have been derived on a spin-1/2 heavy top quark partner decaying to a top quark and an heavy neutral particle with 100% branching ratio. A spin-1/2 top quark partner mass below 483 GeV is excluded at 95% CL for a heavy neutral particle mass below 100 GeV. This result extends the previously published limits on this scenario [25]. A supersymmetric scalar top ˜t1 with a 300 GeV mass decaying into a massless lightest neutralino ˜χ01is also excluded at 95% CL.
References
[1] H. Miyazawa,Baryon Number Changing Currents, Prog. Theor. Phys.36 (6) year=. [2] P. Ramond,Dual Theory for Free Fermions, Phys. Rev.D3(1971) 2415–2418.
[3] Y. Golfand and E. Likhtman,Extension of the Algebra of Poincare Group Generators and Violation of p Invariance, JETP Lett.13(1971) 323–326.
[4] A. Neveu and J. H. Schwarz,Factorizable dual model of pions, Nucl. Phys.B31(1971) 86–112.
[5] A. Neveu and J. H. Schwarz,Quark Model of Dual Pions, Phys. Rev.D4(1971) 1109–1111.
[6] J. Gervais and B. Sakita,Field theory interpretation of supergauges in dual models, Nucl. Phys.
B34(1971) 632–639.
[7] D. Volkov and V. Akulov,Is the Neutrino a Goldstone Particle?, Phys. Lett.B46(1973) 109–110.
[8] J. Wess and B. Zumino,A Lagrangian Model Invariant Under Supergauge Transformations, Phys.
Lett.B49(1974) 52.
[9] J. Wess and B. Zumino,Supergauge Transformations in Four-Dimensions, Nucl. Phys.B70(1974) 39–50.
[10] S. Weinberg,Implications of Dynamical Symmetry Breaking, Phys. Rev.D13(1976) 974–996.
[11] E. Gildener,Gauge Symmetry Hierarchies, Phys. Rev.D14(1976) 1667.
[12] S. Weinberg,Implications of Dynamical Symmetry Breaking: An Addendum, Phys. Rev.D19 (1979) 1277–1280.
[13] L. Susskind,Dynamics of Spontaneous Symmetry Breaking in the Weinberg- Salam Theory, Phys.
Rev.D20(1979) 2619–2625.
[14] P. Fayet,Supersymmetry and Weak, Electromagnetic and Strong Interactions, Phys. Lett.B64 (1976) 159.
[15] P. Fayet,Spontaneously Broken Supersymmetric Theories of Weak, Electromagnetic and Strong Interactions, Phys. Lett.B69(1977) 489.
[16] G. R. Farrar and P. Fayet,Phenomenology of the Production, Decay, and Detection of New Hadronic States Associated with Supersymmetry, Phys. Lett.B76(1978) 575–579.
[17] P. Fayet,Relations Between the Masses of the Superpartners of Leptons and Quarks, the Goldstino Couplings and the Neutral Currents, Phys. Lett.B84(1979) 416.
[18] S. Dimopoulos and H. Georgi,Softly Broken Supersymmetry and SU(5), Nucl. Phys.B193(1981) 150.
[19] H.-C. Cheng and I. Low,TeV symmetry and the little hierarchy problem, JHEP0309(2003) 051, arXiv:hep-ph/0308199 [hep-ph].
[20] H.-C. Cheng and I. Low,Little hierarchy, little Higgses, and a little symmetry, JHEP0408(2004) 061,arXiv:hep-ph/0405243 [hep-ph].
[21] H.-C. Cheng, I. Low, and L.-T. Wang,Top partners in little Higgs theories with T-parity, Phys.Rev.D74(2006) 055001,arXiv:hep-ph/0510225 [hep-ph].
[22] T. Appelquist, H.-C. Cheng, and B. A. Dobrescu,Bounds on universal extra dimensions, Phys.Rev.D64(2001) 035002,arXiv:hep-ph/0012100 [hep-ph].
[23] J. Alwall, J. L. Feng, J. Kumar, and S. Su,Dark Matter-Motivated Searches for Exotic 4th Generation Quarks in Tevatron and Early LHC Data, Phys.Rev.D81(2010) 114027, arXiv:1002.3366 [hep-ph].
[24] CDF Collaboration, T. Aaltonen et al.,Search for New T0Particles in Final States with Large Jet Multiplicities and Missing Transverse Energy in pp Collisions at sqrt(s)¯ =1.96 TeV,
Phys.Rev.Lett.107(2011) 191803,arXiv:1107.3574 [hep-ex].
[25] ATLAS Collaboration,Search for New Phenomena in t¯t Events With Large Missing Transverse Momentum in Proton-Proton Collisions at √
s=7 TeVwith the ATLAS Detector, Phys. Rev. Lett.
108(2012) 041805,arXiv:1109.4725 [hep-ex].
[26] C. G. Lester and D. J. Summers,Measuring masses of semiinvisibly decaying particles pair produced at hadron colliders, Phys. Lett.B463(1999) 99–103,arXiv:hep-ph/9906349.
[27] A. Barr, C. Lester, and P. Stephens,m(T2) : The Truth behind the glamour, J. Phys.G29(2003) 2343–2363,arXiv:hep-ph/0304226.
[28] W. S. Cho, K. Choi, Y. G. Kim, and C. B. Park,Measuring superparticle masses at hadron collider using the transverse mass kink, JHEP0802(2008) 035,arXiv:0711.4526 [hep-ph].
[29] M. Burns, K. Kong, K. T. Matchev, and M. Park,Using Subsystem MT2 for Complete Mass Determinations in Decay Chains with Missing Energy at Hadron Colliders, JHEP0903(2009) 143,arXiv:0810.5576 [hep-ph].
[30] ATLAS Collaboration,Search for light scalar top quark pair production in final states with two leptons with the ATLAS detector in √
s=7 TeVproton–proton collisions, ATLAS-CONF-2012-059.https://cdsweb.cern.ch/record/1453787.
[31] ATLAS Collaboration,The ATLAS Experiment at the CERN Large Hadron Collider, JINST3 (2008) S08003.
[32] S. Frixione and B. R. Webber,Matching NLO QCD computations and parton shower simulations, JHEP0206(2002) 029,arXiv:hep-ph/0204244 [hep-ph].
[33] S. Frixione, E. Laenen, P. Motylinski, and B. R. Webber,Single-top production in MC@NLO, JHEP03(2006) 092,arXiv:hep-ph/0512250.
[34] H.-L. Lai et al.,New parton distributions for collider physics, Phys. Rev.D82(2010) 074024, arXiv:1007.2241 [hep-ph].
[35] S. Frixione, P. Nason, and C. Oleari,Matching NLO QCD computations with Parton Shower simulations: the POWHEG method, JHEP0711(2007) 070,arXiv:0709.2092 [hep-ph].
[36] G. Corcella et al.,HERWIG 6: An Event generator for hadron emission reactions with interfering gluons (including supersymmetric processes), JHEP0101(2001) 010,arXiv:hep-ph/0011363 [hep-ph].
[37] J. Butterworth, J. R. Forshaw, and M. Seymour,Multiparton interactions in photoproduction at HERA, Z.Phys.C72(1996) 637–646,arXiv:hep-ph/9601371 [hep-ph].
[38] T. Sjostrand, S. Mrenna, and P. Z. Skands,PYTHIA 6.4 Physics and Manual, JHEP0605(2006) 026,arXiv:hep-ph/0603175 [hep-ph].
[39] M. L. Mangano, M. Moretti, F. Piccinini, R. Pittau, and A. D. Polosa,ALPGEN, a generator for hard multiparton processes in hadronic collisions, JHEP0307(2003) 001,
arXiv:hep-ph/0206293 [hep-ph].
[40] B. P. Kersevan and E. Richter-Was,The Monte Carlo event generator AcerMC version 2.0 with interfaces to PYTHIA 6.2 and HERWIG 6.5,arXiv:hep-ph/0405247 [hep-ph].
[41] ATLAS Collaboration,Measurement of t¯t production with a veto on additional central jet activity in pp collisions at √
s=7 TeVusing the ATLAS detector,arXiv:1203.5015 [hep-ex].
accepted by Eur. Phys. J. C.
[42] ATLAS Collaboration,Measurement of underlying event characteristics using charged particles in pp collisions at √
s=900 GeVand7 TeVwith the ATLAS detector in a limited phase space, ATL-PHYS-PUB-2011-009.https://cdsweb.cern.ch/record/1327186.
[43] J. Pumplin et al.,New generation of parton distributions with uncertainties from global QCD analysis, JHEP0207(2002) 012,arXiv:hep-ph/0201195 [hep-ph].
[44] J. Alwall, M. Herquet, F. Maltoni, O. Mattelaer, and T. Stelzer,MadGraph 5 : Going Beyond, JHEP1106(2011) 128,arXiv:1106.0522 [hep-ph].
[45] T. Gleisberg et al.,Event generation with SHERPA 1.1, JHEP0902(2009) 007, arXiv:0811.4622 [hep-ph].
[46] R. Hamberg, W. van Neerven, and T. Matsuura,A Complete calculation of the orderα2scorrection to the Drell-Yan K factor, Nucl. Phys.B359(1991) 343–405.
[47] R. Gavin, Y. Li, F. Petriello, and S. Quackenbush,W physics at the LHC with FEWZ 2.1, arXiv:1201.5896 [hep-ph].
[48] M. Aliev et al.,HATHOR: HAdronic Top and Heavy quarks crOss section calculatoR, Comput.Phys.Commun.182(2011) 1034–1046,arXiv:1007.1327 [hep-ph].
[49] N. Kidonakis,Two-loop soft anomalous dimensions for single top quark associated production with a W- or H-, Phys. Rev.D82(2010) 054018,arXiv:1005.4451 [hep-ph].
[50] T. Binoth, M. Ciccolini, N. Kauer, and M. Kramer,Gluon-induced W-boson pair production at the LHC, JHEP0612(2006) 046,arXiv:hep-ph/0611170 [hep-ph].
[51] A. Lazopoulos, T. McElmurry, K. Melnikov, and F. Petriello,Next-to-leading order QCD corrections to ttZ production at the LHC, Phys. Lett.¯ B666(2008) 62–65,arXiv:0804.2220 [hep-ph].
[52] M. Bahr et al.,Herwig++Physics and Manual, Eur. Phys. J.C58(2008) 639–707,
arXiv:0803.0883 [hep-ph]. 143 pages, program and additional information available from http://projects.hepforge.org/herwig.
[53] W. Beenakker, M. Kramer, T. Plehn, M. Spira, and P. M. Zerwas,Stop production at hadron colliders, Nucl. Phys.B515(1998) 3–14,hep-ph/9710451.
[54] W. Beenakker et al.,Supersymmetric top and bottom squark production at hadron colliders, JHEP 1008(2010) 098,arXiv:1006.4771 [hep-ph].
[55] W. Beenakker et al.,Squark and gluino hadroproduction, Int. J. Mod. Phys.A26(2011) 2637–2664,arXiv:1105.1110 [hep-ph].
[56] M. Kramer, A. Kulesza, R. van der Leeuw, M. Mangano, S. Padhi, T. Plehn, and X. Portell, Supersymmetry production cross sections in pp collisions at √
s=7 TeV,arXiv:1206.2892.
[57] ATLAS Collaboration,First tuning of HERWIG/JIMMY to ATLAS data, ATL-PHYS-PUB-2010-014.http://cdsweb.cern.ch/record/1303025.
[58] ATLAS Collaboration,Charged particle multiplicities in p p interactions at √
s=0.9and 7 TeV in a diffractive limited phase-space measured with the ATLAS detector at the LHC and new
PYTHIA6 tune, ATL-CONF-2010-031.http://cdsweb.cern.ch/record/1277665.
[59] ATLAS Collaboration,The ATLAS Simulation Infrastructure, Eur. Phys. J.C70(2010) 823–874, arXiv:1005.4568 [physics.ins-det].
[60] GEANT4 Collaboration, S. Agostinelli et al.,GEANT4: A Simulation toolkit, Nucl. Instrum.
Meth.A506(2003) 250–303.
[61] M. Cacciari and G. P. Salam,Dispelling the N3myth for the kt jet-finder, Phys. Lett.B641(2006) 57–61,arXiv:hep-ph/0512210 [hep-ph].
[62] M. Cacciari, G. P. Salam, and G. Soyez,The Anti-k(t) jet clustering algorithm, JHEP0804(2008) 063,arXiv:0802.1189 [hep-ph].
[63] ATLAS Collaboration,Jet energy measurement with the ATLAS detector in proton-proton collisions at √
(s)=7 TeV,arXiv:1112.6426 [hep-ex]. submitted to Eur. Phys. J. C.
[64] ATLAS Collaboration,Electron performance measurements with the ATLAS detector using the 2010 LHC proton-proton collision data, Eur. Phys. J.C72(2012) 1909,arXiv:1110.3174 [hep-ex].
[65] ATLAS Collaboration,Muon reconstruction efficiency in reprocessed 2010 LHC proton-proton collision data recorded with the ATLAS detector, ATLAS-CONF-2011-063.
https://cdsweb.cern.ch/record/1345743.
[66] ATLAS Collaboration,Performance of Missing Transverse Momentum Reconstruction in Proton-Proton Collisions at 7 TeV with ATLAS, Eur. Phys. J.C72(2012) 1844,
arXiv:1108.5602 [hep-ex].
[67] ATLAS Collaboration, Commissioning of the ATLAS high-performance b-tagging algorithms in 7 TeV collision data, ATL-CONF-2011-102.http://cdsweb.cern.ch/record/1369219.
[68] ATLAS Collaboration,Luminosity determination in pp collisions at √
s=7 TeV using the ATLAS detector in 2011, ATL-CONF-2011-116.http://cdsweb.cern.ch/record/1376384.
[69] ATLAS Collaboration,Luminosity Determination in pp Collisions at √
s=7TeV using the ATLAS Detector at the LHC, Eur. Phys. J.C71(2011) 1630,arXiv:1101.2185 [hep-ex].
[70] ATLAS Collaboration,Measurement of the top quark-pair production cross section with ATLAS in pp collisions at √
s=7TeV, Eur. Phys. J.C71(2011) 1577,arXiv:1012.1792 [hep-ex].
[71] ATLAS Collaboration,Measurement of the top quark pair production cross section in pp
collisions at sqrt(s)=7 TeV in dilepton final states with ATLAS, Phys. Lett.B707(2012) 459–477, arXiv:1108.3699 [hep-ex].
[72] ATLAS Collaboration,Jet energy resolution and reconstruction efficiencies from in-situ
techniques with the ATLAS detector using proton-proton collisions at a center-of-mass energy √ s
=7 TeV, ATL-CONF-2010-054.http://cdsweb.cern.ch/record/1281311.
[73] P. M. Nadolsky et al.,Implications of CTEQ global analysis for collider observation, Phys. Rev.
D78(2008) 013004,arXiv:0802.0007 [hep-ph].
[74] A. D. Martin, W. J. Stirling, R. S. Thorne, and G. Watt,Parton distributions for the LHC, Eur.
Phys. J.C63(2009) 189,arXiv:0901.0002 [hep-ph].
[75] M. Botje, J. Butterworth, A. Cooper-Sarkar, A. de Roeck, J. Feltesse, et al.,The PDF4LHC Working Group Interim Recommendations, 2011. arXiv:1101.0538 [hep-ph].
[76] A. L. Read,Presentation of search results: The CL(s) technique, J.Phys.G28(2002) 2693–2704.