ATLAS-CONF-2012-167 05December2012
ATLAS NOTE
ATLAS-CONF-2012-167
December 4, 2012
Search for a supersymmetric top-quark partner in final states with two leptons in √
s = 8 TeV pp collisions using 13 fb
−1of ATLAS data.
The ATLAS Collaboration
Abstract
The results of a search for direct pair production of supersymmetric partners of the top quark in 13.0 fb
−1of integrated luminosity from LHC
ppcollisions at 8 TeV collected by the ATLAS detector are reported. Scalar tops decaying into a
bquark and a chargino are sought for in events with two leptons in the final state. No excess above the Standard Model expectation is observed. A scalar top quark with mass between 150 and 450 GeV is excluded at 95% confidence level for a chargino approximately degenerate in mass with the scalar top and a massless lightest neutralino.
c
Copyright 2012 CERN for the benefit of the ATLAS Collaboration.
Reproduction of this article or parts of it is allowed as specified in the CC-BY-3.0 license.
1 Introduction
Partners of the top quark are an ingredient of several models addressing the hierarchy problem of the Standard Model (SM). In order to stabilize the Higgs boson mass against quadratically divergent quantum corrections, these new particles should have masses close to the electroweak symmetry breaking energy scale, and thus be accessible at the LHC. One of these models is Supersymmetry (SUSY) [1–9] which naturally resolves the hierarchy problem [10–13] by introducing supersymmetric partners of the known bosons and fermions. In the MSSM [14–18], an R-parity conserving minimal supersymmetric extension of the SM, the scalar partners of right-handed and left-handed quarks, ˜ q
Rand ˜ q
L, can mix to form two mass eigenstates. In this note a search for the lightest scalar top ˜ t
1(stop) decaying into a b quark and the lightest chargino ˜
χ±1is performed. The ˜
χ±1decays in turn with 100% branching ratio into a W boson and the lightest neutralino ˜
χ01assumed to be stable.
The final state targeted by the analysis includes two b quarks, two W bosons and additional missing transverse momentum
pmissT, with magnitude E
missT, resulting mainly from the undetected ˜
χ01. The present study addresses the two-lepton signature resulting from the leptonic decay of both scalar top quarks.
The neutrinos from the scalar top decays also contribute to the missing transverse momentum. Events with two electrons, two muons, or an electron-muon pair in the final state are selected by the analysis.
To separate the signal from the large SM background contributions dominated by top pair and W pair production, the m
T2variable [19, 20] is used. It is defined as:
m
T2(p
`T1,p`T2,pmissT)
=min
qT+rT=pmissT
n
max[ m
T(p
`T1,qT), m
T(p
`T2,rT) ]
o ,where m
Tindicates the transverse mass,
p`T1and
p`T2are the transverse momenta of the two leptons, and
qTand
rTare vectors which satisfy
qT+rT=pmissT. The minimization is performed over all the possible decompositions of
pmissT. The distribution of this variable presents a sharp kinematic limit at the W boson mass for t¯ t production [21, 22], whereas for the signal topology the kinematic limit is strongly correlated with the mass difference between the chargino and the neutralino. The results are interpreted in various two-dimensional projections of a three-dimensional parameter space defined by the masses of the stop, the chargino and the neutralino. This analysis is sensitive to mass di
fferences between the chargino and the neutralino above the W mass, and covers stop masses from
∼150 GeV upwards. It is thus complementary to other ATLAS searches for direct stop pair production [23–27] addressing different signatures with either both stop decaying to a chargino and a b quark [23, 24] or with both stop decaying to a neutralino and a top quark [25–27].
2 The ATLAS detector
The ATLAS detector [28] consists of inner tracking devices surrounded by a superconducting solenoid,
electromagnetic and hadronic calorimeters and a muon spectrometer with a toroidal magnetic field. The
Inner Detector, in combination with the axial 2 T field from the solenoid, provides precision tracking of
charged particles for
|η| <2.5, where the pseudorapidity
ηis defined in terms of the angle
θwith the
beam pipe axis as
η= −ln tan(θ/2). It consists of a silicon pixel detector, a silicon strip detector and a
straw tube tracker that also provides transition radiation measurements for electron identification. The
calorimeter system covers the pseudorapidity range
|η| <4.9. It is composed of sampling calorimeters
with either liquid argon or scintillating tiles as the active media. The muon spectrometer has separate
trigger and high-precision tracking chambers which provide muon trigger and measurement capabilities
for
|η|<2.4 and
|η|<2.7 respectively.
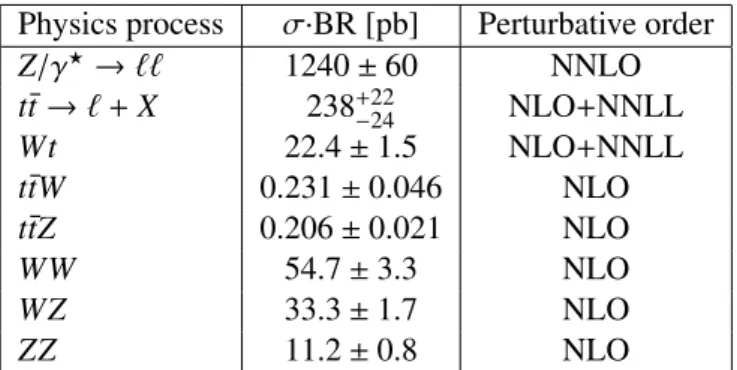
Table 1: The most important SM background processes and their production cross sections. For t¯ t and Z/γ
?, the production cross section is multiplied by the branching ratio of the leptonic decays indicated in the first column, where
` =e, µ, or
τ. TheZ/γ
?production cross section is given for events with a di-lepton invariant mass of at least 40 GeV.
Physics process
σ·BR [pb]Perturbative order
Z/γ
? →``1240
±60 NNLO
t¯ t
→`+X 238
+−2422NLO
+NNLL
Wt 22.4
±1.5 NLO+NNLL
t¯ tW 0.231
±0.046 NLO
t¯ tZ 0.206
±0.021 NLO
WW 54.7
±3.3 NLO
WZ 33.3
±1.7 NLO
ZZ 11.2
±0.8 NLO
3 Monte Carlo samples
Monte Carlo (MC) simulated event samples are used to model the signal and describe all the backgrounds leading to two prompt leptons. For the main background processes (top quark and vector boson pair production) the shape of kinematic variables is taken from MC, while the normalization is determined by measurements in appropriate control regions as described in Section 6. For the other backgrounds with two prompt leptons and for signal both normalization and shapes are taken from MC.
Top-quark pair production is simulated with
powheg[29] interfaced to
pythia[30] for the fragmenta- tion and the hadronization processes. The top-quark mass is fixed at 172.5 GeV, and the next-to-leading- order (NLO) parton distribution function (PDF) set CTEQ10 [31] is used. Additional MC samples are used to estimate the event generator systematic uncertainties: a
powhegsample interfaced with
her-
wig[32] and
jimmy[33]; a
sherpa[34] sample; two
acermc[35] samples produced by varying the
pythiaparton shower parameters in order to produce additional radiation consistent with the experimental un- certainty in the data [36, 37]. Samples of Wt events are simulated with
mc@
nlo[38, 39], interfaced with
herwigfor the fragmentation and the hadronization processes, including
jimmyfor the underlying event description. Samples of t¯ tZ and t¯ tW production are generated with
madgraph[40] interfaced to
pythia.Samples of Z/γ
?produced in association with jets are generated with
sherpausing the PDF set CT10 [41] for invariant mass of the two leptons above 40 GeV, and with
alpgenusing the PDF set CTEQ6.1 for masses between 10 and 40 GeV. Diboson samples (WW , WZ, ZZ) are generated with
sherpausing the PDF set CT10. Additional samples generated with
powhegand
herwigare used for the evaluation of the event generator systematic uncertainties.
The background predictions are normalized to theoretical cross sections, including higher-order QCD corrections when available, and are compared to data in control regions populated by events produced by SM processes. Next-to-next-to-leading-order (NNLO) cross sections are used for inclusive Z boson production [42, 43]. Approximate NLO+NNLL (next-to-next-to-leading-logarithm) cross sections are used in the normalization of the t¯ t [44] and Wt [45] samples. NLO cross sections are used for the diboson samples [38, 46] and for the t¯ tW and t¯ tZ [47] samples. Table 1 summarizes the production cross sections used in this analysis and their uncertainties.
SM processes that generate jets which are misidentified as leptons, or where a lepton from a b-hadron
or c-hadron decay is selected, collectively referred to as “fake” leptons in the following, are estimated
from data as described in Section 6.
Stop signal samples are generated with
madgraphinterfaced to
pythia6 [30] for the fragmentation and the hadronization processes. The stop is forced to decay exclusively into b- ˜
χ±11. The mixings in the scalar top and gaugino sector are chosen to be such that the light scalar top is mostly (69%) the partner t ˜
Rof the right-handed top quark, and the lightest neutralino (chargino) is almost a pure bino (wino). No significant dependence of the results from the stop mixing is expected.
Signal cross sections are calculated to NLO in the strong coupling constant, including the resumma- tion of soft gluon emission at next-to-leading-logarithmic accuracy (NLO+NLL) [48–50], as described in Ref. [51].
The MC generator parameters have been tuned to ATLAS data [52, 53] and generated events have been processed through a detector simulation [54] based on
geant4 [55], except for the t¯ t
powhegand signal samples which use fast detector simulation AtlFast-II. E
ffects of multiple proton-proton interac- tions in the same bunch crossing (pile-up) are included, with the MC samples re-weighted so that the distribution of the average number of interactions per bunch crossing agrees with that in the data.
4 Physics object reconstruction
The analysis makes use of electron, muon and jet candidates. Proton-proton interaction vertices and transverse missing momentum are also used. In this Section some details of the reconstruction and selection of these physics objects are given.
Proton-proton interaction vertex candidates are reconstructed using Inner Detector tracks. The vertex with the highest scalar sum of the p
Tof the associated tracks is defined as the primary vertex.
Jets are reconstructed from three-dimensional calorimeter energy clusters using the anti-k
tjet algo- rithm [56, 57] with a radius parameter of 0.4. The measured jet energy is corrected with a local cluster calibration [58] to account for various e
ffects of non-compensation, dead material and out-of-cluster en- ergy deposits. Final jet energy scale corrections, and corrections for in-time and out-of-time pile-up are also applied, as described in Ref. [59]. Only jet candidates with p
T >20 GeV,
|η|<2.5 and a “jet vertex fraction” larger than 0.5 are retained. Based on tracking information, the jet vertex fraction quantifies the fraction of a jet’s momentum that originates from the reconstructed primary vertex. The requirement on the jet vertex fraction rejects jets originating from additional proton-proton interactions occurring in the same bunch crossing. Events with jets failing the jet quality criteria designed to reject noise and non-collision backgrounds [59] are vetoed.
Electron candidates are required to have p
T >20 GeV,
|η| <2.47 and to satisfy “medium” elec- tromagnetic shower shape and track selection quality criteria [60]. These preselected electrons are then required to pass “tight” quality criteria [60] which place additional requirements on the ratio of calori- metric energy to track momentum, and on the fraction of hits in the straw tube tracker required to pass a higher threshold for transition radiation. The electron candidates are then required to be isolated: the scalar sum,
Σp
T, of the p
Tof Inner Detector tracks with p
T >1 GeV, not including the electron track, within a cone in the
η−φplane of radius
∆R
= p∆η2+ ∆φ2 =
0.2 around the electron candidate must be less than 10% of the electron p
T.
Muon candidates are reconstructed using either a full muon spectrometer track matched to an Inner Detector track, or a muon spectrometer segment matched to an extrapolated Inner Detector track [61].
They must be reconstructed with sufficient hits in the pixel, strip and straw tube detectors. They are required to have p
T >10 GeV,
|η| <2.4 and must have longitudinal and transverse impact parameters within 1 mm and 0.2 mm of the primary vertex, respectively. Such preselected candidates are then required to have
Σp
T <1.8 GeV, defined in analogy to the electron case.
1The simplified model assumption of 100% BR in theb- ˜χ±1 decay mode is less likely to be realised in the MSSM iftχ˜01or tχ˜02decays are kinematically allowed. Depending on the gauge mixture of the ˜t1 and the neutralino states, theb- ˜χ±1 mode may still be dominant.
Following the object reconstruction described above, overlaps between jet, electron and muon can- didates are resolved as follows: any jet within
∆R
=0.2 of preselected electrons is discarded; electrons or muons within
∆R
=0.4 of any remaining jet are then discarded to reject leptons from the decay of a b- or c-hadron.
The measurement of E
missTis based on the transverse momenta of all jets and lepton candidates and all calorimeter cluster not associated to these objects [62]. The unassociated clusters are calibrated at the electromagnetic scale.
5 Event selection
This search uses proton-proton collisions recorded at a centre-of-mass energy of 8 TeV. Data are collected with a three-level trigger system. Events are accepted if they pass either a single-electron trigger reaching a plateau e
fficiency of about 97% for isolated electrons with p
T >25 GeV, or a single-muon trigger which reaches a plateau efficiency of about 75% (90%) in the barrel (end-caps) for muons with p
T>25 GeV in 2012. After beam, detector and data quality requirements, a total integrated luminosity of (13.0± 0.5)fb
−1is used, measured as described in [63, 64].
Events are required to have exactly two opposite-sign (OS) leptons (electrons or muons). At least one electron or muon must have a momentum larger than 25 GeV, in order to be in the trigger e
fficiency plateau regions described above, and the invariant mass of the two leptons is required to to be larger than 20 GeV. If the event contains a third preselected electron or muon, the event is rejected. In order to reduce the number of background events containing two leptons produced by the on-shell decay of the Z boson, the invariant mass of the same-flavour lepton pairs must be outside the 71
−111 GeV range.
In order to reduce the number of background events in the high m
T2tails arising from events with large E
missTdue to mismeasured jets, two additional selections are applied
∆φb <1.5 and
∆φmin >1. The quantity
∆φbis the azimuthal angle between the
pmissTvector and the
p``b = pmissT +p`T1 + p`T2vector, introduced in [65]. The
p``bvariable, is the opposite of the vector sum of all the hadronic activity in the event. For WW and t¯ t backgrounds it measures the transverse boost of the WW system, and for the signal the transverse boost of the chargino-chargino system. The
∆φminvariable is the azimuthal angle di
fference between the
pmissTvector and the closest jet.
After these selections the background is dominated by t¯ t for different-flavour (DF) lepton pairs, and Z/γ
?+jets for same-flavour (SF) lepton pairs. Them
T2distribution for Z is however steeply falling and after an m
T2cut of 40 GeV the t¯ t becomes the dominant background in the SF sample as well.
Three signal regions (SRs) are defined differing only in the value of the final m
T2cut, which is required to have a value larger than 90 (SR90), 100 (SR100) or 110 (SR110) GeV. The SR90 requirement suppresses the remaining t¯ t and Z/γ
?+jets backgrounds by several orders of magnitude and strongly reduces the contribution of WW , WZ and ZZ. For SR100 and SR110 the background is dominated by diboson production.
For the t¯ t background the rejection of the m
T2 >90(100) GeV selection calculated after all the other SR cuts, is approximately a factor 200 (1500). The efficiency of the m
T2selection for stop signal samples is given in Table 2 for a few values of the top-quark partner mass, a chargino such that m(˜ t
1)
−m( ˜
χ±1)
=10 GeV, and a massless ˜
χ01. The efficiency increases with the mass difference
∆m
=m( ˜
χ±1)
−m( ˜
χ01).
6 Background estimation
The dominant SM background contributions to the SR are top and W pair production. Other diboson
processes are also expected to contribute significant background: WZ in its 3-lepton decay mode, and
ZZ decaying to two leptons and two neutrinos. They are evaluated by defining three control regions (CR)
Table 2: Efficiency of the signal region selections, calculated after all other selection requirements ap- plied in the SR, for signal samples with different values of the mass of the stop, a chargino approximately degenerate in mass with the stop, and a massless lightest neutralino. Uncertainties from MC statistics ranges from 0.2% to1.6%.
Stop mass [GeV] 200 300 400 500 600
Signal region SR90 14.5% 28.8% 37.9% 47.2% 54.0%
Signal region SR100 9.9% 24.4% 34.4% 44.1% 50.5%
Signal region SR110 6.2% 20.0% 30.0% 39.5% 47.2%
and using MC simulation to extrapolate the rate measured in each CR to the expected background yield in the SR.
The three control regions are defined as:
• CRT, defined by DF events with 40 GeV<
m
T2 <80 GeV and p
bll >30 GeV, and passing all the SR selections on other variables. The p
bllvariable is the magnitude of
p``bintroduced in Section 5.
This region is populated by top-quark pairs with a purity of 73%.
• CRW, defined by DF events with 40 GeV<
m
T2 <80 GeV and p
bll <15 GeV, and passing all the SR selections on other variables. This region is populated by WW events with a purity of 60%.
• CRZ, defined by SF events which pass all the selections of the SR with
m
T2 >90 GeV, except that the two-lepton invariant mass is required to be between 71 GeV and 111 GeV. This region is populated by WZ and ZZ events, with a purity of 74%.
With this approach, the ratio of events for each of the background sources in the CRs and SRs is taken from MC, and the normalisation from data. Systematic uncertainties on MC simulation affect the ratio of the expected yields in the di
fferent regions and are taken into account to determine the uncertainty on the background prediction. The evaluation is performed by means of a likelihood fit with the observed rates in the three CRs as constraints, and the normalisation terms for each of the three backgrounds as free parameters. The systematic uncertainties are described by nuisance parameters, but are not constrained by the fit.
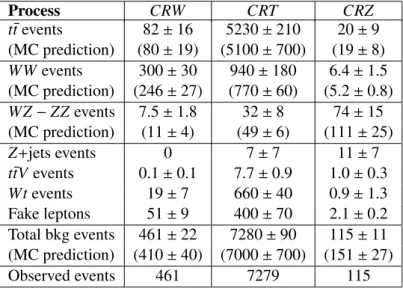
The expected background composition of the three CRs is given in Table 3.
In order to verify the accuracy of the extrapolation, two validation regions for the top and WW backgrounds are defined:
• VRT, defined by events with 40 GeV <
m
T2 <80 GeV, at least one jet, 15 GeV
<p
bll <30 GeV, and passing the SR selections on other variables. This region is populated by top-quark pairs with a purity of 61%.
• VRW, defined by events with 40 GeV <
m
T2 <80 GeV, jet veto, 15 GeV
<p
bll <30 GeV, and passing the SR selections on other variables. This region is populated by WW events with a purity of 56%.
The comparison between the predicted number of events in the two VR is given in Table 4. A good agreement is observed between the observed and predicted event yields.
Additional SM processes yielding two isolated leptons and E
missT(Wt, Z
+jets,t¯ tW and t¯ tZ), and
providing a sub-dominant contribution to the SR are determined from MC.
Table 3: Background fit results for the CRW, CRT and CRZ regions. Nominal MC expectations (nor- malised to theoretical cross-sections) are given for comparison for those backgrounds (top and boson pair production) which are normalized to data. Combined statistical and systematic uncertainties are indicated. Events with fake leptons are estimated with the data-driven technique described in Section 6.
Process
CRW CRT CRZ
t¯ t events 82
±16 5230
±210 20
±9 (MC prediction) (80
±19) (5100
±700) (19
±8) WW events 300
±30 940
±180 6.4
±1.5 (MC prediction) (246
±27) (770
±60) (5.2
±0.8) WZ
−ZZ events 7.5
±1.8 32
±8 74
±15 (MC prediction) (11
±4) (49
±6) (111
±25)
Z
+jets events0 7
±7 11
±7
t¯ tV events 0.1
±0.1 7.7
±0.9 1.0
±0.3
Wt events 19
±7 660
±40 0.9
±1.3
Fake leptons 51
±9 400
±70 2.1
±0.2 Total bkg events 461
±22 7280
±90 115
±11 (MC prediction) (410
±40) (7000
±700) (151
±27)
Observed events 461 7279 115
Table 4: Background fit results for the VRW and VRT regions. Nominal MC expectations (normalised to theoretical cross-sections) are given for comparison for those backgrounds (top and boson pair pro- duction) which are normalized to data.Combined statistical and systematic uncertainties are indicated.
Events with fake leptons are estimated with the data-driven technique described in Section 6.
Process VRW VRT
t¯ t events 72
±23 380
±50 (MC prediction) (70
±25) (370
±70) WW events 810
±110 124
±25 (MC prediction) (660
±50) (101
±15) WZ
−ZZ events 26
±6 5.9
±1.7 (MC prediction) (40
±10) (9
±3) Z
+jets events 190
±40 61
±26 t¯ tV events 0.0
±0.0 0.4
±0.2
Wt events 41
±9 60
±10
Fake leptons 160
±30 40
±8 Total bkg events 1290
±120 670
±70 (MC prediction) (1150
±70) (640
±80)
Observed events 1242 633
The fake lepton background consists of semi-leptonic t¯ t, s-channel and t-channel single top, W
+jetsand light- and heavy-flavour jet production. The contribution from this background is small (less than 10% of the total background). It is estimated from data with a method similar to that described in Refs. [66, 67]. Two types of lepton identification criteria are defined for this evaluation: “tight”, corre- sponding to the full set of identification criteria described above, and “loose”, corresponding to prese- lected electrons and muons. The method counts the number of observed events containing loose-loose, loose-tight, tight-loose and tight-tight lepton pairs in the SR. The probability for real leptons passing the loose selection criteria to also pass the tight selection is measured using a Z
→``(`
=e, µ) sample. The equivalent probability for fake leptons is measured from multijet-enriched control samples. The number of events containing a contribution from one or two fake leptons is calculated from these probabilities.
7 Systematic Uncertainties
Various systematic uncertainties affecting the predicted background rates in the signal regions are con- sidered. Such uncertainties are either used directly in the evaluation of the predicted background in the SR when this is derived by MC (Wt, Z
+jets, t¯ tW and t¯ tZ production), or to compute the uncertainty on the transfer factor and propagate it to the predicted event yields in the SR when the background is constrained using the fitting method described in Section 3 (for t¯ t and dibosons).
The following experimental systematic uncertainties are found to be non-negligible:
Jet energy scale and resolution.
The uncertainty on the jet energy scale (JES), derived using single particle response and test beam data, varies as a function of the jet p
Tand pseudorapidity [59]. Additional systematic uncertainties arise from the dependence of the jet response on the number of interactions per bunch crossing and on the jet flavour. The energy scale uncertainties vary as a function of jet p
Tand
η, and range from about 2.5% at 60 GeV in the central region to about 14% below 30 GeV in theforward regions. The components of the jet energy scale uncertainty are varied by
±1σin the MC simulation in order to obtain the resulting uncertainty in the event yield. Uncertainties related to the jet energy resolution (JER) are obtained with an in situ measurement of the jet response asymmetry in dijet events [68]. Their impact on the event yield is estimated by applying an additional smearing to the jet transverse momenta. The JES and JER variations applied to the jet momenta are propagated to the E
Tmiss.
Calorimeter cluster energy scale, resolution and pile-up modelling.The uncertainties related to the contribution to E
missTfrom the energy scale and resolution of the calorimeter cells not associated to electrons, muons or jets, and also from low momentum (7 GeV
<p
T <25 GeV) jets, as well as the uncertainty due to the modelling of pile-up have been evaluated.
Fake-lepton background uncertainties :
An uncertainty on the fake background is assigned from the comparison of results from different CRs, from the statistics of the control samples used to measure the probabilities to pass the tight selection, and from the statistics of the loose-loose, loose-tight, tight- loose, and tight-tight event samples.
The uncertainties on lepton ID and measurement and on trigger modelling have a negligible impact on the analysis. A 3.6% uncertainty on the luminosity determination, measured using techniques similar to that of Ref. [63], is included for all signal and background MC normalisations.
The leading theoretical uncertainties are due to the modelling of the diboson background, evaluated comparing the predictions of S
herpawith those of P
owheg, and of the top pair background, evaluated comparing the predictions of Powheg with those of AcerMC and Sherpa for the matrix element cal- culation, the predictions of P
ythiaand H
erwigfor the parton showering and hadronization, and the predictions of two A
cerMC samples with di
fferent tunings for the uncertainties related to the amount of ISR
/FSR radiation.
Other significant sources of uncertainty are the limited statistics in the CRs and MC.
A summary of the uncertainties on the total expected background in the two channels is given in Table 5. The row labelled “statistics” includes the e
ffects of the limited number of data events in the CRs and the limited number of MC events.
Table 5: Total uncertainties for the three signal regions. Note that the individual uncertainties can be correlated, and need not sum quadratically to the total background uncertainty.
S R90 S R100 S R110
JES 2% 3% 3%
JER 4% 1% 9%
cluster energy scale 2% 2% 8%
cluster energy resolution 0% 0% 9%
pileup 7% 6% 1%
diboson generator 2% 9% 15%
top generator 8% 5% 3%
top ISRFSR 4% 3% 1%
top parton shower 3% 11% 4%
MC stat 3% 8% 13%
t¯ t normalization 3% 1% 1%
WW normalization 4% 6% 8%
WZ/ZZ normalization 1% 2% 3%
Fake-lepton uncertainties 1% 1% 1%
Total uncertainty 14% 20% 28%
Experimental systematic uncertainties are also taken into account for expected signal yields.
The uncertainty on the signal cross sections is calculated with an envelope of cross section predic- tions which is defined using the 68% confidence level (CL) ranges of the CTEQ [69] (including the
αSuncertainty) and MSTW [70] PDF sets, together with variations of the factorization and renormaliza- tion scales by factors of two or one half. The nominal cross section value is taken to be the midpoint of the envelope and the uncertainty assigned is half the full width of the envelope, using the procedure described in Ref. [51]. The typical cross section uncertainty is 15% for the scalar top signal.
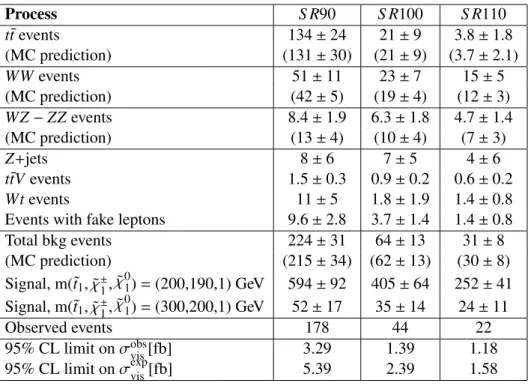
8 Results
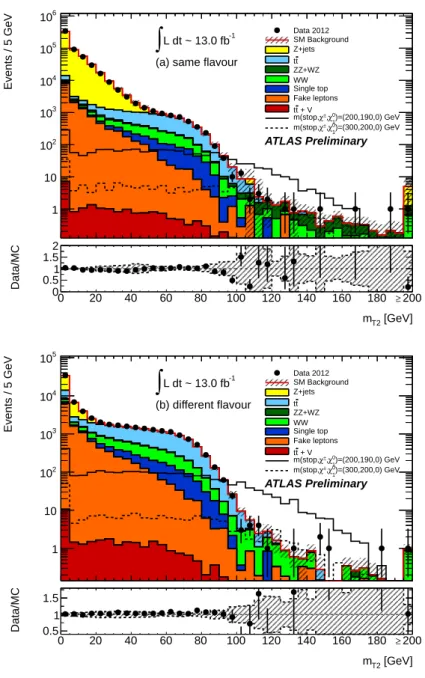
Figure 1 shows the distributions of the m
T2variable for SF and DF events after all selection criteria are applied except for the selection on m
T2itself. For illustration, the distributions for two signal models are also shown. The data agree with the SM background expectation within uncertainties.
Table 6 shows the expected number of events in the SR for each background source and the observed number of events. No excess of events in data is observed, indeed the observed yields are about one standard deviation lower than the expected values. Given the correlation between the signal regions and systematic uncertainties the observed discrepancy is less than 2 sigma. Limits at 95% CL are derived on the visible cross section
σvis= σ×× A, whereσis the total production cross section for the non-SM signal,
Ais the acceptance defined by the fraction of events passing the geometric and kinematic selec- tions at particle level, and is the detector reconstruction, identification and trigger e
fficiency. Limits are set using the CL
slikelihood ratio prescription as described in Ref. [71]. Systematic uncertainties are included in the likelihood function as nuisance parameters with a gaussian probability density function.
Uncertainties on the detector response, cross section, luminosity and MC statistics are taken into account.
[GeV]
mT2
0 20 40 60 80 100 120 140 160 180 200
Events / 5 GeV
1 10 102
103
104
105
106
L dt ~ 13.0 fb-1
∫
ATLAS Preliminary (a) same flavour
Data 2012 SM Background Z+jets
t t ZZ+WZ WW Single top Fake leptons
+ V t t
)=(200,190,0) GeV 1
χ0
±, χ m(stop,
)=(300,200,0) GeV 1
χ0
±, χ m(stop,
[GeV]
mT2
0 20 40 60 80 100 120 140 160 180 200
Data/MC 0
0.51 1.52
≥
[GeV]
mT2
0 20 40 60 80 100 120 140 160 180 200
Events / 5 GeV
1 10 102
103
104
105
L dt ~ 13.0 fb-1
∫
ATLAS Preliminary (b) different flavour
Data 2012 SM Background Z+jets
t t ZZ+WZ WW Single top Fake leptons
+ V t t
)=(200,190,0) GeV 1
χ0
±, χ m(stop,
)=(300,200,0) GeV 1
χ0
±, χ m(stop,
[GeV]
mT2
0 20 40 60 80 100 120 140 160 180 200
Data/MC 0.5
1 1.5
≥
Figure 1: Distribution of m
T2for events passing all the signal candidate selection requirements, except that on m
T2, for (a) SF and (b) DF events. The contributions from all SM backgrounds are shown;
the bands represent the total uncertainties. The components labelled “fake lepton” are estimated from data as described in the text; the other backgrounds are estimated from MC simulation with normal- izations measured in control regions described in Section 6 for t¯ t and diboson backgrounds. The dis- tributions of the signal expected for two models considered in this paper are also shown: the full line corresponds to a model with m(˜ t
1)=200 GeV, m( ˜
χ±1)=190 GeVand m( ˜
χ01)=0; the dashed line to a model with m(˜ t
1)
=300 GeV, m( ˜
χ±1)
=200 GeVand m( ˜
χ01)
=0.
For each signal hypothesis, the fit of the top pair and boson pair normalization is re-done taking into ac-
count the signal contamination in the control regions. Signal contamination decreases with increasing
stop mass and ranges from negligible to nearly 30%. The 95% CL upper limit on the cross section times
efficiency within acceptance (which equals the limit on the observed number of signal events originating from sources other than the Standard Model divided by the luminosity), is also listed in Table 6.
Table 6: Background fit results for the SR90, SR100 and SR110 regions, for an integrated luminosity of 13.0fb
−1at 8 TeV center of mass energy. Nominal MC expectations (normalised to MC cross-sections) are given for comparison for those backgrounds (top and boson pair production) which are normalized to data. Combined statistical and systematic uncertainties are indicated.
Process
S R90 S R100 S R110
t¯ t events 134
±24 21
±9 3.8
±1.8
(MC prediction) (131
±30) (21
±9) (3.7
±2.1)
WW events 51
±11 23
±7 15
±5
(MC prediction) (42
±5) (19
±4) (12
±3)
WZ
−ZZ events 8.4
±1.9 6.3
±1.8 4.7
±1.4
(MC prediction) (13
±4) (10
±4) (7
±3)
Z
+jets8
±6 7
±5 4
±6
t¯ tV events 1.5
±0.3 0.9
±0.2 0.6
±0.2
Wt events 11
±5 1.8
±1.9 1.4
±0.8
Events with fake leptons 9.6
±2.8 3.7
±1.4 1.4
±0.8
Total bkg events 224
±31 64
±13 31
±8
(MC prediction) (215
±34) (62
±13) (30
±8)
Signal, m(˜ t
1,χ˜
±1,χ˜
01)
=(200,190,1) GeV 594
±92 405
±64 252
±41 Signal, m(˜ t
1,χ˜
±1,χ˜
01)
=(300,200,1) GeV 52
±17 35
±14 24
±11
Observed events 178 44 22
95% CL limit on
σobsvis[fb] 3.29 1.39 1.18
95% CL limit on
σexpvis[fb] 5.39 2.39 1.58
The results obtained are used to derive limits on the mass of a pair-produced scalar top ˜ t
1decaying with 100% branching ratio into a chargino and a b-quark. The sensitivity of this search depends on the three parameters, namely the scalar top, chargino and neutralino masses, and their correlations. Two- dimentional projections are made to quantify the exclusion limits on the various parameters: the stop–
chargino mass plane for a massless neutralino; the stop–neutralino mass plane for a fixed value of m(˜ t)
−m( ˜
χ±1)
=10 GeV; the chargino–neutralino mass plane for a fixed 300 GeV stop quark mass.
A scalar top quark of mass between 150 and 450 GeV is excluded at 95% CL for a massless neutralino and a chargino approximately degenerate with the scalar top quark. For a massless neutralino and a 200 GeV chargino the 95% CL exclusion range on the scalar top quark mass is 200
−335 GeV. For a 300 GeV scalar top quark and a 290 GeV chargino, models with a neutralino with mass lower than 175 GeV are excluded at 95% CL.
9 Conclusions
A search for a scalar partner of the top quark, which decays into a b quark and a chargino, has been performed using 13.0 fb
−1of pp collision data at
√s
=8 TeV produced by the LHC and collected by the ATLAS detector. The number of observed events has been found to be consistent with the Standard Model expectation.
Limits have been set on the mass of a supersymmetric scalar top for different assumptions on the mass
hierarchy scalar top-chargino-lightest neutralino. A supersymmetric scalar top ˜ t
1with a mass between
[GeV]
t1
m~
150 200 250 300 350 400 450 500 550
[GeV]± 1χ∼m
100 150 200 250 300 350 400 450 500
= 8 TeV s
-1, L dt = 13.0 fb
∫
1χ∼0
Massless
±b χ∼1 1→
~t production, t1
~ t1
~
ATLAS Preliminary
[GeV]
t1
m~
150 200 250 300 350 400 450 500 550
[GeV]± 1χ∼m
100 150 200 250 300 350 400 450 500
theory) σSUSY
±1 Observed limit (
exp) σ
±1 Expected limit (
All limits at 95% CL
- mb t1
~
± = m
χ1
m∼
[GeV]
t1
m~
150 200 250 300 350 400 450 500 550
[GeV]0 1χ∼m
0 50 100 150 200 250 300
= 8 TeV s
-1, L dt = 13.0 fb
∫
1) = 10 GeVχ∼± 1)-m(
~t m(
±b χ∼1 1→
~t production, t1
~ t1
~
ATLAS Preliminary
[GeV]
t1
m~
150 200 250 300 350 400 450 500 550
[GeV]0 1χ∼m
0 50 100 150 200 250 300
theory) σSUSY
±1 Observed limit (
exp) σ
±1 Expected limit (
All limits at 95% CL
[GeV]
± χ∼1
m 100 120 140 160 180 200 220 240 260 280 [GeV]0 1χ∼m
0 20 40 60 80 100 120 140 160 180 200
= 8 TeV s
-1, L dt = 13.0 fb
∫
300 GeV stop±b χ∼1 1→
~t production, t1
~ t1
~
ATLAS Preliminary
[GeV]
± χ∼1
m 100 120 140 160 180 200 220 240 260 280 [GeV]0 1χ∼m
0 20 40 60 80 100 120 140 160 180 200
theory) σSUSY
±1 Observed limit (
exp) σ
±1 Expected limit (
All limits at 95% CL
Figure 2: Expected 95% CL limits on the masses of the stop, ˜
χ±1, and ˜
χ01, from the analysis of 13.0 fb
−1of 8 TeV collision data. Top: limits on the chargino and stop masses for a massless neutralino. Middle:
limits on the neutralino and stop masses for a fixed value of m(˜ t)
−m( ˜
χ±1)
=10 GeV. Bottom: limits on neutralino and chargino masses for a fixed 300 GeV stop mass. The dashed line and the shaded band are the expected limit and its
±1σuncertainty, respectively. The thick solid line is the observed limit for the central value of the signal cross section. The expected and observed limits do not include the effect of the theoretical uncertainties on the signal cross section. The dotted lines show the e
ffect on the observed
11
150 and 450 GeV decaying with 100% BR to a b quark and a chargino is also excluded at 95% CL for a chargino approximately degenerate with the scalar top and a massless lightest neutralino.
References
[1] H. Miyazawa, Baryon Number Changing Currents, Prog. Theor. Phys.
36 (6)(1966) 1266–1276.
[2] P. Ramond, Dual Theory for Free Fermions, Phys. Rev.
D3(1971) 2415–2418.
[3] Y. Golfand and E. Likhtman, Extension of the Algebra of Poincare Group Generators and Violation of p Invariance, JETP Lett.
13(1971) 323–326.
[4] A. Neveu and J. H. Schwarz, Factorizable dual model of pions, Nucl. Phys.
B31(1971) 86–112.
[5] A. Neveu and J. H. Schwarz, Quark Model of Dual Pions, Phys. Rev.
D4(1971) 1109–1111.
[6] J. Gervais and B. Sakita, Field theory interpretation of supergauges in dual models, Nucl. Phys.
B34
(1971) 632–639.
[7] D. Volkov and V. Akulov, Is the Neutrino a Goldstone Particle?, Phys. Lett.
B46(1973) 109–110.
[8] J. Wess and B. Zumino, A Lagrangian Model Invariant Under Supergauge Transformations, Phys.
Lett.
B49(1974) 52.
[9] J. Wess and B. Zumino, Supergauge Transformations in Four-Dimensions, Nucl. Phys.
B70(1974) 39–50.
[10] S. Weinberg, Implications of Dynamical Symmetry Breaking, Phys. Rev.
D13(1976) 974–996.
[11] E. Gildener, Gauge Symmetry Hierarchies, Phys. Rev.
D14(1976) 1667.
[12] S. Weinberg, Implications of Dynamical Symmetry Breaking: An Addendum, Phys. Rev.
D19(1979) 1277–1280.
[13] L. Susskind, Dynamics of Spontaneous Symmetry Breaking in the Weinberg- Salam Theory, Phys.
Rev.
D20(1979) 2619–2625.
[14] P. Fayet, Supersymmetry and Weak, Electromagnetic and Strong Interactions, Phys. Lett.
B64(1976) 159.
[15] P. Fayet, Spontaneously Broken Supersymmetric Theories of Weak, Electromagnetic and Strong Interactions, Phys. Lett.
B69(1977) 489.
[16] G. R. Farrar and P. Fayet, Phenomenology of the Production, Decay, and Detection of New Hadronic States Associated with Supersymmetry, Phys. Lett.
B76(1978) 575–579.
[17] P. Fayet, Relations Between the Masses of the Superpartners of Leptons and Quarks, the Goldstino Couplings and the Neutral Currents, Phys. Lett.
B84(1979) 416.
[18] S. Dimopoulos and H. Georgi, Softly Broken Supersymmetry and SU(5), Nucl. Phys.
B193(1981) 150.
[19] C. G. Lester and D. J. Summers, Measuring masses of semiinvisibly decaying particles pair
produced at hadron colliders, Phys. Lett.
B463(1999) 99–103, arXiv:hep-ph/9906349.
[20] A. Barr, C. Lester, and P. Stephens, m(T2) : The Truth behind the glamour, J. Phys.
G29(2003) 2343–2363, arXiv:hep-ph/0304226.
[21] W. S. Cho, K. Choi, Y. G. Kim, and C. B. Park, Measuring superparticle masses at hadron collider using the transverse mass kink, JHEP
0802(2008) 035, arXiv:0711.4526 [hep-ph].
[22] M. Burns, K. Kong, K. T. Matchev, and M. Park, Using Subsystem MT2 for Complete Mass Determinations in Decay Chains with Missing Energy at Hadron Colliders, JHEP
0903(2009) 143, arXiv:0810.5576 [hep-ph].
[23] ATLAS Collaboration, Search for light top squark pair production in final states with leptons and b−jets with the ATLAS detector in
√s
=7 TeV proton-proton collisions, arXiv:1209.2102 [hep-ex].
[24] ATLAS Collaboration, Search for light scalar top quark pair production in final states with two leptons with the ATLAS detector in
√s
=7 TeV proton-proton collisions, arXiv:1208.4305 [hep-ex].
[25] ATLAS Collaboration, Search for a supersymmetric partner to the top quark in final states with jets and missing transverse momentum at
√s
=7 TeV with the ATLAS detector, arXiv:1208.1447 [hep-ex].
[26] ATLAS Collaboration, Search for direct top squark pair production in final states with one isolated lepton, jets, and missing transverse momentum in
√s
=7 TeV pp collisions using 4.7 fb-1 of ATLAS data, Phys. Rev. Lett.
109(2012) 2011803, arXiv:1208.2590 [hep-ex].
[27] ATLAS Collaboration, Search for a heavy top-quark partner in final states with two leptons with the ATLAS detector at the LHC, arXiv:1209.4186 [hep-ex].
[28] ATLAS Collaboration, The ATLAS Experiment at the CERN Large Hadron Collider, JINST
3(2008) S08003.
[29] S. Frixione, P. Nason, and C. Oleari, Matching NLO QCD computations with Parton Shower simulations: the POWHEG method, JHEP
0711(2007) 070, arXiv:0709.2092 [hep-ph].
[30] T. Sjostrand, S. Mrenna, and P. Z. Skands, PYTHIA 6.4 Physics and Manual, JHEP
0605(2006) 026, arXiv:hep-ph/0603175 [hep-ph].
[31] H.-L. Lai et al., New parton distributions for collider physics, Phys. Rev.
D82(2010) 074024, arXiv:1007.2241 [hep-ph].
[32] G. Corcella et al., HERWIG 6: An Event generator for hadron emission reactions with interfering gluons (including supersymmetric processes), JHEP
0101(2001) 010, arXiv:hep-ph/0011363 [hep-ph].
[33] J. Butterworth, J. R. Forshaw, and M. Seymour, Multiparton interactions in photoproduction at HERA, Z.Phys.
C72(1996) 637–646, arXiv:hep-ph/9601371 [hep-ph].
[34] T. Gleisberg et al., Event generation with SHERPA 1.1, JHEP
0902(2009) 007, arXiv:0811.4622 [hep-ph].
[35] B. P. Kersevan and E. Richter-Was, The Monte Carlo event generator AcerMC version 2.0 with
interfaces to PYTHIA 6.2 and HERWIG 6.5, arXiv:hep-ph/0405247 [hep-ph].
[36] ATLAS Collaboration, Measurement of t¯ t production with a veto on additional central jet activity in pp collisions at
√s
=7 TeV using the ATLAS detector, arXiv:1203.5015 [hep-ex].
accepted by Eur. Phys. J. C.
[37] ATLAS Collaboration, Measurement of underlying event characteristics using charged particles in pp collisions at
√s
=900 GeV and 7 TeV with the ATLAS detector in a limited phase space, ATL-PHYS-PUB-2011-009. https://cdsweb.cern.ch/record/1327186.
[38] S. Frixione and B. R. Webber, Matching NLO QCD computations and parton shower simulations, JHEP
0206(2002) 029, arXiv:hep-ph/0204244 [hep-ph].
[39] S. Frixione, E. Laenen, P. Motylinski, and B. R. Webber, Single-top production in MC@NLO, JHEP
03(2006) 092, arXiv:hep-ph/0512250.
[40] J. Alwall, M. Herquet, F. Maltoni, O. Mattelaer, and T. Stelzer, MadGraph 5 : Going Beyond, JHEP
1106(2011) 128, arXiv:1106.0522 [hep-ph].
[41] J. Pumplin et al., New generation of parton distributions with uncertainties from global QCD analysis, JHEP
0207(2002) 012, arXiv:hep-ph/0201195 [hep-ph].
[42] R. Hamberg, W. van Neerven, and T. Matsuura, A Complete calculation of the order
α2scorrection to the Drell-Yan K factor, Nucl. Phys.
B359(1991) 343–405.
[43] R. Gavin, Y. Li, F. Petriello, and S. Quackenbush, W physics at the LHC with FEWZ 2.1, arXiv:1201.5896 [hep-ph].
[44] M. Aliev et al., HATHOR: HAdronic Top and Heavy quarks crOss section calculatoR, Comput.Phys.Commun.
182(2011) 1034–1046, arXiv:1007.1327 [hep-ph].
[45] N. Kidonakis, Two-loop soft anomalous dimensions for single top quark associated production with a W- or H-, Phys. Rev.
D82(2010) 054018, arXiv:1005.4451 [hep-ph].
[46] T. Binoth, M. Ciccolini, N. Kauer, and M. Kramer, Gluon-induced W-boson pair production at the LHC, JHEP
0612(2006) 046, arXiv:hep-ph/0611170 [hep-ph].
[47] A. Lazopoulos, T. McElmurry, K. Melnikov, and F. Petriello, Next-to-leading order QCD corrections to t tZ production at the LHC, Phys. Lett. ¯
B666(2008) 62–65, arXiv:0804.2220 [hep-ph].
[48] W. Beenakker, M. Kramer, T. Plehn, M. Spira, and P. M. Zerwas, Stop production at hadron colliders, Nucl. Phys.
B515(1998) 3–14, hep-ph/9710451.
[49] W. Beenakker et al., Supersymmetric top and bottom squark production at hadron colliders, JHEP
1008(2010) 098, arXiv:1006.4771 [hep-ph].
[50] W. Beenakker et al., Squark and gluino hadroproduction, Int. J. Mod. Phys.
A26(2011) 2637–2664, arXiv:1105.1110 [hep-ph].
[51] M. Kramer, A. Kulesza, R. van der Leeuw, M. Mangano, S. Padhi, T. Plehn, and X. Portell, Supersymmetry production cross sections in pp collisions at
√s
=7 TeV, arXiv:1206.2892.
[52] ATLAS Collaboration, First tuning of HERWIG
/JIMMY to ATLAS data,
ATL-PHYS-PUB-2010-014. http://cdsweb.cern.ch/record/1303025.
[53] ATLAS Collaboration, Charged particle multiplicities in p p interactions at
√s
=0.9 and 7 TeV in a di
ffractive limited phase-space measured with the ATLAS detector at the LHC and new
PYTHIA6 tune, ATL-CONF-2010-031. http://cdsweb.cern.ch/record/1277665.
[54] ATLAS Collaboration, The ATLAS Simulation Infrastructure, Eur. Phys. J.
C70(2010) 823–874, arXiv:1005.4568 [physics.ins-det].
[55] GEANT4 Collaboration, S. Agostinelli et al., GEANT4: A Simulation toolkit, Nucl. Instrum.
Meth.
A506(2003) 250–303.
[56] M. Cacciari and G. P. Salam, Dispelling the N
3myth for the k
tjet-finder, Phys. Lett.
B641(2006) 57–61, arXiv:hep-ph/0512210 [hep-ph].
[57] M. Cacciari, G. P. Salam, and G. Soyez, The Anti-k(t) jet clustering algorithm, JHEP
0804(2008) 063, arXiv:0802.1189 [hep-ph].
[58] T. Barillari et al., Local cluster calibration, ATLAS-LARG-PUB-2009-001.
https://cdsweb.cern.ch/record/1453787.
[59] ATLAS Collaboration, Jet energy measurement with the ATLAS detector in proton-proton collisions at
√s
=7 TeV , arXiv:1112.6426 [hep-ex]. submitted to Eur. Phys. J. C.
[60] ATLAS Collaboration, Electron performance measurements with the ATLAS detector using the 2010 LHC proton-proton collision data, Eur. Phys. J.
C72(2012) 1909, arXiv:1110.3174 [hep-ex].
[61] ATLAS Collaboration, Muon reconstruction e
fficiency in reprocessed 2010 LHC proton-proton collision data recorded with the ATLAS detector, ATLAS-CONF-2011-063.
https://cdsweb.cern.ch/record/1345743.
[62] ATLAS Collaboration, Performance of Missing Transverse Momentum Reconstruction in Proton-Proton Collisions at 7 TeV with ATLAS, Eur. Phys. J.
C72(2012) 1844,
arXiv:1108.5602 [hep-ex].
[63] ATLAS Collaboration, Luminosity determination in pp collisions at
√s
=7 TeV using the ATLAS detector in 2011, ATL-CONF-2011-116. http://cdsweb.cern.ch/record/1376384.
[64] ATLAS Collaboration, Luminosity Determination in pp Collisions at
√s
=7 TeV using the ATLAS Detector at the LHC, Eur. Phys. J.
C71(2011) 1630, arXiv:1101.2185 [hep-ex].
[65] G. Polesello and D. R. Tovey, Supersymmetric particle mass measurement with the
boost-corrected contransverse mass, JHEP
1003(2010) 030, arXiv:0910.0174 [hep-ph].
[66] ATLAS Collaboration, Measurement of the top quark-pair production cross section with ATLAS in pp collisions at
√s
=7 TeV, Eur. Phys. J.
C71(2011) 1577, arXiv:1012.1792 [hep-ex].
[67] ATLAS Collaboration, Measurement of the top quark pair production cross section in pp
collisions at sqrt(s)
=7 TeV in dilepton final states with ATLAS, Phys. Lett.
B707(2012) 459–477, arXiv:1108.3699 [hep-ex].
[68] ATLAS Collaboration, Jet energy resolution and reconstruction e
fficiencies from in-situ
techniques with the ATLAS detector using proton-proton collisions at a center-of-mass energy
√s
=
7 TeV , ATL-CONF-2010-054. http://cdsweb.cern.ch/record/1281311.
[69] P. M. Nadolsky et al., Implications of CTEQ global analysis for collider observation, Phys. Rev.
D78
(2008) 013004, arXiv:0802.0007 [hep-ph].
[70] A. D. Martin, W. J. Stirling, R. S. Thorne, and G. Watt, Parton distributions for the LHC, Eur.
Phys. J.
C63(2009) 189, arXiv:0901.0002 [hep-ph].
[71] A. L. Read, Presentation of search results: The CL(s) technique, J.Phys.
G28(2002) 2693–2704.
[GeV]
t1
m~
150 200 250 300 350 400 450 500 550
[GeV]± 1χ∼m
100 150 200 250 300 350 400 450 500
= 8 TeV s
-1, L dt = 13.0 fb
∫
1χ∼0
Massless
±b χ∼1 1→
~t production, t1
~ t1
~
ATLAS Preliminary
[GeV]
t1
m~
150 200 250 300 350 400 450 500 550
[GeV]± 1χ∼m
100 150 200 250 300 350 400 450 500
theory) σSUSY
±1 Observed limit (
exp) σ
±1 Expected limit (
All limits at 95% CL
1.00 0.80 0.87 1.03 1.00 1.03 1.06
0.28 0.27
0.00
0.00 0.02 0.26 0.51 0.79
0.00
0.00 0.00 0.08 0.38 0.80
0.00 0.00 0.00 0.21
0.00 0.00 0.12 0.66
0.00
0.00 0.42
0.18
- mb t1
~
± = m
χ1
m∼
[GeV]
t1
m~
150 200 250 300 350 400 450 500 550
[GeV]0 1χ∼m
0 50 100 150 200 250 300
= 8 TeV s
-1, L dt = 13.0 fb
∫
1) = 10 GeVχ∼± 1)-m(
~t m(
±b χ∼1 1→
~t production, t1
~ t1
~
ATLAS Preliminary
[GeV]
t1
m~
150 200 250 300 350 400 450 500 550
[GeV]0 1χ∼m
0 50 100 150 200 250 300
theory) σSUSY
±1 Observed limit (
exp) σ
±1 Expected limit (
All limits at 95% CL
0.00 0.00 0.00 0.00 0.00 0.00 0.18
0.00 0.00
0.00 0.00 0.00
0.00 0.00
0.84 0.00
0.00 0.00 0.16
0.00 0.00
0.79
1.04 0.00 0.00
0.00 1.12
1.04 0.48 0.01 0.22
0.68 0.12
0.86 0.42
0.99
0.92
[GeV]
± χ∼1
m 100 120 140 160 180 200 220 240 260 280 [GeV]0 1χ∼m
0 20 40 60 80 100 120 140 160 180 200
= 8 TeV s
-1, L dt = 13.0 fb
∫
300 GeV stop±b χ∼1 1→
~t production, t1
~ t1
~
ATLAS Preliminary
[GeV]
± χ∼1
m 100 120 140 160 180 200 220 240 260 280 [GeV]0 1χ∼m
0 20 40 60 80 100 120 140 160 180 200
theory) σSUSY
±1 Observed limit (
exp) σ
±1 Expected limit (
All limits at 95% CL
1.03 0.26 0.00 0.00 0.00
0.99 0.92 0.02 0.00 0.00
1.00 0.46 0.00 0.00
1.02 0.18 0.00
0.48