ATLAS-CONF-2015-078 15December2015
ATLAS NOTE
ATLAS-CONF-2015-078
14th December 2015
Search for supersymmetry at √
s = 13 TeV in final states with jets and two same-sign leptons or three leptons with the ATLAS
detector
The ATLAS Collaboration
Abstract
A search for strongly produced supersymmetric particles is conducted using signatures in- volving multiple energetic jets and either two isolated leptons (eorµ) with the same electric charge or at least three isolated leptons. The search also utilises jets originating from b- quarks, missing transverse momentum and other observables to extend its sensitivity. The analysis uses a data sample of proton-proton collisions at√
s = 13TeV recorded with the ATLAS detector at the Large Hadron Collider in 2015 corresponding to a total integrated lu- minosity of 3.2 fb−1. No significant excess over the Standard Model expectation is observed, and the results are interpreted on several simplified supersymmetric models extending the exclusion limits from previous searches.
c
2015 CERN for the benefit of the ATLAS Collaboration.
Reproduction of this article or parts of it is allowed as specified in the CC-BY-4.0 license.
1 Introduction
Supersymmetry (SUSY) [1–6] is one of the most studied frameworks to extend the Standard Model (SM) beyond the electroweak scale; a general review can be found in Ref. [7]. In its minimal realisation (MSSM) [8,9] it predicts a new bosonic (fermionic) partner for each fundamental SM fermion (boson), as well as an additional Higgs doublet. IfR-parity is conserved [10] the lightest supersymmetric particle (LSP) is stable and is typically the lightest neutralino1 χ˜01. Only such scenarios are considered in this note.
In many models, the LSP can be a viable dark matter candidate [11,12] and produce collider signatures with large missing transverse momentum.
In order to address the SM hierarchy problem with SUSY models [13–16], TeV-scale masses are re- quired [17,18] for the partners of the gluons (gluinos ˜g) and of the top quark chiral degrees of freedom (top squarks ˜tLand ˜tR), due to the large top Yukawa coupling. The latter also favours significant ˜tL−t˜R mixing, so that the lighter mass eigenstate ˜t1 is in many scenarios lighter than the other squarks [19, 20]. Bottom squarks may also be light, being bound to top squarks by SU(2)L invariance. This leads to potentially large production cross-sections for gluino pairs ( ˜gg), top-antitop squark pairs (˜˜ t1t˜∗1) and bottom-antibottom squark pairs ( ˜b1b˜1∗) at the Large Hadron Collider (LHC) [21]. Production of isolated leptons may arise in the cascade decays of those superpartners to SM quarks and neutralinos ˜χ01, via intermediate neutralinos ˜χ02,3,4or charginos ˜χ±1,2that in turn lead toW, Z orhbosons, or scalar leptons.
Lighter third generation squarks would also enhance ˜g →t˜t1∗or ˜g →bb˜∗1 branching ratios over the gen- eric decays involving light flavour squarks, favouring the production of heavy flavour quarks and, in the case of top quarks, additional leptons.
This note presents a search for SUSY in final states with two leptons (electrons or muons) of the same electric charge (referred to as same-sign (SS) leptons) or three leptons (3L), jets and missing transverse momentum (~pmissT , whose magnitude is referred to as ETmiss). It is an extension to √
s = 13 TeV of an earlier search performed by ATLAS with√
s = 8 TeV data [22], and uses the data collected by the ATLAS experiment [23] in proton-proton (pp) collisions during 2015. Despite the much lower luminosity collected at√
s = 13 TeV compared to that collected at√
s =8 TeV, thanks to the predicted much larger production cross-sections of SUSY particles, we would expect to have a similar or improved sensitivity at 13 TeV compared to that at the lower energy. A similar search for SUSY in this topology was also performed by the CMS Collaboration [24] at √
s = 8 TeV. While the same-sign leptons signature is present in many scenarios of physics beyond the SM (BSM), SM processes leading to such final states have very small cross-sections. Compared to many other BSM searches, analyses based on same-sign leptons therefore allow the use of looser kinematic requirements (for example, onETmissor the momentum of jets and leptons), preserving sensitivity to scenarios with small mass gaps between gluinos/squarks and the LSP, or in whichR-parity is not conserved [22].
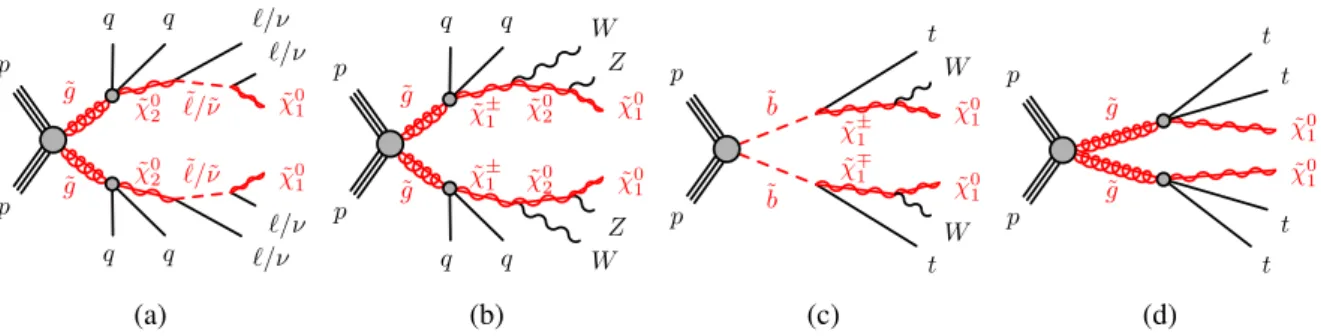
The sensitivity to a wide range of models is illustrated by the interpretation of the results in the context of four different SUSY benchmark processes that may lead to same-sign or three leptons. The first two scenarios focus on gluino pair production with generic decays into light quarks and multiple leptons, either involving light sleptons, ˜g → qq¯χ˜02 → qq`¯ `˜∗ → qq`¯ +`−χ˜01 (Fig.1a), or mediated by a cascade involving ˜χ±1 and ˜χ02, ˜g → qq¯0χ˜1± →qq¯0W±χ˜02 → qq¯0W±Zχ˜01(Fig. 1b). The other two scenarios are motivated by the expectation that the third generation squarks are lighter than the others and target the
1The SUSY partners of the Higgs and electroweak gauge bosons mix to form the mass eigenstates known as charginos ( ˜χl±, l=1,2 ordered by increasing mass) and neutralinos ( ˜χ0m,m=1, . . . ,4 ordered by increasing mass).
˜ g
˜ g
˜ χ02 `/˜˜ν
˜ χ02 `/˜˜ν p
p
q q `/ν
`/ν
˜ χ01
q
q `/ν
`/ν
˜ χ01
(a)
˜ g
˜ g
˜ χ±1 χ˜02
˜ χ±1 χ˜02 p
p
q q W
Z
˜ χ01
q
q W
Z
˜ χ01
(b)
˜b
˜b
˜ χ±1
˜ χ∓1 p
p
t
˜ χ01 W
t
˜ χ01 W
(c)
˜ g
˜ g p p
˜ χ01 t
t
˜ χ01
t t
(d)
Figure 1: SUSY processes featuring gluino (a-b, d) or bottom squark (c) pair production considered in this analysis.
direct production of ˜b1b˜∗1 pairs with subsequent chargino-mediated ˜b1 →tW−χ˜01decays (Fig.1c) or the production of ˜gg˜pairs decaying as ˜g→tt¯χ˜01via an off-shell top squark (Fig.1d).
Four signal regions (SRs) are designed to achieve good sensitivity for these SUSY scenarios, mainly characterised by the number ofb-tagged jets or reconstructed leptons. They are detailed in Section4, pre- ceded by descriptions of the experimental apparatus (Section2) and the simulated samples (Section3).
Section5is devoted to the estimation of the contribution from SM processes to the signal regions, valid- ated by comparisons with data in dedicated regions. The results are presented in Section6, together with the statistical tests used to interpret the results in the context of the SUSY benchmark scenarios. Finally, Section7summarises the main conclusions of this note.
2 The ATLAS detector
The ATLAS experiment [23] is a multi-purpose particle detector with a forward-backward symmetric cylindrical geometry and nearly 4πcoverage in solid angle.2 The interaction point is surrounded by an inner detector (ID), a calorimeter system, and a muon spectrometer.
The ID provides precision tracking of charged particles for pseudorapidities|η| < 2.5 and is surrounded by a superconducting solenoid providing a 2 T axial magnetic field. It consists of pixel and silicon- microstrip detectors inside a transition radiation tracker. One significant upgrade for the new 13 TeV running period is the presence of the Insertable B-Layer [25], an additional pixel layer close to the inter- action point, that provides high-resolution hits at small radius to improve the tracking performance.
In the pseudorapidity region |η| < 3.2, high-granularity lead/liquid-argon (LAr) electromagnetic (EM) sampling calorimeters are used. A steel/scintillator tile calorimeter measures hadron energies for|η| <
1.7. The endcap and forward regions, spanning 1.5< |η| <4.9, are instrumented with LAr calorimeters for both EM and hadronic measurements.
The muon spectrometer consists of three large superconducting toroids with eight coils each, a system of trigger chambers and precision tracking chambers, which provide triggering and tracking capabilities in the ranges|η| <2.4 and|η| <2.7, respectively.
2ATLAS uses a right-handed coordinate system with its origin at the nominal interaction point (IP) in the centre of the detector and thez-axis along the beam pipe. Thex-axis points from the IP to the centre of the LHC ring, and they-axis points upward.
Cylindrical coordinates (r,φ) are used in the transverse plane,φbeing the azimuthal angle around the beam pipe. The pseu- dorapidity is defined in terms of the polar angleθasη=−ln tan(θ/2). Rapidity is defined asy=0.5 ln
(E+pz)/(E−pz) whereEdenotes the energy andpzis the component of the momentum along the beam direction.
A two-level trigger system is used to select events. The first-level trigger is implemented in hardware and uses a subset of the detector information. This is followed by the software-based High-Level Trigger system, which can run offline reconstruction and calibration software, reducing the event rate to about 1 kHz.
3 Dataset and simulated event samples
The data were collected by the ATLAS detector during 2015 with a peak instantaneous luminosity of L = 5.2 × 1033 cm−2s−1, a bunch spacing of 25 ns, and a mean number of additional ppinteractions per bunch crossing (pileup) in the dataset ofhµi = 14. After the application of beam, detector and data quality requirements, the integrated luminosity considered in this analysis corresponds to 3.2 fb−1with an uncertainty of±5%. The luminosity and its uncertainty are derived following a methodology similar to that detailed in Ref. [26] from a preliminary calibration of the luminosity scale using a pair ofx-ybeam separation scans performed in June 2015.
Monte Carlo (MC) simulated event samples are used to aid in the estimation of the SM background and to model the SUSY signal. The MC samples are processed through an ATLAS detector simulation [27]
based on Geant4 [28] or a fast simulation using a parametrisation of the calorimeter response to incident particles and Geant4 for the other parts of the detector [29] and are reconstructed in the same manner as the data.
Diboson processes with four charged leptons, three charged leptons and one neutrino, or two charged leptons and two neutrinos are simulated using the Sherpa v2.1.1 generator [30]. The matrix elements contain the doubly-resonantW W, W Z and Z Z processes and all other diagrams with four or six elec- troweak vertices (such asW±W±j j), including resonant Higgs contributions. Fully leptonic triboson processes (W W W, W W Z, W Z Z and Z Z Z) with up to six charged leptons are also simulated using Sherpav2.1.1. The 4` and 2`+2ν processes are calculated at next-to-leading order (NLO) for up to one additional parton; final states with two and three additional partons are calculated at leading order (LO). TheW W Z → 4`+2νor 2`+4ν processes are calculated at LO with up to two additional par- tons. The 3`+1νare calculated at NLO and up to three extra partons at LO using the Comix [31] and OpenLoops [32] matrix element generators and merged with the Sherpaparton shower [33] using the ME+PS@NLO prescription [34]. TheW W Z/W Z Z → 3`+3ν, Z Z Z → 6`+0ν, 4`+2νor 2`+4ν processes are calculated with the same configuration but with up to only two extra partons at LO. The CT10 [35] parton distribution function (PDF) set is used for all Sherpasamples in conjunction with a dedicated parton shower tuning developed by the Sherpaauthors. The generator cross-sections (at NLO for most of the processes) are used when normalising these backgrounds.
Samples oft¯tV (withV = W and Z, including non-resonant Z/γ∗ contributions) andt¯tW W production are generated at LO with MadGraph5 v2.2.2 [36] interfaced to the Pythia 8.186 [37] parton shower model, with up to two (t¯tW), one (t¯t Z) or no (t¯tW W) extra partons included in the matrix element.
MadGraph5 is also used to simulate thet Z, t¯tt¯t andt¯tt processes. The A14 tune [38] is used together with the NNPDF23LO PDF set [39]. Thet¯tW,t¯t Z,t¯tW W andttt¯¯t events are normalised to their NLO cross-section [40] while the generator cross-section is used fort Zandt¯tt.
Production of a Higgs boson in association with at¯t pair is simulated usingaMC@NLO [40] (in Mad- Graph5 v2.2.2) interfaced to Herwig++2.7.1 [41]. The UEEE5 underlying event tune is used together
with the CTEQ6L1 [42] (matrix element) and CT10 [35] (parton shower) PDF sets. Events are normalised with cross-sections calculated at NLO [43].
The signal SUSY processes are generated from LO matrix elements with up to two extra partons, using the MadGraph5 v2.2.3 generator interfaced to Pythia 8.186 with the A14 tune for the modelling of the SUSY decay chain, parton showering, hadronisation and the description of the underlying event.
Parton luminosities are provided by the NNPDF23LO [44] PDF set. Jet-parton matching is realised following the CKKW-L prescription [45], with a matching scale set to one quarter of the pair-produced superpartner mass. Signal cross-sections are calculated to NLO in the strong coupling constant, adding the resummation of soft gluon emission at next-to-leading-logarithmic accuracy (NLO+NLL) [46–50].
The nominal cross-section and the uncertainty are taken from an envelope of cross-section predictions using different PDF sets and factorisation and renormalisation scales, as described in Ref. [51]. The production cross-section of gluino pairs with a mass of 1.2 TeV is 86 fb at√
s =13 TeV (compared with 4.4 fb at√
s = 8 TeV), while the production cross-section of pairs of bottom squarks with 500 GeV is 520 fb at√
s=13 TeV (compared with 86 fb at√
s =8 TeV).
In all MC samples, except those produced by Sherpa, the EvtGenv1.2.0 program [52] is used to model the properties of the bottom and charm hadron decays. To simulate the effects of additionalppcollisions in the same and nearby bunch crossings, additional interactions are generated using the soft QCD processes of Pythia 8.186 with the A2 tune [53] and the MSTW2008LO PDF [54]. The Monte Carlo samples are reweighted so that the distribution of the number of reconstructed vertices matches the observed distribution in the data.
4 Event selection
Candidate events are required to have a primary vertex, defined as the vertex with the highest sum of squared transverse momentum of the tracks, with at least two associated tracks. In order to perform background estimations using data, two categories of electrons and muons are defined: “candidate” and
“signal” (the latter being a subset of the “candidate” leptons selected with tighter selection criteria).
Electron candidates are reconstructed from an isolated electromagnetic calorimeter energy deposit matched to an ID track and are required to have pT > 10 GeV, |η| < 2.47, and to pass a loose likelihood-based identification requirement [55,56]. The likelihood input variables include measurements of calorimeter shower shapes and measurements of track properties from the ID. Candidates within the transition region between the barrel and endcap electromagnetic calorimeters, 1.37< |η| < 1.52, are removed. The track associated with the electron must have a significance of the transverse impact parameter with respect to the reconstructed primary vertex,d0, of|d0|/σ(d0) <5.
Muon candidates are reconstructed in the region |η| < 2.5 from muon spectrometer tracks matching ID tracks. All muons must have pT > 10 GeV and must pass the medium identification requirements defined in Ref. [57], based on selections on the number of hits in the different inner detector and muon spectrometer subsystems, and the significance of the charge to momentum ratioq/p[57].
Jets are reconstructed with the anti-ktalgorithm [58] with radius parameterR=0.4 using three-dimensional energy clusters in the calorimeter [59] as input objects. All jets must havepT > 20 GeV and|η| <2.8. Jets are calibrated as described in Ref. [60]. In order to reduce the effects of pileup, for jets withpT < 50 GeV
and|η| < 2.4 a significant fraction of the tracks associated with each jet must have an origin compat- ible with the primary vertex, as defined by the jet vertex tagger [61], and the expected average energy contribution from pileup clusters is subtracted according to the jet area [60].
Identification of jets containing b-quarks (b-tagging) is performed with the MV2c20 algorithm, a mul- tivariate discriminant making use of track impact parameters and reconstructed secondary vertices [62–
64]. A requirement is chosen corresponding to a 70% average efficiency obtained forb-jets in simulated tt¯events. The rejection factors for light-quark jets, c-quark jets and τ leptons in simulated t¯t events are approximately 440, 8 and 26, respectively [64]. Jets with|η| < 2.5 which satisfy thisb-tagging re- quirement are identified asb-jets. To compensate for differences between data and MC simulation in the b-tagging efficiencies and mis-tag rates, correction factors derived from data-driven methods are applied to the simulated samples [64].
After object identification, overlaps are resolved. Any jet within a distance∆R = p
∆y2+∆φ2 =0.2 of an electron candidate is discarded, unless the jet MV2c20 weight is larger than the value corresponding to approximately an 80%b-tagging efficiency, in which case the electron is discarded since it is likely coming from a semileptonicb-hadron decay. Any remaining electron within∆R=0.4 of a jet is discarded.
Muons within∆R =0.4 of a jet are also removed. However, if the jet has fewer than three associated tracks, the muon is kept and the jet is discarded instead to avoid inefficiencies for high-energy muons undergoing significant energy loss in the calorimeter.
Signal electrons must satisfy a tight likelihood-based identification requirement [55,56] and have|η| <2 to reduce the impact of electron charge mis-identification. Signal muons must fulfil the requirement of
|d0|/σ(d0) <3. The track associated to the signal leptons must have a longitudinal impact parameter with respect to the reconstructed primary vertex,z0, satisfying|z0sinθ| <0.5 mm. Isolation requirements are applied to both signal electrons and muons. The scalar sum of the pT of tracks within a variable-sized cone around the lepton, excluding its own track, must be less than 6% of the leptonpT. The track isolation cone radius for electrons (muons) is given by the smaller of∆R=10 GeV/pTand∆R=0.2 (0.3), that is, a cone of size 0.2 (0.3) at lowpTbut narrower for high-pTleptons. In addition, in the case of electrons the energy of calorimeter energy clusters in a cone of∆R=0.2 around the electron (excluding the deposition from the electron itself) must be less than 6% of the electronpT. Simulated events are corrected to account for minor differences in the lepton trigger, reconstruction and identification efficiencies between data and MC simulation.
The missing transverse momentum~pTmissis defined as the negative vector sum of the transverse momenta of all identified physics objects (electrons, photons, muons, jets) and an additional soft term. The soft term is constructed from all tracks that are not associated with any physics object, and that are associated with the primary vertex. In this way, theETmissis adjusted for the best calibration of the jets and the other identified physics objects above, while maintaining pileup independence in the soft term [65,66].
Events are selected using a combination (logical OR) of dilepton andETmisstriggers, the latter being used only for events with ETmiss > 250 GeV. The trigger-level requirements on ETmiss and the leading and subleading leptonpT are looser than those applied offline to ensure that trigger efficiencies are constant in the relevant phase space. Events of interest are selected if they contain at least two signal leptons with pT >20 GeV. If the event contains exactly two signal leptons, they are required to have the same electric charge.
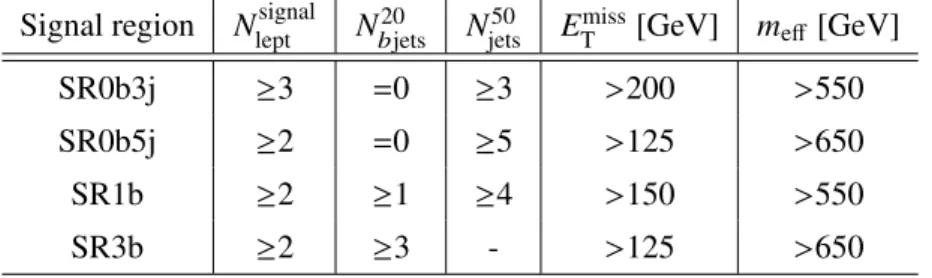
To maximise the sensitivity to different signal models, four overlapping signal regions are defined as shown in Table1, with requirements on the number of signal leptons (Nleptsignal), the number ofb-jets with
pT > 20 GeV (Nbjets20 ), the number of jets withpT > 50 GeV regardless of their flavour (Njets50),ETmissand the effective mass (meff), defined as the scalar sum of the pTof the signal leptons and jets (regardless of their flavour) in the event plus theETmiss.
Table 1: Summary of the event selection criteria for the signal regions (see text for details).
Signal region Nleptsignal Nbjets20 Njets50 ETmiss[GeV] meff[GeV]
SR0b3j ≥3 =0 ≥3 >200 >550
SR0b5j ≥2 =0 ≥5 >125 >650
SR1b ≥2 ≥1 ≥4 >150 >550
SR3b ≥2 ≥3 - >125 >650
Each signal region is motivated by a different SUSY scenario. The SR0b3j and SR0b5j signal regions are sensitive to gluino-mediated and directly produced squarks of the first and second generations leading to final states particularly rich in leptons (Fig.1a) or in jets (Fig.1b), but with no enhancement of the production ofb-quarks. Third-generation squark models resulting in signatures with twob-quarks, such as direct bottom squark production (Fig.1c), are targeted by the SR1b signal region. Finally, the signal region SR3b targets gluino-mediated top squark production resulting in signatures with fourb-quarks (Fig.1d).
The values of acceptance times efficiency of the SR selections for the signal models in Fig.1typically range between 0.6% and 1.3% for the benchmark points shown on Fig.3.
5 Background estimation
Three main sources of SM background can be distinguished in this analysis. A first category is constituted by events with two same-sign prompt leptons or more, mainly fromttW,¯ t¯t Z,t¯t h,t Z, diboson and tribo- son processes. Other types of background events include those containing electrons with mis-measured charge, mainly from the production of top-quark pairs decaying fully leptonically, and those containing at least one non-prompt or fake lepton, which mainly originate from the production of top-quark pairs decaying semi-leptonically, orW bosons in association with jets.
5.1 Background estimation methods
The estimation of the SM background processes with same-sign prompt leptons (or more) is performed using the MC samples described in Section3. Since diboson andt¯tV events are the main backgrounds in the signal regions, dedicated validation regions with an enhanced contribution from these processes are defined to verify the background predictions (see Section5.3).
Background events due to charge mis-identification, dominated by electrons having emitted a hard brems- strahlung photon which subsequently converted to an electron-positron pair, are commonly referred to as
“charge-flip”. The probability of mis-identifying the charge of a muon is checked in both data and MC, and found to be negligible in the kinematic range relevant to this analysis. The contribution of charge-flip events is estimated using data. The electron charge-flip probability is extracted in a Z/γ∗ → ee data
sample using a likelihood fit which takes as input the numbers of same-sign and opposite-sign electron pairs observed in the sample. The charge-flip probability is a free parameter of the fit and is extracted as a function of the electronpT andη. The event yield of this background in the signal or validation regions is obtained by applying the measured charge-flip probability to data regions with the same kinematic requirements as the signal or validation regions but with opposite-sign lepton pairs.
The contribution from fake or non-prompt (FNP) leptons (such as hadrons misidentified as leptons, leptons originating from heavy-flavour decays, and electrons from photon conversions), is also estim- ated from data with a matrix method similar to that described in Ref. [22]. In this method, two types of lepton identification criteria are defined: “tight”, corresponding to the signal lepton criteria described in Section4, and “loose”, corresponding to candidate leptons not passing the tight selection criteria. The matrix method relates the number of events containing prompt or FNP leptons to the number of observed events with tight or loose leptons using the probability for loose prompt or FNP leptons to pass the tight criteria. The probability for loose prompt leptons to pass the tight selection criteria is obtained using a Z/γ∗ →``data sample and is modelled as a function of the lepton pT andη. The probability for loose FNP leptons to pass the tight selection criteria is determined from data in a SS control region enriched in non-prompt leptons originating from heavy-flavour decays. This region contains events with at least oneb-jet, one tight muon with pT > 40 GeV (likely prompt) and an additional loose electron or muon (likely FNP). The contribution from prompt leptons and charge mis-measured electrons to this region is subtracted from the observed event yields.
The data-driven background estimates are cross-checked with an MC-based technique. In this method, the contributions from processes with FNP leptons and electron charge mis-identification are obtained from MC and normalised to data in dedicated control regions at low jet multiplicity, low ETmiss, and either with or withoutb-jets. The normalisation is performed using five multipliers: one to correct the electron charge mis-identification rate, and four to correct the contributions from FNP electrons or muons originating fromb-jets or light-flavour jets, respectively. In addition to the MC samples listed in Section3, this method employs samples of top quark pair production generated with the Powheg-Box v2 generator interfaced to Pythia6.428 [67], as well as samples of simulatedW+jets andZ+jets events generated with Powheg-Box v2 interfaced to Pythia8.186.
5.2 Systematic uncertainties on the background estimation
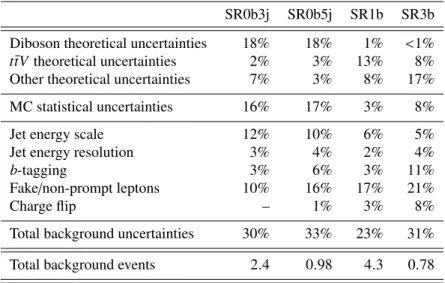
Table2 summarises the value of the different sources of systematic uncertainty on the total SM back- ground predictions in the signal regions.
The systematic uncertainties related to the same-sign prompt leptons background estimation arise from the accuracy of the theoretical and experimental modelling in the MC simulation. The primary sources of systematic uncertainties are related to the jet energy scale calibration, the jet energy resolution,b-tagging efficiency, and MC modelling and theoretical cross-section uncertainties. The cross-sections used to nor- malise the MC samples are varied according to the uncertainty on the cross-section calculation, that is, 6% for diboson, 13% forttW¯ and 12%t¯t Zproduction [40]. Additional uncertainties are assigned to these backgrounds to account for MC modelling of the kinematic distributions. ForttW¯ andt¯t Z, the predictions from MadGraph5 and Sherpagenerators are compared leading to a∼30% uncertainty for these processes after the SR selections. For dibosons, uncertainties are estimated by varying the renormalisation, factor- isation and resummation scales used to generate these samples, leading to a∼30% uncertainty for these
processes after the SR selections. For tribosons,tt h,¯ ttt¯¯tandt Zproduction processes, which constitute a small background in all signal regions, a 50% uncertainty on the event yields is assumed.
Systematic uncertainties on the FNP lepton background estimate are assigned to account for potentially different FNP compositions (heavy flavour, light flavour or conversions) between the signal and control regions, as well as the contamination from prompt leptons in the regions used to measure the probabilities for loose FNP leptons to pass the tight signal criteria. These systematic uncertainties on the probabilities are 50-60%, leading to uncertainties on the total background estimates in SR1b, SR3b of 12, 14% and of less than 6% in the signal regions withoutb-jets.
For the charge-flip background prediction, the main uncertainties originate from the statistical uncertainty of the charge-flip probability measurements and the background contamination of the sample used to extract the charge-flip probability.
Table 2: The main sources of systematic uncertainty on the SM background estimates for the four signal regions are shown and their value given as relative uncertainties on the signal region event yields. The individual components can be correlated and therefore do not necessarily add up in quadrature to the total systematic uncertainty. For reference, the total number of background events is also shown.
SR0b3j SR0b5j SR1b SR3b Diboson theoretical uncertainties 18% 18% 1% <1%
ttV¯ theoretical uncertainties 2% 3% 13% 8%
Other theoretical uncertainties 7% 3% 8% 17%
MC statistical uncertainties 16% 17% 3% 8%
Jet energy scale 12% 10% 6% 5%
Jet energy resolution 3% 4% 2% 4%
b-tagging 3% 6% 3% 11%
Fake/non-prompt leptons 10% 16% 17% 21%
Charge flip – 1% 3% 8%
Total background uncertainties 30% 33% 23% 31%
Total background events 2.4 0.98 4.3 0.78
5.3 Validation of background estimates
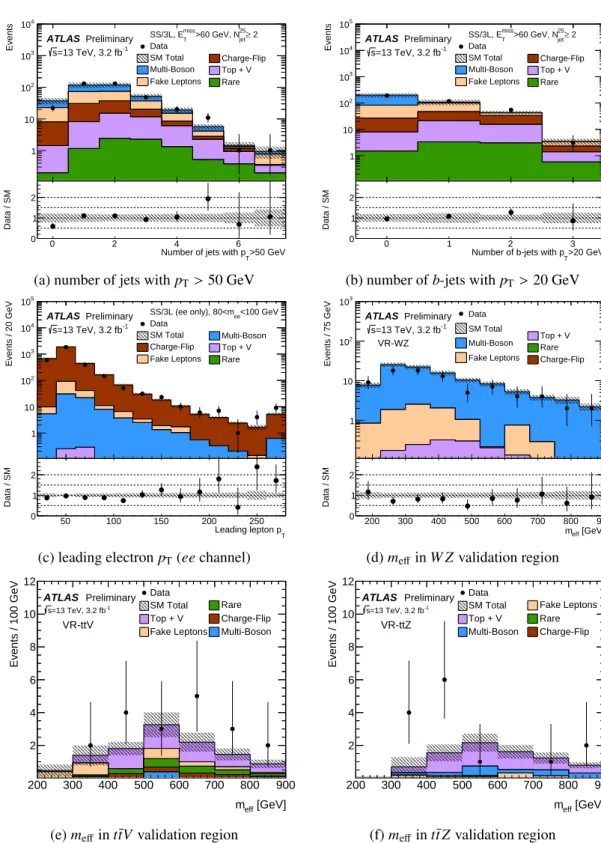
To check the validity and robustness of the background estimates, the distributions of several discrim- inating variables in data are compared with the predicted background after various requirements on the number of jets andb-jets. Events are categorised based on the flavours of the selected leptons, and the dif- ferent flavour channels are compared separately. Examples of such distributions are shown in Fig.2a-2c and illustrate the fair agreement between predictions and data. The background estimates in a kinematic region close to the signal regions can also be observed in Fig.3, which shows theETmissdistributions in the signal regions before applying theETmissrequirements.
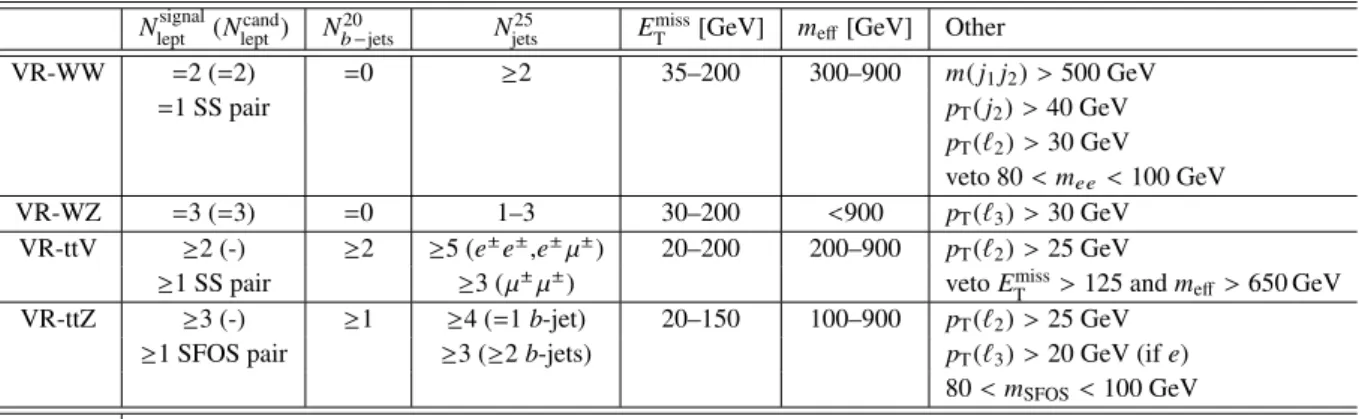
Dedicated validation regions (VRs) are defined to test the estimate of the rare SM processes contributing to the signal regions, whose cross-sections have not yet been measured at√
s=13 TeV. The corresponding
Table 3: Summary of the event selection in the validation regions. Requirements are placed on the number of signal leptons (Nleptsignal) and candidate leptons (Nleptcand), the number of jets withpT>25 GeV (Njets25) or the number ofb-jets withpT >20 GeV (N20
b−jets). The three leadingpTleptons are referred to as`1,2,3 with decreasingpTand the two leading jets as j1,2. Additional requirements are set on the invariant mass of the two leading electronsmee, the presence of SS leptons or a pair of same-flavour opposite-sign leptons (SFOS) and its invariant massmSFOS.
Nleptsignal(Nleptcand) Nb−jets20 Njets25 ETmiss[GeV] meff[GeV] Other
VR-WW =2 (=2) =0 ≥2 35–200 300–900 m(j1j2)>500 GeV
=1 SS pair pT(j2)>40 GeV
pT(`2)>30 GeV veto 80<mee <100 GeV
VR-WZ =3 (=3) =0 1–3 30–200 <900 pT(`3)>30 GeV
VR-ttV ≥2 (-) ≥2 ≥5 (e±e±,e±µ±) 20–200 200–900 pT(`2)>25 GeV
≥1 SS pair ≥3 (µ±µ±) vetoETmiss>125 andmeff>650 GeV VR-ttZ ≥3 (-) ≥1 ≥4 (=1b-jet) 20–150 100–900 pT(`2)>25 GeV
≥1 SFOS pair ≥3 (≥2b-jets) pT(`3)>20 GeV (ife) 80<mSFOS<100 GeV All VRs Veto events belonging to any SR, or if`1or`2is an electron with|η|>1.37 (except in VR-WZ)
selections are summarised in Table3. In these regions, upper bounds are placed on ETmiss andmeff to reduce signal contamination, and the small residual overlap with the signal regions is resolved by vetoing events that contribute to the signal regions. To further reduce contributions from electron charge mis- identification, events are also vetoed if one of the two leading leptons is an electron with |η| > 1.37, since contributions from charge-flip electrons are smaller in the central region due to the lower amount of crossed material. The purity of the targeted processes in these regions ranges from about 40 to 80%.
Note that the VR-ttV and VR-ttZ regions overlap with each other, with 30% of thettV¯ events in VR-ttV also present in VR-ttZ, and similar contributions fromt¯t Zandt¯tW to VR-ttV.
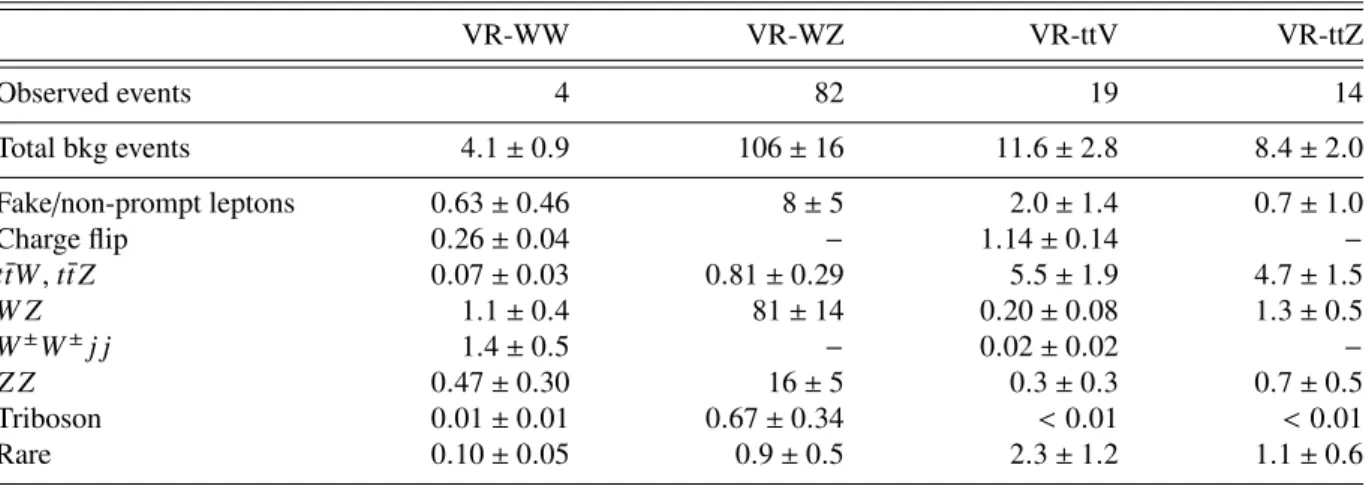
The observed yields in these validation regions, compared with the background predictions and uncer- tainties, can be seen in Table4, and the effective mass distributions are shown in Fig.2d-2f. There is a fair agreement between data and the estimated background for the validation regions, with the largest deviation being observed in VR-ttV with a 1.3σdisagreement.
6 Results
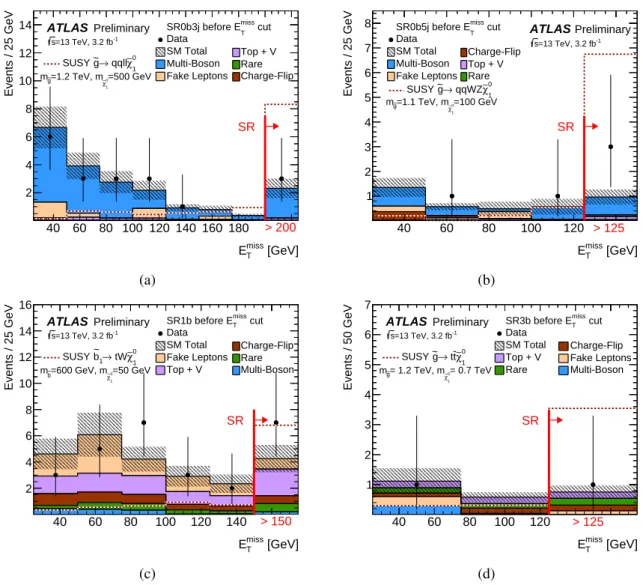
Figure3 shows the data ETmiss distributions after the signal region selections (beside that on ETmiss) in data together with the expected contributions from all the SM backgrounds with their total statistical and systematic uncertainties. For illustration, a typical SUSY signal distribution corresponding to the most relevant benchmark scenario is displayed. The detailed yields for data and the different sources of SM background in the signal regions are presented in Table5. The uncertainties amount to 25-35% of the total background depending on the signal regions. No significant excess is observed in any of the four signal regions, the smallestp-value for the SM-only hypothesis being 0.06 for SR0b5j. Out of the 14 events in the SRs, 2 of the events in SR1b and the 3 events in SR0b3j contain three leptons. None of those events contain three leptons with the same electric charge.
>50 GeV T Number of jets with p
0 2 4 6
Events
1 10 102
103
104
Charge-Flip Top + V Rare
≥ 2
25
>60 GeV, Njet miss
SS/3L, ET
Data SM Total Multi-Boson Fake Leptons ATLAS Preliminary
=13 TeV, 3.2 fb-1
s
>50 GeV Number of jets with pT
0 2 4 6
Data / SM
0 1 2
(a) number of jets withpT>50 GeV
>20 GeV T Number of b-jets with p
0 1 2 3
Events
1 10 102
103
104
105
Charge-Flip Top + V Rare
≥ 2
25
>60 GeV, Njet miss
SS/3L, ET
Data SM Total Multi-Boson Fake Leptons ATLAS Preliminary
=13 TeV, 3.2 fb-1
s
>20 GeV Number of b-jets with pT
0 1 2 3
Data / SM
0 1 2
(b) number ofb-jets withpT>20 GeV
Leading lepton pT
50 100 150 200 250
Events / 20 GeV
1 10 102
103
104
105
Multi-Boson Top + V Rare
<100 GeV SS/3L (ee only), 80<mee
Data SM Total Charge-Flip Fake Leptons ATLAS Preliminary
=13 TeV, 3.2 fb-1
s
Leading lepton pT
50 100 150 200 250
Data / SM
0 1 2
(c) leading electronpT(eechannel)
[GeV]
meff
200 300 400 500 600 700 800 900
Events / 75 GeV
1 10 102
103
Top + V Rare Charge-Flip Data
SM Total Multi-Boson Fake Leptons ATLAS Preliminary
=13 TeV, 3.2 fb-1
s VR-WZ
[GeV]
meff
200 300 400 500 600 700 800 900
Data / SM
0 1 2
(d)meffinW Zvalidation region
[GeV]
meff
200 300 400 500 600 700 800 900
Events / 100 GeV
2 4 6 8 10 12
Rare Charge-Flip Multi-Boson Data
SM Total Top + V Fake Leptons ATLAS Preliminary
=13 TeV, 3.2 fb-1 s
VR-ttV
(e)meffinttV¯ validation region
[GeV]
meff
200 300 400 500 600 700 800 900
Events / 100 GeV
2 4 6 8 10 12
Fake Leptons Rare Charge-Flip Data
SM Total Top + V Multi-Boson ATLAS Preliminary
=13 TeV, 3.2 fb-1 s
VR-ttZ
(f)meffintt Z¯ validation region
Figure 2: Distributions of kinematic variables after a SS/3L selection includingEmissT >60 GeV andNjet25 ≥2 (a-b), with ab-jet veto and 80 < m`` < 100 GeV (c), and distributions in the validation regions (d-f). The statistical uncertainties on the background prediction are included in the uncertainty band, as well as the theory uncertainties for the backgrounds with prompt SS/3L, and the full systematic uncertainties for data-driven backgrounds. The last bin includes overflows. The “Rare” category contains the contributions fromt¯tt¯t,t¯tt andtt h¯ production, the
“Multi-Boson” category contains the contributions fromW Z,Z Z,W±W±j jand triboson production, and the “Fake leptons” category corresponds to FNP leptons (see text). The lower part of the figures (a-d) shows the ratio of data
Table 4: The numbers of observed data and expected background events for the validation regions. The “Rare”
category contains the contributions fromttt¯t,¯ ttt,¯ tt h¯ andttW W¯ production. Background categories shown as “−”
denote that they cannot contribute to a given region (charge flips orW±W±j jin 3-lepton regions).
VR-WW VR-WZ VR-ttV VR-ttZ
Observed events 4 82 19 14
Total bkg events 4.1±0.9 106±16 11.6±2.8 8.4±2.0
Fake/non-prompt leptons 0.63±0.46 8±5 2.0±1.4 0.7±1.0
Charge flip 0.26±0.04 − 1.14±0.14 −
ttW¯ ,tt Z¯ 0.07±0.03 0.81±0.29 5.5±1.9 4.7±1.5
W Z 1.1±0.4 81±14 0.20±0.08 1.3±0.5
W±W±j j 1.4±0.5 − 0.02±0.02 −
Z Z 0.47±0.30 16±5 0.3±0.3 0.7±0.5
Triboson 0.01±0.01 0.67±0.34 <0.01 <0.01
Rare 0.10±0.05 0.9±0.5 2.3±1.2 1.1±0.6
Table 5: The number of observed data events and expected background contributions in the signal regions. The p-value of the observed events for the background-only hypothesis is denoted byp(s =0). The “Rare” category contains the contributions fromttt¯¯t,ttt¯ andt¯tW W production. Background categories shown as “−” denote that they cannot contribute to a given region (charge flips orW±W±j jin 3-lepton regions). The individual uncertainties can be correlated and therefore do not necessarily add up in quadrature to the total systematic uncertainty.
SR0b3j SR0b5j SR1b SR3b
Observed events 3 3 7 1
Total bkg events 2.4±0.7 0.98±0.32 4.3±1.0 0.78±0.24
p(s=0) 0.33 0.06 0.12 0.36
Fake/non-prompt leptons <0.2 0.04+0.17−0.04 0.8±0.8 0.12±0.16
Charge flip − 0.02±0.01 0.60±0.12 0.19±0.06
ttW¯ ,tt Z¯ 0.13±0.06 0.11±0.06 2.0±0.7 0.21±0.09
W Z 1.5±0.5 0.61±0.25 0.17±0.09 <0.02
W±W±j j − 0.11±0.05 0.03±0.01 <0.01
Z Z 0.6±0.4 <0.14 <0.03 <0.03
Triboson 0.09±0.05 0.02±0.01 0.02±0.01 <0.01
Rare 0.05±0.04 0.05±0.04 0.7±0.4 0.26±0.14
In the absence of any significant deviations from the SM predictions, upper limits on possible BSM contributions to the signal regions are computed, in particular in the context of the SUSY benchmark scenarios described in Section1. The HistFitter framework [68], which utilises a profile likelihood ratio test [69], is used to establish 95% confidence intervals using the CLs prescription [70]. The likelihood is built as the product of a Poisson probability density function describing the observed number of events in the signal region and Gaussian distributions constraining the nuisance parameters associated to the systematic uncertainties whose widths correspond to the sizes of these uncertainties; Poisson distributions
[GeV]
miss
ET
40 60 80 100 120 140 160 180 200 220
Events / 25 GeV
2 4 6 8 10 12 14
=500 GeV
0
χ∼1
=1.2 TeV, m
g~
m
Top + V Rare Charge-Flip
miss cut SR0b3j before ET
Data SM Total Multi-Boson Fake Leptons
0
χ∼1
qqll
→ g~ SUSY
ATLAS Preliminary
=13 TeV, 3.2 fb-1
s
SR
> 200
(a)
[GeV]
miss
ET
40 60 80 100 120 140
Events / 25 GeV
1 2 3 4 5 6 7 8
=100 GeV
0
χ∼1
=1.1 TeV, m
g~
m
Charge-Flip Top + V Rare
miss cut SR0b5j before ET
Data SM Total Multi-Boson Fake Leptons
0
χ∼1
qqWZ
→
~g SUSY
ATLASPreliminary
=13 TeV, 3.2 fb-1
s
SR
> 125
(b)
[GeV]
miss
ET
40 60 80 100 120 140 160
Events / 25 GeV
2 4 6 8 10 12 14 16
=50 GeV
0
χ∼1
=600 GeV, m
b~
m
Charge-Flip Rare Multi-Boson
miss cut SR1b before ET
Data SM Total Fake Leptons Top + V
0
χ∼1
→ tW b1
SUSY ~
ATLAS Preliminary
=13 TeV, 3.2 fb-1
s
SR
> 150
(c)
[GeV]
miss
ET
40 60 80 100 120 140 160
Events / 50 GeV
1 2 3 4 5 6 7
= 0.7 TeV
0
χ∼1
= 1.2 TeV, m
g~
m
Charge-Flip Fake Leptons Multi-Boson
miss cut SR3b before ET
Data SM Total Top + V Rare
0
χ∼1
t
→ t
~g SUSY
ATLAS Preliminary
=13 TeV, 3.2 fb-1
s
SR
> 125
(d)
Figure 3: Missing transverse momentum distributions after SR0b3j (a), SR0b5j (b), SR1b (c) and SR3b (d) selec- tion, beside theETmissrequirement. The results in the signal regions are shown in the last (inclusive) bin of each plot. The statistical uncertainties on the background prediction are included in the uncertainty band, as well as the theory uncertainties for the backgrounds with prompt SS/3L, and the full systematic uncertainties for data-driven backgrounds. The “Rare” category contains the contributions fromttt¯t,¯ ttt¯ andtt h¯ production, the “Multi-Boson”
category contains the contributions fromW Z, Z Z,W±W±j j and triboson production, and the “Fake leptons”
category corresponds to FNP leptons (see text).
are used instead for MC statistical uncertainties. Correlations of a given nuisance parameter across the different sources of backgrounds and the signal are taken into account when relevant. The statistical tests are performed independently for each of the signal regions.
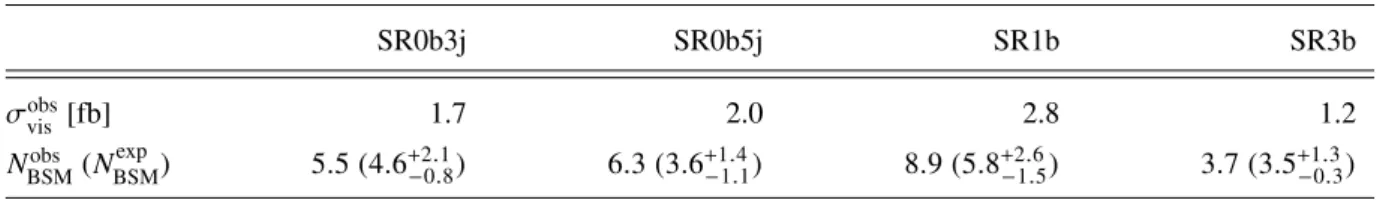
Table 6 presents 95% confidence level (CL) model-independent upper limits on the number of BSM events that may contribute to the signal regions. Normalising these by the integrated luminosity of the data sample they can be interpreted as upper limits on the visible BSM cross-sectionσvis, defined as the productσprod × A× of production cross-section, acceptance and reconstruction efficiency.
Exclusion limits are also set on the masses of the superpartners involved in the four SUSY benchmark
Table 6: Signal model-independent upper limits on the visible signal cross-section (σvis=σprod×A×) and on the number of BSM events (NBSM) in the four SRs. The numbers (in parentheses) give the observed (expected) 95%
CL upper limits. Calculations are performed with pseudo-experiments. The±1σvariations on the expected limit due to the statistical and systematic uncertainties on the background prediction are also shown.
SR0b3j SR0b5j SR1b SR3b
σvisobs[fb] 1.7 2.0 2.8 1.2
NBSMobs (NBSMexp ) 5.5 (4.6+2.1−0.8) 6.3 (3.6+1.4−1.1) 8.9 (5.8+2.6−1.5) 3.7 (3.5+1.3−0.3)
scenarios considered in this analysis. Simplified models corresponding to a single production mode and with 100% branching ratio to a specific decay chain are used, with the masses of the SUSY particles not involved in the process set to very high values. For the scenarios with generic gluino decays into light quarks, only decays to four (five) lightest quarks are considered in the case of ˜g → qq¯0χ˜±1 decays ( ˜g→qq¯χ˜02) and the decays occur with equal probability; for the latter scenario, the subsequent ˜χ02 →``˜ decay produces all six lepton flavours with equal probability.
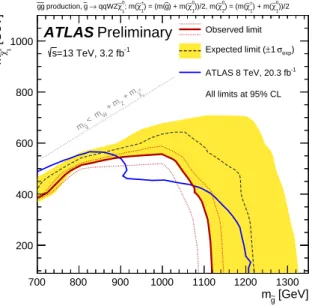
Figure4 shows the limits on the mass of the ˜χ01 as a function of the ˜g or ˜b1 mass. For these results, asymptotic formulas [69] are used to model the probability distribution of the test statistic. The new limits set by this analysis can be compared with the existing limits set by the combination of ATLAS SUSY searches with 8 TeV data [71,72]. For parts of the parameter space, the sensitivity reached with the 13 TeV dataset exceeds that of the 8 TeV dataset, and in all cases additional parameter space regions can be excluded, especially for large neutralino masses.
Signal models featuring gluino pair production and light sleptons in their decay ( ˜g →qq¯χ˜02→qq`¯ `˜∗ → qq`¯ +`−χ˜01) are probed using SR0b3j (Fig.4a), excluding gluino masses up tomg˜ ≈ 1.3 TeV for a light LSP and excluding ˜χ01masses up tomχ˜0
1 ≈775 GeV for gluinos withmg˜ ≈1 TeV. Similarly, models with gluino production with a subsequent two-step gluino decay via ˜χ1± and ˜χ02( ˜g → qq¯χ˜1± → qqW¯ χ˜02 → qqW Z¯ χ˜01) are probed with SR0b5j (Fig.4b) with exclusion limits reachingmg˜ ≈ 1.1 TeV (for light ˜χ01) andmχ˜0
1
≈550 GeV (formg˜ ≈1.0 TeV).
Exclusion limits in a simplified model of bottom squark production with chargino-mediated ˜b1→tW−χ˜01 decays are obtained with SR1b (Fig.4c) and can reach mass values of mb˜1 ≈ 525 GeV for a light ˜χ01, whilemχ˜0
1 . 135 GeV are also excluded formb˜1 ≈450 GeV, significantly extending the previous limits obtained at√
s = 8 TeV [72] which excludedmb˜
1 . 470 GeV for mχ˜0
1 ≈ 60 GeV for a similar model.
Finally, SR3b is used to set limits on the ˜gg˜simplified model with ˜g→tt¯χ˜01decays via an off-shell top squark (Fig.4d). In that case, gluino masses ofmg˜ < 1.2 TeV are excluded formχ˜0
1 < 600 GeV, with mχ˜0
1 .700 GeV also being excluded for small mass differences between the gluino and the neutralino.
[GeV]
g~
m 500 600 700 800 900 1000 1100 1200 1300 1400 1500 [GeV] 1
0χ∼m
200 400 600 800 1000 1200
1 0χ
∼
< m
~g
m
1))/2 χ∼0
) + m(
2
χ∼0
) = (m(
ν∼
,
~l ))/2, m(
1
χ∼0
) + m(
~g ) = (m(
2
χ∼0 1; m(
χ∼0
ν) ν qq(ll/
→
~g production,
~g g~
=13 TeV, 3.2 fb-1
s
ATLAS Preliminary Observed limit
exp) σ
±1 Expected limit (
All limits at 95% CL
(a) ˜g→qq``¯ χ˜01scenario, SR0b3j
[GeV]
g~
m
700 800 900 1000 1100 1200 1300
[GeV] 1 0χ∼m
200 400 600 800 1000
1 χ0
∼ Z + m + m
W
< m
~g
m
1))/2 χ∼0
) + m(
1
χ∼±
) = (m(
2
χ∼0
))/2, m(
1
χ∼0
) + m(
g~ ) = (m(
1
χ∼± 1; m(
χ∼0
qqWZ
→
~g production,
~g
~g
=13 TeV, 3.2 fb-1
s
ATLAS Preliminary Observed limit
exp) σ
±1 Expected limit ( ATLAS 8 TeV, 20.3 fb-1
All limits at 95% CL
(b) ˜g→qq¯0W Zχ˜01scenario, SR0b5j
[GeV]
b1
m~
450 500 550 600 650
[GeV] 1 0χ∼m
100 150 200 250 300
+ 100 GeV
1 0χ∼
+ mt < m
~b
m
) + 100 GeV
1
χ∼0
) = m(
1
χ∼± 1, m(
χ∼±
→ t b1
production, ~ b1
~ b~1
=13 TeV, 3.2 fb-1
s
ATLAS Preliminary Observed limit
exp) σ
±1 Expected limit (
All limits at 95% CL
(c) ˜b1 →tχ˜−1 scenario, SR1b
[GeV]
g~
m 950 1000 1050 1100 1150 1200 1250 1300 1350 1400 [GeV] 1
0χ∼m
100 200 300 400 500 600 700 800 900 1000 1100
) g~ ) >> m(
t1
, m(~
1
χ∼0
t
→ t g~ production,
~g g~
=13 TeV, 3.2 fb-1
s
ATLAS Preliminary
1 χ0
+ m∼ t
< 2m
~g
m
Observed limit
exp) σ
±1 Expected limit ( ATLAS 8 TeV, 20.3 fb-1
All limits at 95% CL
(d) ˜g→tt¯χ˜01scenario, SR3b
Figure 4: Observed and expected exclusion limits on the ˜g, ˜b1and ˜χ01 masses in the context of SUSY scenarios with simplified mass spectra featuring ˜gg˜or ˜b1b˜1∗pair production with exclusive decay modes. The signal region used to obtain the limits is specified for each scenario. The contours of the band around the expected limit are the
±1σresults, including all uncertainties except theoretical uncertainties on the signal cross-section. The dotted lines around the observed limit illustrate the change in the observed limit as the nominal signal cross-section is scaled up and down by the theoretical uncertainty. All limits are computed at 95% CL. The diagonal lines indicate the kinematic limit for the decays in each specified scenario. Results are compared with the observed limits obtained by previous ATLAS searches [71,72].