ATLAS-CONF-2012-104 13August2012
ATLAS NOTE
ATLAS-CONF-2012-104
August 9, 2012
Search for supersymmetry at √
s = 8 TeV in final states with jets, missing transverse momentum and one isolated lepton
The ATLAS Collaboration
Abstract
This note presents a search for supersymmetry by the ATLAS experiment at the LHC in proton-proton collisions at a center-of-mass energy
√s =
8 TeV in a final state with at least four jets, missing transverse momentum and one isolated electron or muon. The search is based on data collected during the first half of 2012, which corresponds to an integrated luminosity of 5.8 fb
−1. No excess above the Standard Model expectation is observed and limits are set on the visible cross section of new physics within the kinematic requirements of the search. The results are also interpreted as limits on the parameters of a minimal supergravity model.
c Copyright 2012 CERN for the benefit of the ATLAS Collaboration.
Reproduction of this article or parts of it is allowed as specified in the CC-BY-3.0 license.
1 Introduction
Supersymmetry (SUSY) has been proposed as a theory that could describe physical phenomena be- yond the Standard Model (SM) [1–9]. If strongly interacting supersymmetric particles are present at the TeV-scale, they should be accessible at the Large Hadron Collider [10]. In the minimal supersym- metric extension of the Standard Model [11–15] such particles decay into jets, leptons and the lightest supersymmetric particle (LSP) which can be weakly interacting and escape detection, leading to missing transverse momentum (
pmissTand its magnitude E
missT) in the final state. Significant E
missTcan also arise in scenarios where the LSP decays to final states containing neutrinos, or in scenarios where neutrinos are created somewhere in the SUSY decay cascade.
This note presents a search with the ATLAS detector for SUSY in a final state containing jets, one isolated lepton (electron or muon) and E
Tmiss. Previous searches in this channel have been conducted by both the CMS [16] and ATLAS [17] collaborations using the full 2011 dataset at a center-of-mass energy of 7 TeV. In this previous ATLAS search, a combination of 3- and 4-jet signal regions was used to analyse the 4.7 fb
−1of integrated luminosity. In this note, the analysis is performed with 2012 data at a center-of-mass energy of 8 TeV with an integrated luminosity of 5.8 fb
−1and uses a signal region with at least four high transverse momentum jets.
2 The ATLAS Detector
The ATLAS detector [18, 19] consists of a tracking system (inner detector, or ID) surrounded by a thin superconducting solenoid providing a 2 T magnetic field, electromagnetic and hadronic calorimeters and a muon spectrometer (MS). The ID consists of pixel and silicon microstrip detectors, surrounded by the transition radiation tracker (TRT). The electromagnetic calorimeter is a lead liquid-argon (LAr) detector.
Hadron calorimetry is based on two different detector technologies, with scintillator-tiles or LAr as active media, and with either steel, copper, or tungsten as the absorber material. The MS is based on three large superconducting toroids arranged with an eight-fold azimuthal coil symmetry around the calorimeters, and a system of three stations of chambers for the trigger and for precise measurements. The nominal pp interaction point at the center of the detector is defined as the origin of a right-handed coordinate system. The positive x-axis is defined by the direction from the interaction point to the center of the LHC ring, with the positive
y-axis pointing upwards, while the beam direction defines thez-axis. The azimuthal angle
φis measured around the beam axis and the polar angle
θis the angle from the z-axis.
The pseudorapidity is defined as
η=−ln tan(θ/2).
3 SUSY Signal Modeling and Simulated Event Samples
Simulated event samples are used for estimating the signal acceptance, the detector efficiency, and to aid in the estimation of SM background contributions. As a benchmark SUSY scenario, the model consid- ered here is the MSUGRA/CMSSM [20,21] with tan
β=10, A
0 =0 and
µ >0. The MSUGRA/CMSSM signal samples are generated with Herwig++ [22]; SUSY-HIT [23] interfaced to SOFTSUSY [24] and SDECAY [25] is used to calculate the sparticle mass spectra and decay tables, and to guarantee consistent electroweak symmetry breaking in the MSUGRA/CMSSM models. Signal cross sections are calculated at next-to-leading order in the strong coupling constant, adding the resummation of soft gluon emission at next-to-leading-logarithmic accuracy (NLO+NLL) [26–30]. The nominal cross section and the uncer- tainty are taken from an envelope of cross section predictions using different PDF sets and factorisation and renormalisation scales, as described in Ref. [31].
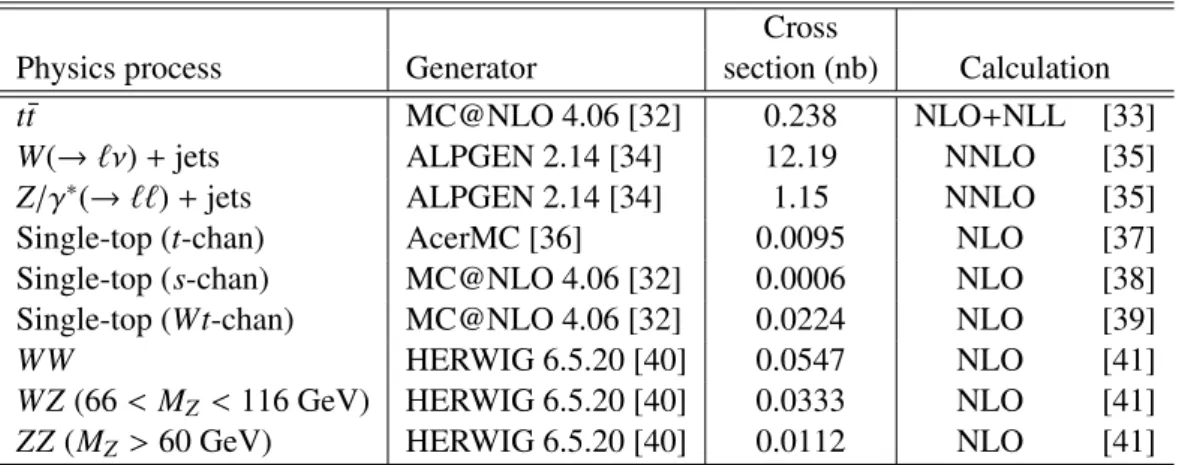
The simulated event samples for the SM backgrounds are summarized in Table 1. The ALPGEN
samples are generated with the MLM matching scheme. Parton shower and fragmentation processes
Cross
Physics process Generator section (nb) Calculation
t¯ t MC@NLO 4.06 [32] 0.238 NLO+NLL [33]
W(
→ℓν)+jets ALPGEN 2.14 [34] 12.19 NNLO [35]
Z/γ
∗(
→ℓℓ)+jets ALPGEN 2.14 [34] 1.15 NNLO [35]
Single-top (t-chan) AcerMC [36] 0.0095 NLO [37]
Single-top (s-chan) MC@NLO 4.06 [32] 0.0006 NLO [38]
Single-top (Wt-chan) MC@NLO 4.06 [32] 0.0224 NLO [39]
WW HERWIG 6.5.20 [40] 0.0547 NLO [41]
WZ (66
<M
Z<116 GeV) HERWIG 6.5.20 [40] 0.0333 NLO [41]
ZZ (M
Z >60 GeV) HERWIG 6.5.20 [40] 0.0112 NLO [41]
Table 1: Simulated background event samples used in this analysis, and the production cross sections.
The ALPGEN samples are generated with 0
≤N
parton ≤5 in the matrix element. The W+jets and Z/γ
∗+jets samples are normalized using the inclusive cross sections multiplied by the relevant branchingratio; the values shown in the table are for a single lepton flavor. The single-top cross sections are also listed for a single lepton flavor. Details of PDF sets and underlying event tunes are given in the text.
are simulated for the ALPGEN and MC@NLO samples using HERWIG [40] with JIMMY [42] for underlying event simulation. The PDFs used in this analysis are: CTEQ6L1 [43] for the ALPGEN and HERWIG samples and CT10 [44] for MC@NLO. The ATLAS AUET2 underlying event tunes are used [45]. The theoretical cross sections for W+jets and Z+jets are calculated with DYNNLO [46] with the MSTW2008NNLO [47] PDF set. For the diboson cross sections, MCFM [41] with the MSTW2008NLO PDFs is used. The t t ¯ cross section is calculated with HATHOR 1.2 [33] using MSTW2008NNLO PDFs.
The detector simulation [48] is performed using GEANT4 [49]. All simulated samples are generated with a range of simulated minimum-bias interactions overlaid on the hard-scattering event to account for the multiple pp interactions in the same bunch crossing (pile-up). The overlay also treats the impact of pile-up on bunch crossings other than the one in which the event occurred. Simulated samples are corrected by taking into account the observed differences between the data and simulation for the lepton trigger and reconstruction efficiencies, and for the efficiency and misidentification rate of the algorithm used to identify jets arising from b-quarks (b-tagging).
4 Object Reconstruction
In this Section, we describe the final-state object reconstruction and selection requirements. The event selection requirements will be described in detail in Section 6.
4.1 Jet selection
Jets are reconstructed from three-dimensional calorimeter energy clusters using the anti-k
talgorithm
[50, 51] with a radius parameter R
=0.4. Jets arising from detector noise, cosmic rays or other non-
collision sources are rejected [52]. To take into account the differences in calorimeter response between
electrons/photons and hadrons, each cluster is classified, prior to the jet reconstruction, as coming from
an electromagnetic or hadronic shower on the basis of its shape [19]. The jet energy is then corrected at
cluster level by weighting electromagnetic and hadronic energy deposits with correction factors derived
from Monte Carlo simulation. A further calibration, relating the response of the calorimeter to true jet
energy [52, 53], is then applied to the jet energy. Signal jets are required to have p
T >25 GeV and
|η|<
2.5.
The primary vertex [54] is required to be consistent with the beamspot envelope and to have at least five tracks; when more than one such vertex is found, the vertex with the largest summed
|p
T|2of the associated tracks is chosen.
Jets arising from b-quarks are identified using information about track impact parameters and recon- structed secondary vertices; the b-tagging algorithm MV1 is based on a neural network using the output weights of IP3D, SV1 and JetFitterCombNN (defined in [55]) as inputs. The b-tagging requirements are set at an operating point which has an inclusive b-tag efficiency of 60% in a simulated sample of t t ¯ events, for which the algorithm provides a rejection factor of approximately 600 for light-quark and gluon jets and a rejection of approximately 8 for charm jets [56].
4.2 Lepton selection
Electrons are reconstructed from clusters in the electromagnetic calorimeter matched to a track in the ID [57]. For the final selection of signal events, “signal” electrons are required to pass a variant of the
“tight” selection of [57], which has been modified in 2012 to reduce the impact of pile-up [58]. Signal electrons must have p
T>25 GeV,
|η|<2.47 and a distance to the closest jet
∆R= p(∆η)
2+(∆φ)
2to be
∆R<
0.2 or
∆R>0.4. Electrons with
∆R<0.2 are kept, and the jet is discarded in order to avoid double counting, as every electron also gets reconstructed as a jet. The jets used in this
∆Rrequirement have
p
T>20 GeV and|η|<2.8. Signal electrons are required to pass further criteria on the electron isolation:
the scalar sum of the p
Tof tracks within a cone of radius
∆R =0.2 around the electron (excluding the electron itself) is required to be less than 10% of the electron p
T.
Muons are identified either as a combined track in the MS and ID systems, or as an ID track matching with a MS segment [59,60]. Requirements on the quality of the ID track are identical to those in Ref. [61].
Muons in the final selection (“signal” muons) are required to have p
T >25 GeV,
|η|<2.4 and
∆R>0.4 with respect to the closest jet where the requirements on the jets are the same as in the electron case.
Further isolation criteria are imposed: the scalar sum of the p
Tof tracks within a cone of radius
∆R=0.2 around the muon candidate (excluding the muon itself) is required to be less than 1.8 GeV.
4.3 E
missTcalculation
The missing transverse momentum calculation uses calorimeter clusters calibrated according to the re- constructed physics object to which they are associated. The association is performed with well-identified objects (electrons, jets and muons). The remaining non-associated energy deposits are also taken into account using an energy-flow algorithm [62].
5 Trigger and Data Collection
The data used in this analysis were collected in the first half of 2012 during which the instantaneous luminosity of the LHC reached 6.76
×10
33cm
−2s
−1. The average number of expected interactions per beam crossing ranged from approximately 6 to 32. After the application of beam, detector, and data- quality requirements, the total integrated luminosity is 5.8 fb
−1with a relative uncertainty of 3.6%, obtained with techniques similar to those described in [63].
In order to collect the data in the electron channel, a combined electron+E
missTtrigger, with thresholds
at 24 GeV for the electron and 35 GeV for E
missT, was used, in combination with an electron-only trigger
with a p
Tthreshold at 60 GeV. The E
Tmisstrigger uses a local hadronic calibration for the clusters and
is fully efficient for E
missT >80 GeV. The electron trigger selects events containing one or more electron
candidates, based on the presence of a cluster in the electromagnetic calorimeter, with a shower shape consistent with that of an electron. For signal electrons satisfying p
T>25 GeV, the trigger efficiency varies with the electron p
Tfrom 70% to 100%.
In the muon channel, a combined muon+jet+E
Tmisstrigger is used, with thresholds at 24 GeV for the muon, 65 GeV for the jet and 40 GeV for E
Tmiss. The muon trigger selects events containing one or more muon candidates based on the hit patterns in the MS and ID. The jet requirement in the trigger is fully efficient for offline jets with p
T>80 GeV. For signal muons satisfyingp
T>25 GeV andE
Tmiss>95 GeV, the trigger efficiency is in the plateau region; the plateau efficiency is around 70% in the barrel region and around 90% in the endcaps.
6 Event Selection
Two variables, derived from the kinematic properties of the reconstructed objects, are used in the event selection. The transverse mass (m
T) of the lepton (ℓ) and
pmissTis defined as
m
T = q2p
ℓTE
Tmiss(1
−cos(∆φ(~ℓ,
pmissT)))
The inclusive effective mass (m
inceff) is the scalar sum of the p
Tof the lepton, the jets and E
Tmiss: m
inceff =p
ℓT+Njet
X
i=1
p
T,i+E
Tmisswhere the index i runs over all the signal jets with p
T>40 GeV in the event. It is also useful to define H
T =m
inceff −E
Tmiss. The inclusive effective mass is correlated with the overall mass scale of the hard- scattering and provides good discrimination against SM background, without being too sensitive to the details of the SUSY decay cascade. A sum over the 4 leading- p
Tjets is used to compute m
eff, used in the ratio E
missT /meff. The latter is similar to the E
Tmisssignificance in that it reflects the change in the E
missTresolution as a function of the calorimeter activity in the event; the definition selected here improves the rejection of background from mismeasured jets.
This analysis is based on a signal region requiring at least four hard jets, one lepton (electron or muon) and E
missT. The number of signal leptons (electron or muon) is required to be exactly one. Events containing additional leptons are rejected in this analysis. For this veto, the identification selections are relaxed: for the electron, the “medium” quality requirement is used, the p
Trequirement is lowered to 10 GeV and the track isolation is not applied; for the muons, the p
Tthreshold is lowered to 10 GeV and the track isolation requirement is removed. At least 4 jets with p
T>80 GeV are required. In addition, thefollowing requirements are made: m
T>100 GeV,E
missT >250 GeV,E
missT /meff>0.2 andm
inceff >800 GeV.
This signal region was initially defined for the 7 TeV search [17], where it was found to be the best performing single signal region. The selection criteria are summarized in Table 2.
7 Background Estimation
The main sources of SM background in the signal region are t t ¯ production where both W decay leptoni-
cally and one lepton is lost or is a hadronically decaying tau, semi-leptonic t t, and associated production ¯
of jets and leptonically decaying W/Z bosons. The other background processes considered are single-top,
dibosons and misidentified leptons from fully hadronic multijet events. Dedicated samples for t t+W ¯
/Zproduction have not been considered since this background has been found to be negligible in 7 TeV
searches in this final state.
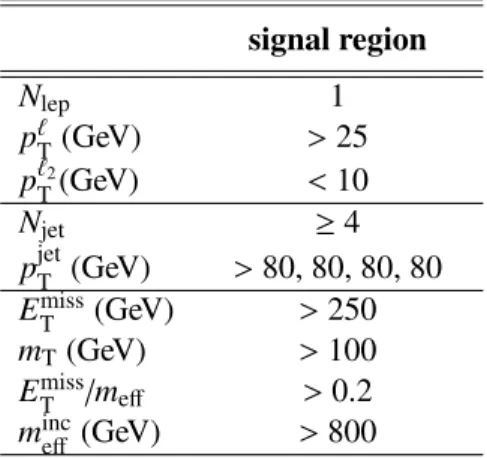
signal region
N
lep1
p
ℓT(GeV)
>25 p
ℓT2(GeV)
<10
N
jet ≥4
p
jetT(GeV)
>80, 80, 80, 80 E
Tmiss(GeV)
>250 m
T(GeV)
>100 E
Tmiss/meff >0.2 m
inceff(GeV)
>800
Table 2: Overview of the selection criteria for the signal region.
The major backgrounds (t¯ t and W/Z+jets) are estimated using control regions defined to be enriched in SM events from the process of interest. The normalization of the simulation is adjusted simultaneously in all the control regions using a binned fit described in Section 9, and the simulation is used to extrapolate the results into the signal region.
The multijet background is estimated entirely from the data by a matrix method described below, where one or more of the lepton identification criteria are inverted (with all other signal event selection criteria applied) and the resulting yield is multiplied by the probability for a jet to be mis-identified as an isolated lepton. All other (smaller) backgrounds are estimated entirely from the simulation, using the most accurate theoretical cross sections available.
7.1 W + jets and t t ¯ Control Regions
The W+jets and t t ¯ processes are isolated in control regions defined by the following requirements. The jet, lepton and m
Trequirements are the same as in the signal region. However, the E
missTis required to lie between 100 and 180 GeV and m
inceff, within the range 500-1300 GeV. The W+jets and t t ¯ control regions are distinguished by requirements on the number of b-tagged jets. For the W+jets control region, events are rejected if any of the 4 highest p
Tjets is b-tagged; the rejected events then define the t¯ t control region. Table 3 summarizes the control regions definitions, while Figure 1 shows the E
missTdistribution in events after requiring 1 lepton and four jets. Figure 2 left (right) shows the composition of the W+jets (t¯ t ) control regions before the m
inceffselection is applied. Numerical results on the composition of the control regions are presented in Table 4 of Section 9. It can be seen in these plots and table that an overall normalization factor is needed to correct for the W+jets contribution; this is expected due to an observed mismodeling of m
Tin the W+jets MC and the normalization is corrected through the usual fitting procedure described in Section 9.
7.2 Multijet Background
Multijet events become a background when a jet is misidentified as an isolated lepton or when a real lepton appears as a decay product of hadrons in jets but is sufficiently isolated, for example from b
−or c
−jets. Such lepton-like objects are collectively referred to as misidentified leptons in this note. The multijet background in the signal region, and in the W+jets and t t ¯ control regions where it is more significant, is estimated from the data following a matrix method similar to that employed in Ref. [17].
In this method, the multijet process is enhanced in a control sample with all the SUSY signal or
control region criteria applied but where the lepton isolation criteria are not imposed and the shower
W+jets control region t t ¯ control region
N
lep1 1
p
ℓT1(GeV)
>25
>25
p
ℓT2(GeV)
<10
<10
N
jet ≥4
≥4
p
jetT(GeV)
>80, 80, 80, 80
>80, 80, 80, 80
N
b−tag0
≥1
E
Tmiss(GeV)
∈[100, 180]
∈[100, 180]
m
T(GeV)
>100 >100m
inceff(GeV)
∈[500,1300]
∈[500,1300]
Table 3: Definitions of the W+jets and t¯ t control regions.
Events / 40 GeV
10-2
10-1
1 10 102
103
104
105
106
107
108 Data(2012) SM Total multijets W+jets Z+jets Dibosons
t tsingle top
1/2=500
=400 m MSUGRA m0
Preliminary ATLAS
= 8TeV s
-1, Ldt=5.8 fb
∫
Electron channel selection
miss
jets + ET
(GeV)
miss
ET
0 200 400 600 800 1000
Data / SM 0
0.5 1 1.5 2
Events / 40 GeV
10-2
10-1
1 10 102
103
104
105
106
107
108
Data(2012) SM Total multijets W+jets Z+jets Dibosons
t tsingle top
1/2=500
=400 m MSUGRA m0
Preliminary ATLAS
= 8TeV s
-1, Ldt=5.8 fb
∫
Muon channel selection
miss
jets + ET
(GeV)
miss
ET
0 200 400 600 800 1000
Data / SM 0
0.5 1 1.5 2
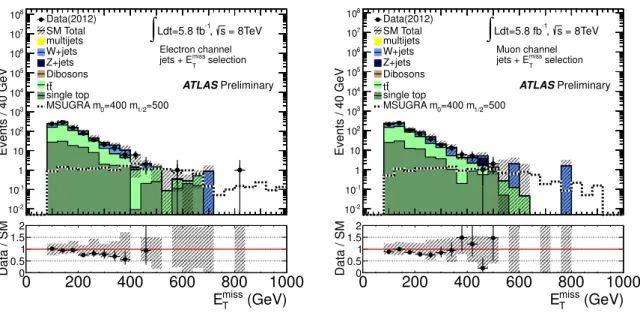
Figure 1: Left (right): E
Tmissdistribution after selecting events with one electron (muon) and at least four jets. The “Data/SM” plots show the ratio between data and the summed Standard Model expectation. The expectation for multijets is derived from the data. The remaining Standard Model expectation is derived from simulation only, normalized to the theoretical cross sections. The uncertainty band on the Standard Model expectation shown here combines the statistical uncertainty on the simulated event samples with the systematic uncertainties on the jet energy scale and resolution, b-tagging, and data-driven multijet background. For illustration, the expected signal distributions of the MSUGRA/CMSSM model point m
0=400 GeV, m
1/2=500 GeV are also shown.
shape requirements on electrons have been slightly relaxed. If N
passand N
failare the number of events found passing or failing the final lepton selection criteria in this control sample, then the number of events with a misidentified lepton in the SUSY signal or control region is given by:
N
passmisid=N
fail−(1/ǫ
real−1)N
pass1/ǫ
misid−1/ǫ
realwhere
ǫrealis the identification efficiency for real leptons and
ǫmisidis the misidentification efficiency for
Events / 200 GeV
10-2
10-1
1 10 102
103
104
105
106
107 Data(2012) SM Total multijets W+jets Z+jets Dibosons
t tsingle top
1/2=500
=400 m MSUGRA m0
Preliminary ATLAS
= 8TeV s
-1, Ldt=5.8 fb
∫
Electron + Muon combined W+jets Control Region
(GeV)
inc
meff
500 1000 1500 2000 2500
Data / SM 0
0.5 1 1.5 2
Events / 200 GeV
10-2
10-1
1 10 102
103
104
105
106
107 Data(2012) SM Total multijets W+jets Z+jets Dibosons
t tsingle top
1/2=500
=400 m MSUGRA m0
Preliminary ATLAS
= 8TeV s
-1, Ldt=5.8 fb
∫
Electron + Muon combined Control Region t
t
(GeV)
inc
meff
500 1000 1500 2000 2500
Data / SM 0
0.5 1 1.5 2
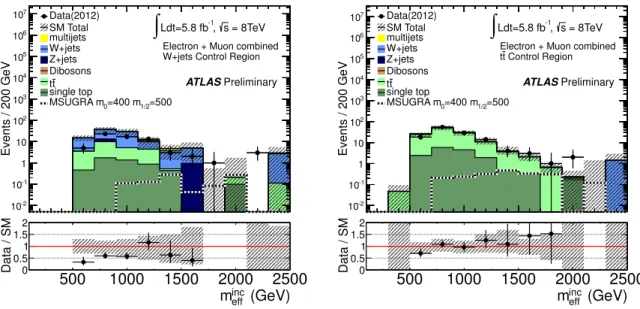
Figure 2: Left (right): m
inceffdistribution in the W+jets (t t ¯ ) control region in data and simulation before ap- plying the m
inceffselection. The muon and electron channels are combined. The “Data/SM” plots show the ratio between data and the summed Standard Model expectation. The expectation for multijets is derived from the data. The remaining Standard Model expectation is derived from simulation only, normalized to the theoretical cross sections. The uncertainty band on the Standard Model expectation shown here combines the statistical uncertainty on the simulated event samples with the systematic uncertainties on the jet energy scale and resolution, b-tagging, and data-driven multijet background. For illustration, the expected signal distributions of the MSUGRA/CMSSM model point m
0=400 GeV, m
1/2=500 GeV are also shown.
misidentified leptons.
The identification efficiency,
ǫreal, is obtained from data, using Z
→ℓ+ℓ−events. The lepton misiden- tification efficiency,
ǫmisid, is estimated as follows. For electrons (muons) with p
T>25 GeV, it is estimatedwith events containing at least one electron (muon) satisfying the relaxed criteria, at least one signal jet with p
T>25 (60) GeV and E
Tmiss<30 GeV. For these estimations, prescaled single lepton triggers are used in combination with unprescaled dilepton triggers. In addition, for the electron case, m
T <40 GeV is required and the events are split in two samples depending on whether or not they have at least one b- tagged jet, in order to allow
ǫmisidto vary as a function of the misidentified electron source (heavy-flavour decay or misidentified jets).
7.3 Other Backgrounds
The background from single-top and diboson production is estimated from simulation. The background from cosmic ray muons overlapping a hard-scattering event was estimated using a data-driven approach [17] and found to be negligible.
8 Systematic Uncertainties on the Background
Systematic uncertainties have an impact on the expected event yields in the control regions and on the
extrapolation factors used to derive the background yields in the signal region. The following detector-
related systematic uncertainties are taken into account.
The jet energy scale (JES) uncertainty has been measured using a combination of test beam, simula- tion and in-situ measurements from pp collisions as described in Ref. [52, 53] and depends on p
T,
ηand the presence of close-by jets. The jet energy resolution (JER) uncertainty has also been estimated using in-situ measurements [64]. Additional contributions to the JES and JER uncertainties arising from the high luminosity and pile-up in 2012 data are taken into account. Uncertainties on the lepton identifica- tion, momentum/energy scale and resolution are estimated from samples of Z
→ℓ+ℓ−, J/ψ
→ℓ+ℓ−and W
±→ℓ±νdecays [57, 59, 60]. These jet and lepton uncertainties are propagated to the E
missTcalculation which also includes an uncertainty coming from the energy deposits which are not associated to a jet or a lepton [62]. Uncertainties associated with the b-tagging efficiency are derived from data samples of jets containing muons [56] and the ones associated to the mistagging rates, from inclusive jet samples [65].
The theoretical uncertainties related to the dominant backgrounds (W+jets and t t ¯ ) are estimated using ALPGEN [34] samples with varying input parameters. The factorization and renormalization scales are varied by a factor of two, up and down with respect to the nominal setting. This variation mainly changes the overall cross section, but as the simulation is normalized to data in control regions, a change in the overall cross section does not impact the results. In the matching process implemented in the ALPGEN generator, an additional scale arises, namely the
αsscale; this matching scale is also varied by a factor of two with respect to its nominal value. The effect of this variation is to change the relative normalization of the various N
partonbins of the ALPGEN samples. The function which determines the factorization scale is also varied. Finally, the jet p
Tthreshold used in the MLM matching is varied from its default value of 15 GeV to 10 GeV or 20 GeV.
9 Background Fit
The background in the signal region is estimated with a fit based on the profile likelihood method [66].
The inputs to the fit are as follows:
1. The number of events observed in the W+jets and t t ¯ control regions, and the corresponding number of events expected from simulation, separated in four bins of m
inceff, ranging from 500 GeV to 1300 GeV. The electron and muon final states are treated independently. The inputs are shown in Fig. 2.
2. The transfer factors (obtained from the simulation) which relate the number of predicted W+jets (t t ¯ ) events in the W+jets (t t ¯ ) control region to the one predicted in the signal region.
3. The number of multijet events in each region obtained with the data-driven method.
4. The number of events predicted by the simulation in each region for the single-top and diboson backgrounds.
The number of events in each of these 16 bins is described using a Poisson probability density function. There are two free parameters considered: an overall normalization scale for the W
/Z+jetsbackground and another one for the t t ¯ background. The other background sources are allowed to vary in the fit within their respective uncertainties. The statistical and systematic uncertainties (see Section 8) on the expected values are included in the fit as nuisance parameters which are typically constrained by a Gaussian probability density function with a width corresponding to the size of the uncertainty considered; correlations between these parameters are taken into account. The product of the various probability density functions forms the likelihood which the fit maximises by adjusting the free and nuisance parameters. The fit does not further constrain the uncertainties except for a moderate constraint on the JES uncertainty for high-p
Tjets.
The background fit is cross-checked in a validation region located between the control and the signal
regions. The data in the validation region is not itself used as a constraint by the fit, but is used to compare
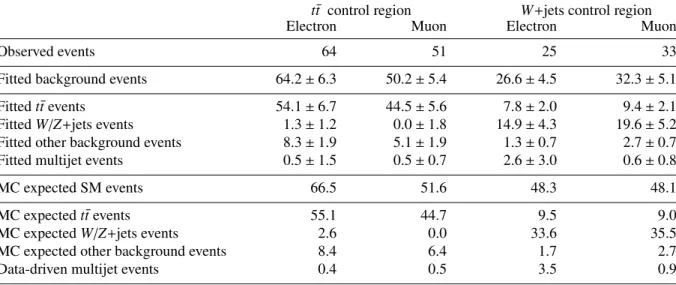
t¯t control region W+jets control region
Electron Muon Electron Muon
Observed events 64 51 25 33
Fitted background events 64.2±6.3 50.2±5.4 26.6±4.5 32.3±5.1
Fittedt¯tevents 54.1±6.7 44.5±5.6 7.8±2.0 9.4±2.1
FittedW/Z+jets events 1.3±1.2 0.0±1.8 14.9±4.3 19.6±5.2
Fitted other background events 8.3±1.9 5.1±1.9 1.3±0.7 2.7±0.7
Fitted multijet events 0.5±1.5 0.5±0.7 2.6±3.0 0.6±0.8
MC expected SM events 66.5 51.6 48.3 48.1
MC expectedt¯tevents 55.1 44.7 9.5 9.0
MC expectedW/Z+jets events 2.6 0.0 33.6 35.5
MC expected other background events 8.4 6.4 1.7 2.7
Data-driven multijet events 0.4 0.5 3.5 0.9
Table 4: Background fit results for electron and muon channels in the t t ¯ and W+jets control regions, for an integrated luminosity of 5.8 fb
−1. Nominal MC expectations (normalised to MC cross-sections) are given for comparison. The errors shown are the statistical plus systematic uncertainties.
the results of the fit to statistically independent observations. The validation region is defined in the same way as the signal region, except for the requirement on E
Tmiss, which must lie between 180 and 250 GeV, and for a lower threshold on the third and fourth jet p
T, with p
T>40 GeV.The results of the fit, interpreted for the control and validation regions, are shown in Tables 4 and 5.
Reasonable agreement is seen between the predicted and observed values in all regions within uncertain- ties. The background uncertainties are dominated by the statistical uncertainty of the simulated samples and the JES uncertainties.
10 Results and Interpretation
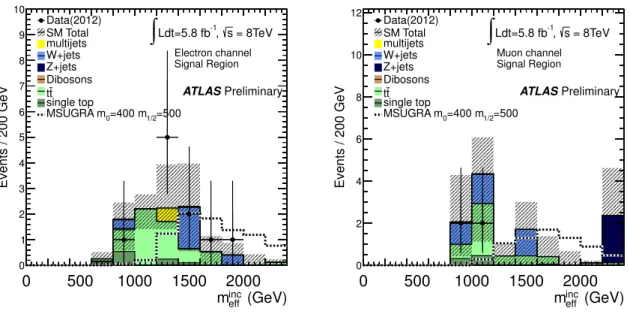
The distribution of m
inceffin the signal region after applying all the selections is shown in Figure 3. The results of the fit are shown in Table 6: the number of events seen in the signal regions is consistent with the Standard Model expectations. Note that the apparent difference between the electron and muon channels for the number of predicted W/Z+jets events in the signal region stems from large statistical uncertainties of the simulated samples in this region.
Model-independent limits on the visible cross section (i.e. the cross section evaluated inside the signal region) are derived from the number of observed and predicted events in the signal region, where the predicted events are extrapolated to the signal region from the background fit results. Limits on the number of non-SM events in the signal region, derived using the CL
sprescription [67], are divided by the integrated luminosity to obtain the limits on the visible cross section.
Given the absence of a significant excess above the Standard Model background expectations, limits can also be placed on specific models of physics beyond the Standard Model. In this case, the fit is modified in the following way:
1. there is an extra free parameter for a possible non-SM signal strength which is constrained to be non-negative,
2. the number of events observed in the signal region is now also considered as an input to the fit.
Validation region
Electron Muon
Observed events 32 30
Fitted background events 40.0±6.9 40.2±8.2
Fittedt¯tevents 27.3±6.0 21.8±4.9
FittedW/Z+jets events 5.7±2.2 13.5±5.7
Fitted other background events 5.5±1.3 4.9±2.0
Fitted multijet events 1.5±1.9 0.0±0.0
MC expected SM events 42.8 45.8
MC expectedt¯tevents 25.2 20.1
MC expectedW/Z+jets events 10.2 20.2
MC expected other background events 5.8 5.5
Data-driven multijet events 1.5 0.0
Table 5: Background fit results for the electron and muon channels in the validation region, for an integrated luminosity of 5.8 fb
−1. Nominal MC expectations (normalised to MC cross-sections) are given for comparison. The errors shown are the statistical plus systematic uncertainties.
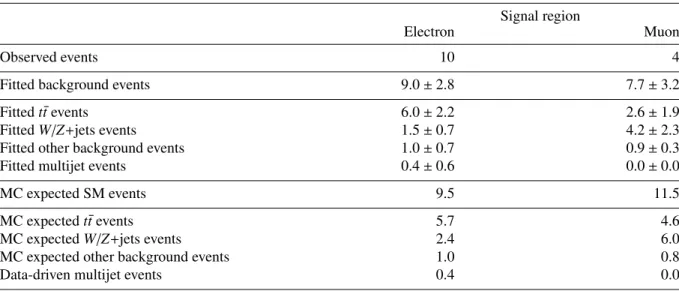
Signal region
Electron Muon
Observed events 10 4
Fitted background events 9.0±2.8 7.7±3.2
Fittedt¯tevents 6.0±2.2 2.6±1.9
FittedW/Z+jets events 1.5±0.7 4.2±2.3
Fitted other background events 1.0±0.7 0.9±0.3
Fitted multijet events 0.4±0.6 0.0±0.0
MC expected SM events 9.5 11.5
MC expectedt¯tevents 5.7 4.6
MC expectedW/Z+jets events 2.4 6.0
MC expected other background events 1.0 0.8
Data-driven multijet events 0.4 0.0
Table 6: Background fit results for the electron and muon channels in the signal region, for an inte- grated luminosity of 5.8 fb
−1. Nominal MC expectations (normalised to MC cross-sections) are given for comparison. The errors shown are the statistical plus systematic uncertainties.
hǫσi95obs
[fb] S
95obsS
95expCL
BElectron 1.69 9.9 9.3
+3.3−2.60.59
Muon 1.09 6.4 8.3
+3.4−2.30.19
Table 7: 95% CL upper limits on the visible cross-section (
hǫσi95obs) and on the observed (S
95obs) and
expected (S
95exp) number of signal events. The last column indicates the CL
Bvalue, i.e. the confidence
level observed for the background-only hypothesis.
(GeV)
inc
meff
0 500 1000 1500 2000
Data / SM 0
0.5 1 1.5 2
Events / 200 GeV
0 1 2 3 4 5 6 7 8 9 10
Data(2012) SM Total multijets W+jets Z+jets Dibosons
t tsingle top
1/2=500
=400 m MSUGRA m0
Preliminary ATLAS
= 8TeV s
-1, Ldt=5.8 fb
∫
Electron channel Signal Region
(GeV)
inc
meff
0 500 1000 1500 2000
Data / SM 0
0.5 1 1.5 2
Events / 200 GeV
0 2 4 6 8 10
12 Data(2012) SM Total multijets W+jets Z+jets Dibosons
t tsingle top
1/2=500
=400 m MSUGRA m0
Preliminary ATLAS
= 8TeV s
-1, Ldt=5.8 fb
∫
Muon channel Signal Region
Figure 3: m
inceffdistribution in the signal region in data and simulation for the electron (left) and muon (right) channels. The expectation for multijets is derived from the data. The remaining Standard Model expectation is derived from simulation only, normalized to the theoretical cross sections. The uncer- tainty band on the Standard Model expectation shown here combines the statistical uncertainty on the simulated event samples with the systematic uncertainties on the jet energy scale and resolution, b- tagging, and data-driven multijet background. For illustration, the expected signal distributions of the MSUGRA/CMSSM model point m
0=400 GeV, m
1/2=500 GeV are also shown.
The likelihood is also modified to take into account the model m
inceffshape information by dividing the signal region into four bins (from 800 GeV to 1600 GeV, with the last bin being inclusive for higher m
inceffvalues) and including bin-by-bin expectations. Furthermore, the expected contamination of the control regions by the signal is included in the fit. The statistically independent electron and muon channels are combined to place limits in the MSUGRA/CMSSM model described in Section 3. Systematic un- certainties on the SUSY signal expectations stemming from detector effects are included in the fit in the same way as for the backgrounds. Systematic uncertainties on the SUSY cross section due to the choice of renormalization and factorization scale and PDF uncertainties are calculated following the procedure described in [31] and are taken into account; typical uncertainties in the region where limits are placed are approximately 20-30%. The limit in the m
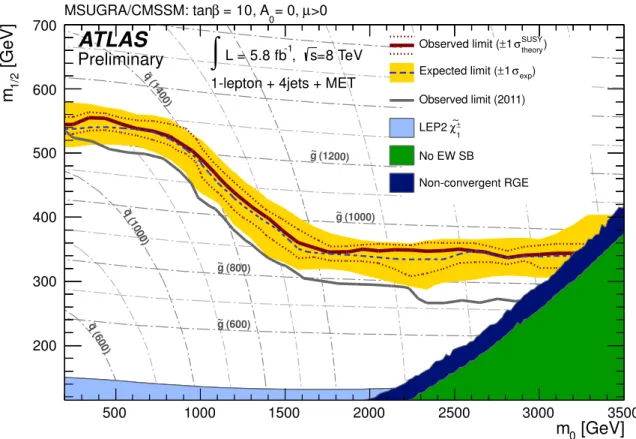
1/2vs m
0MSUGRA/CMSSM plane are shown in Figure 4.
11 Conclusion
A search with the ATLAS detector for SUSY in final states containing at least four hard jets, one isolated
lepton (electron or muon) and E
Tmissis presented in this note. This analysis uses 5.8 fb
−1of data collected
at a center-of-mass energy of 8 TeV. No excess above the Standard Model background expectation is
observed and limits are set. In the MSUGRA/CMSSM model, results in this signal region alone exclude
squark and gluino masses of 1.24 TeV (for equal squark and gluino masses) while the limit on the gluino
mass at high m
0is approximately 900 GeV; the mass limit is thus increased with respect to the previous
analysis [17] by about 50 GeV for squarks and gluinos of equal mass and by about 150 GeV for the
gluino mass at high m
0.
[GeV]
m
0500 1000 1500 2000 2500 3000 3500
[GeV]
1/2m
200 300 400 500 600 700
(600) g~
(800) g~
(1000) g~ (1200) g~
(600) q~
(1000) q~
(1400) q~
>0 µ
= 0, = 10, A0
β MSUGRA/CMSSM: tan
=8 TeV s
-1, L = 5.8 fb
∫
1-lepton + 4jets + MET
ATLAS
Preliminary
theory) σSUSY
±1 Observed limit (
exp) σ
±1 Expected limit ( Observed limit (2011)
±
χ∼1
LEP2 No EW SB
Non-convergent RGE
Figure 4: 95% CL exclusion limit presented in the m
0–m
1/2MSUGRA/CMSSM plane with tan
β =10, A
0 =0 and
µ >0. The blue dashed line shows the expected limits at 95% CL, with the light (yellow) bands indicating the
±1σ variation on the median expected limit due to the experimental uncertainties.
The observed nominal limit is indicated by a solid dark red line with the dark red dotted lines being obtained by varying the signal cross section by the scale and PDF uncertainties. The observed limit set by the previous ATLAS analysis [17] using 7 TeV data is shown as a solid grey line. Some regions are theoretically excluded because there is no electroweak symmetry breaking (green area) or because the numerical algorithms solving the renormalization group equations do not converge (dark blue area).
References
[1] H. Miyazawa, Baryon Number Changing Currents, Prog. Theor. Phys.
36 (6)(1966) 1266–1276.
[2] P. Ramond, Dual Theory for Free Fermions, Phys. Rev.
D3(1971) 2415–2418.
[3] Y. A. Golfand and E. P. Likhtman, Extension of the Algebra of Poincare Group Generators and Violation of p Invariance, JETP Lett.
13(1971) 323–326. [Pisma Zh. Eksp. Teor. Fiz.
13:452-455,1971].
[4] A. Neveu and J. H. Schwarz, Factorizable dual model of pions, Nucl. Phys.
B31(1971) 86–112.
[5] A. Neveu and J. H. Schwarz, Quark Model of Dual Pions, Phys. Rev.
D4(1971) 1109–1111.
[6] J. Gervais and B. Sakita, Field theory interpretation of supergauges in dual models, Nucl. Phys.
B34
(1971) 632–639.
[7] D. V. Volkov and V. P. Akulov, Is the Neutrino a Goldstone Particle?, Phys. Lett.
B46(1973)
109–110.
[8] J. Wess and B. Zumino, A Lagrangian Model Invariant Under Supergauge Transformations, Phys.
Lett.
B49(1974) 52.
[9] J. Wess and B. Zumino, Supergauge Transformations in Four-Dimensions, Nucl. Phys.
B70(1974) 39–50.
[10] L. Evans and P. Bryant (editors), LHC Machine, JINST
3(2008) S08001.
[11] P. Fayet, Supersymmetry and Weak, Electromagnetic and Strong Interactions, Phys. Lett.
B64(1976) 159.
[12] P. Fayet, Spontaneously Broken Supersymmetric Theories of Weak, Electromagnetic and Strong Interactions, Phys. Lett.
B69(1977) 489.
[13] G. R. Farrar and P. Fayet, Phenomenology of the Production, Decay, and Detection of New Hadronic States Associated with Supersymmetry, Phys. Lett.
B76(1978) 575–579.
[14] P. Fayet, Relations Between the Masses of the Superpartners of Leptons and Quarks, the Goldstino Couplings and the Neutral Currents, Phys. Lett.
B84(1979) 416.
[15] S. Dimopoulos and H. Georgi, Softly Broken Supersymmetry and SU(5), Nucl. Phys.
B193(1981) 150.
[16] CMS Collaboration, Search for supersymmetry in events with a single lepton and jets using templates, CMS-PAS-SUS-11-027 (2012), https://cdsweb.cern.ch/record/1449810.
[17] ATLAS Collaboration, Further search for supersymmetry at
√s
=7 TeV in final states with jets, missing transverse momentum and one isolated lepton, ATLAS-CONF-2012-041 (2012), https://cdsweb.cern.ch/record/1435195a.
[18] ATLAS Collaboration, The ATLAS Experiment at the CERN Large Hadron Collider, JINST
3(2008) S08003.
[19] ATLAS Collaboration, Expected Performance of the ATLAS Experiment - Detector, Trigger and Physics, arXiv:0901.0512 [hep-ex].
[20] A.H. Chamseddine, R.L. Arnowitt and P. Nath, Phys. Rev. Lett.
49(1982) 970; R. Barbieri, S.
Ferrara and C.A. Savoy, Phys. Lett.
B119(1982) 343; L.E. Ibanez, Phys. Lett.
B118(1982) 73;
L.J. Hall, J.D. Lykken and S. Weinberg, Phys. Rev.
D27(1983) 2359; N. Ohta, Prog. Theor. Phys.
70
(1983) 542.
[21] G. L. Kane, C. F. Kolda, L. Roszkowski, and J. D. Wells, Study of constrained minimal supersymmetry, Phys. Rev.
D49(1994) 6173–6210, arXiv:hep-ph/9312272 [hep-ph].
[22] M. Bahr, S. Gieseke, M. Gigg, D. Grellscheid, K. Hamilton, et al., Herwig++ Physics and Manual, Eur. Phys. J.
C58(2008) 639–707, arXiv:0803.0883 [hep-ph].
[23] A. Djouadi, M. Muhlleitner, and M. Spira, Decays of supersymmetric particles: The Program SUSY-HIT (SUspect-SdecaY-Hdecay-InTerface), Acta Phys. Polon. B38 (2007) 635644, arXiv:hep-ph/0609292 [hep-ph].
[24] B.C. Allanach, SOFTSUSY: a program for calculating supersymmetric spectra, Comput. Phys.
Commun. 143 305-331 (2002), arXiv:hep-ph/0104145 [hep-ph].
[25] M. Muhlleitner, A. Djouadi, and Y. Mambrini, SDECAY: A Fortran code for the decays of the supersymmetric particles in the MSSM, Comput. Phys. Commun. 168 (2005) 4670,
arXiv:hep-ph/0311167 [hep-ph].
[26] W. Beenakker, R. Hopker, M. Spira, and P. Zerwas, Squark and gluino production at hadron colliders, Nucl. Phys.
B492(1997) 51–103, arXiv:hep-ph/9610490 [hep-ph].
[27] A. Kulesza and L. Motyka, Threshold resummation for squark-antisquark and gluino-pair production at the LHC, Phys. Rev. Lett.
102(2009) 111802, arXiv:0807.2405 [hep-ph].
[28] A. Kulesza and L. Motyka, Soft gluon resummation for the production of gluino-gluino and squark-antisquark pairs at the LHC, Phys. Rev.
D80(2009) 095004, arXiv:0905.4749 [hep-ph].
[29] W. Beenakker, S. Brensing, M. Kramer, A. Kulesza, E. Laenen, et al., Soft-gluon resummation for squark and gluino hadroproduction, JHEP
0912(2009) 041, arXiv:0909.4418 [hep-ph].
[30] W. Beenakker, S. Brensing, M. Kramer, A. Kulesza, E. Laenen, et al., Squark and gluino hadroproduction, Int. J. Mod. Phys.
A26(2011) 2637–2664, arXiv:1105.1110 [hep-ph].
[31] M. Kr¨amer et al, Supersymmetry production cross sections in pp collisions at
√s
=7 TeV, CERN-PH-TH/2012-163 (2012), arXiv:1206.2892.
[32] S. Frixione and B. R. Webber, Matching NLO QCD computations and parton shower simulations, JHEP
0206(2002) 029, arXiv:hep-ph/0204244 [hep-ph].
[33] M. Aliev, H. Lacker, U. Langenfeld, S. Moch, P. Uwer, et al., HATHOR: HAdronic Top and Heavy quarks crOss section calculatoR, Comput. Phys. Commun.
182(2011) 1034–1046,
arXiv:1007.1327 [hep-ph].
[34] M. L. Mangano, M. Moretti, F. Piccinini, R. Pittau, and A. D. Polosa, ALPGEN, a generator for hard multiparton processes in hadronic collisions, JHEP
0307(2003) 001,
arXiv:hep-ph/0206293 [hep-ph].
[35] K. Melnikov and F. Petriello, Electroweak gauge boson production at hadron colliders through O(alpha(s)**2), Phys. Rev.
D74(2006) 114017, arXiv:hep-ph/0609070 [hep-ph].
[36] B.P. Kersevan and E. Richter-Was, The Monte Carlo event generator AcerMC version 2.0 with interfaces to PYTHIA 6.2 and HERWIG 6.5, hep-ph/0405247 (2004).
[37] N. Kidonakis, Next-to-next-to-leading-order collinear and soft gluon corrections for t-channel single top quark production, Phys. Rev. D83 091503 (2011), arXiv:1103.2792 [hep-ph].
[38] N. Kidonakis, NNLL resummation for s-channel single top quark production, Phys. Rev. D81 054028 (2010), arXiv:1001.5034 [hep-ph].
[39] N. Kidonakis, Two-loop soft anomalous dimensions for single top quark associated production with a W- or H-, Phys. Rev. D82 054018 (2010), arXiv:1005.4451 [hep-ph].
[40] G. Corcella, I. Knowles, G. Marchesini, S. Moretti, K. Odagiri, et al., HERWIG 6: An Event
generator for hadron emission reactions with interfering gluons (including supersymmetric
processes), JHEP
0101(2001) 010, arXiv:hep-ph/0011363 [hep-ph].
[41] J. M. Campbell, R. Ellis, and D. L. Rainwater, Next-to-leading order QCD predictions for W
+2 jet and Z
+2 jet production at the CERN LHC, Phys. Rev.
D68(2003) 094021,
arXiv:hep-ph/0308195 [hep-ph].
[42] J. Butterworth, J. R. Forshaw, and M. Seymour, Multiparton interactions in photoproduction at HERA, Z. Phys.
C72(1996) 637–646, arXiv:hep-ph/9601371 [hep-ph].
[43] J. Pumplin, D. Stump, J. Huston, H. Lai, P. M. Nadolsky, et al., New generation of parton distributions with uncertainties from global QCD analysis, JHEP
0207(2002) 012, arXiv:hep-ph/0201195 [hep-ph].
[44] H.-L. Lai, M. Guzzi, J. Huston, Z. Li, P. M. Nadolsky, et al., New parton distributions for collider physics, Phys. Rev.
D82(2010) 074024, arXiv:1007.2241 [hep-ph].
[45] ATLAS Collaboration, New ATLAS event generator tunes to 2010 data,
ATL-PHYS-PUB-2011-008 (2011), https://cdsweb.cern.ch/record/1345343.
[46] S. Catani, L. Cieri, G. Ferrera, D. de Florian, M. Grazzini, Phys. Rev. Lett. 103 082001 (2009), arXiv:0903.2120 [hep-ph]; S. Catani, M. Grazzini, Phys. Rev. Lett. 98 222002 (2007) hep-ph/0703012.
[47] A. Martin, W. Stirling, R. Thorne, and G. Watt, Update of parton distributions at NNLO, Phys.
Lett.
B652(2007) 292–299, arXiv:0706.0459 [hep-ph].
[48] ATLAS Collaboration, The ATLAS Simulation Infrastructure, Eur. Phys. J.
C70(2010) 823–874, arXiv:1005.4568 [physics.ins-det].
[49] GEANT4 Collaboration, S. Agostinelli et al., GEANT4: A Simulation toolkit, Nucl. Instrum.
Meth.
A506(2003) 250–303.
[50] M. Cacciari, G. P. Salam, and G. Soyez, The anti-k
tjet clustering algorithm, JHEP
04(2008) 063, arXiv:0802.1189 [hep-ph].
[51] M. Cacciari and G. P. Salam, Dispelling the N
3myth for the k
tjet-finder, Phys. Lett.
B641(2006) 57–61, arXiv:hep-ph/0512210.
[52] ATLAS Collaboration, Jet energy measurement with the ATLAS detector in proton-proton collisions at
√s
=7 TeV , arXiv:1112.6426 [hep-ex]. Submitted to Eur. Phys. J. C.
[53] ATLAS Collaboration, Single hadron response measurement and calorimeter jet energy scale uncertainty with the ATLAS detector at the LHC, arXiv:1203.1302 [hep-ex].
[54] ATLAS Collaboration, Performance of primary vertex reconstruction in proton-proton collisions at
√s
=7 TeV in the ATLAS experiment, ATLAS-CONF-2010-069 (2010),
http://cdsweb.cern.ch/record/1281344.
[55] ATLAS Collaboration, Commissioning of the ATLAS high-performance b-tagging algorithms in the 7 TeV collision data, ATLAS-CONF-2011-102 (2011),
https://cdsweb.cern.ch/record/1369219.
[56] ATLAS Collaboration, Measurement of the b-tag Efficiency in a Sample of Jets Containing Muons with 5 fb
−1of Data from the ATLAS Detector, ATLAS-CONF-2012-043 (2012),
https://cdsweb.cern.ch/record/1435197.
[57] ATLAS Collaboration, Electron performance measurements with the ATLAS detector using the 2010 LHC proton-proton collision data, arXiv:1110.3174 [hep-ex].
[58] https://atlas.web.cern.ch/Atlas/GROUPS/PHYSICS/EGAMMA/
PublicPlots/20121403/EfficiencyPileup/ATL-COM-PHYS-2012-260/index.html [59] ATLAS Collaboration, A measurement of the ATLAS muon reconstruction and trigger efficiency
using J/psi decays, ATLAS-CONF-2011-021 (2011), https://cdsweb.cern.ch/record/1336750.
[60] ATLAS Collaboration, Muon reconstruction efficiency in reprocessed 2010 LHC proton-proton collision data recorded with the ATLAS detector, ATLAS-CONF-2011-063 (2011),
https://cdsweb.cern.ch/record/1345743.
[61] ATLAS Collaboration, Search for supersymmetry in final states with jets, missing transverse momentum and one isolated lepton in
√s
=7 TeV collisions using 1 fb
−1of ATLAS data, Phys.
Rev.
D85(2012) 012006. arXiv:1109.6606 [hep-ex]
[62] ATLAS Collaboration, Performance of Missing Transverse Momentum Reconstruction in
Proton-Proton Collisions at 7 TeV with ATLAS, Eur.Phys.J. C72 1844 (2012), arXiv:1108.5602 [hep-ex].
[63] ATLAS Collaboration, Luminosity Determination in pp Collisions at sqrt(s)
=7 TeV using the ATLAS Detector in 2011, ATLAS-CONF-2011-116 (2011),
https://cdsweb.cern.ch/record/1376384.
[64] ATLAS Collaboration, Jet energy resolution and selection efficiency relative to track jets from in-situ techniques with the ATLAS Detector Using Proton-Proton Collisions at a Center of Mass Energy
√s
=7 TeV, ATLAS-CONF-2010-054 (2010), https://cdsweb.cern.ch/record/1281311.
[65] ATLAS Collaboration, Measurement of the Mistag Rate of b-tagging algorithms with 5 fb
−1of Data Collected by the ATLAS Detector, ATLAS-CONF-2012-040 (2012),
https://cdsweb.cern.ch/record/1435194.
[66] G. Cowan, K. Cranmer, E. Gross, and O. Vitells, Asymptotic formulae for likelihood-based tests of new physics, Eur. Phys. J.
C71(2011) 1554, arXiv:1007.1727 [physics.data-an].
[67] A. L. Read, Presentation of search results: The CL(s) technique, J. Phys. G
G28(2002)
2693–2704.
A Additional figures
[GeV]
miss
ET
0 100 200 300 400 500 600 700 800 900 1000 [GeV]TH
0 200 400 600 800 1000 1200 1400 1600 1800 2000
Signal Region
>100GeV) (mT
>800GeV meff
eff
>0.2m
missT
E
WR+TR >100GeV) T(m
>500GeV meff
<1300GeV meff
<40GeV) TMultijet Control Region (m<40GeV) TMultijet Control Region (m<40GeV) TMultijet Control Region (m<40GeV) TMultijet Control Region (m<40GeV) TMultijet Control Region (m
[GeV]
meff
400 600 800 1000 1200 1400 1600 1800 2000 [GeV]miss TE
0 50 100 150 200 250 300
Validation Region (VR4) Signal Region (SR)
W+jets Control Region (WR) (no b-jet)
1 b-jet)
≥ (TR) (
Top Control Region
>100GeV mT
<40GeV) Multijet Control Region (mT