A TLAS-CONF-2018-044 13 September 2018
ATLAS CONF Note
ATLAS-CONF-2018-044
13th September 2018
Search for charged lepton-flavour violation in top-quark decays at the LHC with the ATLAS
detector
The ATLAS Collaboration
A direct search for charged lepton-flavour violation in top-quark decays is presented. The data analysed correspond to 79 . 8 fb
−1of proton–proton collisions at a centre-of-mass energy of
√ s = 13 TeV delivered by the LHC. The process studied is the production of top-quark pairs, where one top quark decays into a pair of opposite-sign different-flavour charged leptons and an up-type quark, while the other decays semileptonically according to the Standard Model.
The signature of the signal is thus characterised by the presence of three charged leptons, a light jet and a b -jet. A multivariate discriminant is deployed and its distribution used as input to extract the signal strength. In the absence of a signal, an upper limit on the branching ratio of B(t → ``
0q) < 1 . 86 × 10
−5is set at the 95% confidence level.
© 2018 CERN for the benefit of the ATLAS Collaboration.
1 Introduction
The flavour of both, charged and neutral leptons is conserved according to the Standard Model (SM).
Nonetheless, the observation of neutrino oscillations indicates the presence of some uncharted New Physics (NP). The minimal extension of the SM providing neutrino mass and mixing is the inclusion of right-handed Dirac neutrinos, which also allows the local non-conservation of charged lepton flavour.
In this scenario, charged lepton-flavour violation (cLFV) is possible but beyond current experimental sensitivity. For example, the muon decay into an electron and a photon, due to a neutrino oscillation in a W boson loop, has a predicted branching ratio of 10
−55[1]. Therefore, the observation of cLFV would provide a strong evidence for NP beyond the simplest SM extension. Several other extensions to the SM entail cLFV [1, 2]: the leptons and quarks unification into representations of the SU( 5 ) [3], SO( 10 ) [4, 5] or SU( 5 ) × U( 1 ) [6–9] groups, supersymmetric scenarios [10–14] and technicolor models [15–17].
However, assuming that the energy scale experimentally probed is significantly lower than the scale of the NP, it is convenient to consider a model-independent approach by means of an effective field theory (EFT). Lists of constraints on the operators describing two-lepton, two-quark contact interactions have been compiled on the basis of experimental measurements [18]. Nevertheless, couplings involving the top quark remain rather unconstrained, up to the point that some cLFV top-quark decays could be within the sensitivity of the Large Hadron Collider (LHC) [19].
In the present analysis, we search for the decay t(¯ t) → `
±`
0∓q(`
±`
0∓q) ¯ , where q = {u, c} and ` = {e, µ, τ}
in t t ¯ events, where the other top quark of the pair decays semileptonically, according to the SM. The process is well suited for a search at the LHC where top-quark pairs are copiously produced in proton–
proton ( pp ) collisions. Although τ leptons are included in the possible top-quark decays, only events with three reconstructed light leptons (electrons or muons, called leptons in the following) are considered. The lepton-flavour-violating top quark (cLFV top) is reconstructed from two opposite-sign different-flavour leptons and a jet, while a b -tagged jet, a third lepton and missing transverse momentum are assigned to the other top quark of the pair. No dedicated search for charged lepton-flavour violation has been previously performed in this channel [2]. The constraint on the branching ratio of the signal process is estimated in Ref. [19] only for the channel t → e
±µ
∓q ( τ lepton excluded) to be . 3 . 7 × 10
−3, using results from indirect searches. This translates into a loose constraint on the cross section of σ(t t ¯ → (eµq)(b`ν)) . 2 pb at
√ s = 13 TeV. The search presented in this note is performed using the pp collision data collected by ATLAS in 2015, 2016 and 2017, corresponding to an integrated luminosity of 79.8 fb
−1.
The t → `
±`
0∓q decay is described in terms of the EFT operators of dimension six [19] listed in Equation (1). The operators are classified according to their Lorentz structure. Axial-vector, scalar and pseudo-scalar operators are labelled AV , S and P , respectively, while operators that contract quark to lepton spinors are labelled LQ . The notation e
i= {e, µ, τ} and u
q= {u, c} is used, and H, H
0, H ¯ = L, R indicate the chirality of the projectors P , with H , H ¯ .
O
H HAV0= ( e ¯
iγ
αP
He
j)( u ¯
qγ
αP
H0t), O
HS+P= ( e ¯
iP
He
j)( u ¯
qP
Ht), O
HS−P= ( e ¯
iP
He
j)( u ¯
qP
H¯t), O
HLQ= ( u ¯
qP
He
j)( e ¯
iP
Ht).
(1)
The values of the corresponding operator coefficients are not predicted by the theory. Expressing the coef- ficients as 2
√
2 G
Fi, where G
Fis the Fermi constant and i indicates one of the operators of Equation (1),
the dimensionless coefficient
iis of the order 10
−2in case of an hypothetical mediator with mass around 1 TeV. The current bounds on the coefficients are presented in Ref. [19], where they are derived from searches of rare muon, B and K mesons decays and also single top searches at the HERA collider [20–22].
These bounds depend on the operator Lorentz structure, chirality and, most relevantly, on the presence of a τ lepton in the top-quark decay. Considering only operators involving an electron and a muon, the upper limits on the coefficients range from 3.7 × 10
−3to 1 for axial-vector operators and from 1 × 10
−3to 22 for scalar and pseudo-scalar operators.
This search focuses on the electron-muon final state, with a signal sample which includes also τ leptons in the cLFV decay. The inclusion of τ leptons is grounded on the lepton universality assumption and the similarity in the experimental signature between t → τe/µq → (µ/e νν)e/µq ¯ and t → µeq . An exclusion limit is calculated for t → `
±`
0∓q with ` = {e, µ, τ} . Additionally, a limit for the decay t → e
±µ
∓q , where τ leptons are not allowed in the cLFV vertex, is provided. The search strategy has been dictated by the current constraints on the operators’ coefficients, which depend more strongly on the flavour of the leptons rather than the Lorentz structure and/or chirality.
2 ATLAS detector
ATLAS [23] is a multi-purpose particle detector which covers almost the full solid angle1 around the in- teraction point (IP). The detector is symmetric in the forward-background direction. ATLAS is composed of an inner tracking detector surrounded by a thin superconducting solenoid, electromagnetic and had- ronic calorimeters, and a muon spectrometer incorporating three large superconducting toroidal magnet systems.
The inner tracking detector is the closest to the IP and consists of silicon pixel, silicon micro-strip, and transition-radiation detectors. The high-granularity silicon tracker has been upgraded in 2014 adding the Insertable B-Layer [24], the silicon layer now closest to the beam pipe. The transition radiation tracker provides also electron identification information based on the fraction of hits passing a higher charge threshold indicative of transition radiation. The inner detector covers the pseudorapidity range |η| < 2 . 5 and is immersed in a 2 T axial magnetic field provided by the surrounding superconducting solenoid.
The calorimeter system covers the pseudorapidity range |η| < 4 . 9. Within |η| < 3 . 2, lead/liquid argon (LAr) sampling calorimeters, extending for more than 20 radiation lengths, measure the electromagnetic energy. An additional thin LAr presampler, extending in |η| < 1 . 8, provides corrections for the energy loss in the material upstream of the calorimeter. The hadronic calorimeter consists of scintillating tiles separated by steel absorbers in the central region ( |η| < 1 . 7), and of copper/LAr calorimeters in the endcap region (1 . 5 < |η| < 3 . 2). The pseudorapidity range 3 . 2 < |η| < 4 . 9 is instrumented with forward copper/LAr and tungsten/LAr calorimeters dedicated to electromagnetic and hadronic energy measurements, respectively.
A muon spectrometer and a system of three superconducting air-core toroids with eight coils each, both surrounding the calorimeters, completes the detector. The field integral of the toroids ranges between 2.0
1 ATLAS uses a right-handed coordinate system with its origin at the nominal interaction point (IP) in the centre of the detector and thez-axis along the beam pipe. Thex-axis points from the IP to the centre of the LHC ring, and they-axis points upwards. Cylindrical coordinates(r, φ)are used in the transverse plane,φbeing the azimuthal angle around thez-axis.
The pseudorapidity is defined in terms of the polar angleθasη=−ln tan(θ/2). Angular distance is measured in units of
∆R≡p
(∆η)2+(∆φ)2.
and 6.0 T m across most of the detector. The magnetic field together with the long lever arm allows for a precise measurement of the muon deflection. The muon spectrometer includes a system of precision tracking chambers and fast detectors for triggering.
A two-level trigger [25] system is used to select events. The first-level trigger is implemented in hardware and uses a subset of the detector information to reduce the accepted rate to at most 100 kHz. This is followed by a software-based high-level trigger which reduces the accepted event rate to 1 kHz.
3 Data and simulation samples
The analysis uses data collected by ATLAS between 2015 and 2017 from pp collisions at a centre-of-mass energy of
√ s = 13 TeV, corresponding to an integrated luminosity of 79.8 fb
−1. Only events recorded with a fully operational detector and stable beam are included.
The signal is simulated at leading order (LO) precision in QCD with MadGraph5_aMC@NLO (termed as MG5_aMC in the following), v2.4.5 [26] interfaced with Pythia 8.212 [27] and tuned according to the ATLAS A14 [28] parameter set. A custom UFO model [29] created with FeynRules [30] is loaded into MG5_aMC. The parton distribution function (PDF) NNPDF31_lo_as_0130 [31] is used in the hard process generation while NNPDF2.3_lo is used by Pythia. The cross section is not taken from the generator but computed according to Equation (2):
σ
cLFV= 2 × σ
tt¯× B(t → `
±`
0∓q) × B(t → `νb) . (2) The combinatorial factor 2 is due to the interchangeability of the top quarks, the t¯ t production cross section is calculated at next-to-next-to-leading order including resummation of next-to-next-to-leading logarithmic soft gluon terms [32] and the measured semileptonic branching ratio of the top quark is used [33]. When choosing B(t → `
±`
0∓q) = 3 × 10
−4, an arbitrary value that lies in between the indirect limit reported in Section 1 and the value used in a sensitivity study [19], the cross section σ
cLFVequals 164 fb. Considering only AV operators and assuming equal coefficients, the chosen branching ratio corresponds to = 0 . 05.
Several sources of background are considered and their generator settings are summarised in Table 1.
Firstly, the processes that can give rise to three leptons in the final state with possible additional jets are considered, such as diboson production, t¯ t Z , t¯ tW , t tH ¯ , and associated single top-quark production, which includes t Z , tW Z and tH , termed t + X in the following. The leptons produced in these processes are called prompt as they originate from the primary vertex as decay products of the W , Z and H bosons.
Processes that can give rise to at most two leptons in the final state, but with high cross section such as t¯ t → `` + jets and Z → `` + jets are also considered. In these backgrounds an additional non-prompt/fake lepton (henceforth referred to as non-prompt lepton) can originate from a secondary process such as the decay of a b - or c -hadron, photon conversion or object mis-reconstruction.
The simulated samples corresponding to processes which cannot yield three prompt leptons (as t¯ t →
`` + jets, Z → `` + jets) are used exclusively to train the multivariate discriminant, described in Section 7,
and to determine some of the systematic uncertainties (Section 8) associated to the data-driven non-prompt
lepton background estimation, presented in Section 6. In all the other parts of the analysis the non-prompt
lepton background contribution is replaced by the data-driven estimation. In all the samples the top-quark
mass is set to 172.5 GeV, the Higgs boson mass to 125 GeV, and Pythia 8 is used with the A14 [28] set of tuned parameters.
Diboson processes yielding four charged leptons (4 ` ), three charged leptons and one neutrino (3 `ν ), or two charged leptons and two neutrinos (2 ` 2 ν ) are generated with Sherpa 2 . 2 . 2 [34] at NLO precision for up to one extra-parton emission, and at LO precision for the emission of two and three partons. Gluon-initiated diboson production and diboson scattering generated with Sherpa 2 . 2 . 2 are also included. The final state 2 ` 2 q is generated similarly but with Sherpa 2 . 2 . 1. For all the diboson samples the NNPDF3.0 NNLO PDF set [31] is used.
The t¯ t Z ( Z → `
+`
−) and t tW ¯ processes are simulated at NLO precision by MG5_aMC interfaced with Pythia 8. Both samples are normalised to the QCD and electroweak NLO cross section calculation [35]
using a fixed scale ( m
t+ m
V/ 2) and the PDF sets PDF4LHC15 [36] and NNPDF2.3 QED [31] for the electroweak corrections. The Z/γ
∗interference is included in the t¯ t Z sample with the criterion m
``> 5 GeV applied. The t¯ t Z sample also describes the rare top-quark decay t → W Z/γ
∗(→ `
+`
−)b where the Z/ γ
∗is emitted by the top quark and decays leptonically, resulting in a signature similar to the signal one. The contribution resulting from the emission of a Z /γ
∗by the b -quark or by the W boson are considered negligible in the phase space probed. The associated production of the Higgs boson with top-quark pairs is simulated at NLO precision in QCD with Powheg-Box 2 [37] in combination with Pythia 8. The NNPDF3.0 PDF set is used in the hard process simulation, while NNPDF2.3 LO is used for parton showering and hadronisation.
The production of a single top quark in association with a vector boson is included. The t Z process is generated with MG5_aMC + Pythia 8 using the NNPDF3.0 PDF set for the matrix element, and NNPDF2.3 for the showering. The tW process is generated with Powheg-Box 1 [38] + Pythia 6 [39]
configured with the CT10 [40] PDF set for the matrix element and the CTEQ6L1 [41] PDF set and Perugia2012 (P2012) [42] set of tuned parameters for the showering. The tW Z process is generated with MG5_aMC using the PDF set NNPDF3.0 and showered with Pythia 8 using the PDF set MMHT2014 [43].
The associated production of a single top quark and a Higgs boson, with the Higgs boson decaying into W
+W
−, Z Z or τ
+τ
−, is also included. The process is simulated with MG5_aMC + Pythia 8 using the CT10 PDF set for the matrix element and the NNPDF2.3 for the parton showering.
Other rare processes yielding three prompt leptons, as triboson production, 4 t , 3 t , t¯ tWW , W H and Z H , are included, as well (see Table 1 for details).
The t¯ t production in the dilepton decay channel, normalised as described in Ref. [44], is simulated with Powheg-Box 2 + Pythia 8. The PDF NNPDF3.0 is used for the matrix-element calculation, while the NNPDF2.3 PDF is used for the showering. The h
dampparameter, which controls the transverse momentum ( p
T) of the first emission beyond the Born configuration in Powheg, is set to 1.5 times the top-quark mass.
A dedicated sample describing t tγ ¯ is used and the overlap between the two samples is removed, using the generator information, by vetoing events in the t¯ t sample with radiated photons of high p
T. The resulting merged sample is called t¯ t( + γ) . The t tγ ¯ sample is generated with MG5_aMC + Pythia 8 at LO precision, using the NNPDF2.3 PDF.
The Z + jets production is simulated with Sherpa 2 . 2 . 1 and the NNPDF3.0 PDF at NLO precision for
events with up to two extra partons, at LO for up to four extra partons. The Z boson is allowed to be
off-shell. The samples are sliced in terms of the maximum between the boson p
Tand the scalar sum of
the transverse momenta of all final state objects ( H
T), and the presence of light, c - or b -jets in the final
state. Similarly to the case of t¯ t and t tγ ¯ , a dedicated set of samples including the emission of a photon in
the matrix element is considered. The partial overlap between the Z + jets and Zγ samples is removed.
The response of the detector is simulated with GEANT4 [45]. The same offline reconstruction methods used on data are also applied to simulated events. Furthermore, the distribution of the number of additional pp collisions in the same and nearby bunch crossing (pileup) is accounted for by overlaying minimum-bias events and reweighting the simulation to match the distributions observed in data. The minimum-bias events are simulated with Pythia 8.210, configured with the A3 set of tuned parameters [28] and the NNPDF2.3 PDF set.
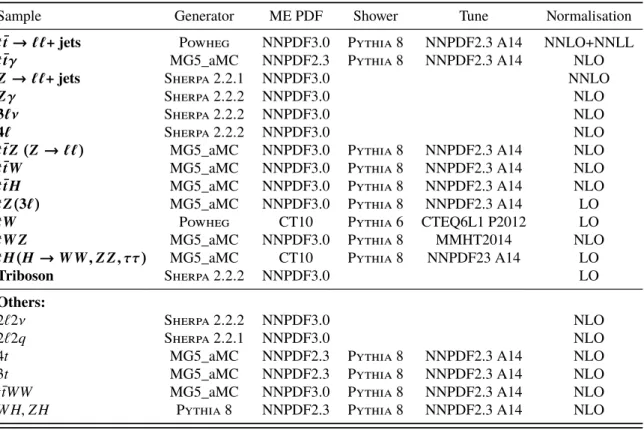
Table 1: Summary of basic generator parameters used to simulate the various processes. For each sample are reported: the hard process/matrix element generator, the parton distribution function (ME PDF), the parton shower simulator and its relative set of tuned parameters, and the QCD order to which the inclusive production cross section is normalised.
Sample Generator ME PDF Shower Tune Normalisation
t t ¯ → ``+ jets Powheg NNPDF3.0 Pythia 8 NNPDF2.3 A14 NNLO+NNLL
t tγ ¯ MG5_aMC NNPDF2.3 Pythia 8 NNPDF2.3 A14 NLO
Z → ``+ jets Sherpa 2 . 2 . 1 NNPDF3.0 NNLO
Zγ Sherpa 2 . 2 . 2 NNPDF3.0 NLO
3`ν Sherpa 2 . 2 . 2 NNPDF3.0 NLO
4` Sherpa 2 . 2 . 2 NNPDF3.0 NLO
t t Z ¯ (Z → ``) MG5_aMC NNPDF3.0 Pythia 8 NNPDF2.3 A14 NLO
t tW ¯ MG5_aMC NNPDF3.0 Pythia 8 NNPDF2.3 A14 NLO
t t H ¯ MG5_aMC NNPDF3.0 Pythia 8 NNPDF2.3 A14 NLO
t Z(3` ) MG5_aMC NNPDF3.0 Pythia 8 NNPDF2.3 A14 LO
tW Powheg CT10 Pythia 6 CTEQ6L1 P2012 LO
tW Z MG5_aMC NNPDF3.0 Pythia 8 MMHT2014 NLO
t H ( H → W W , Z Z, ττ) MG5_aMC CT10 Pythia 8 NNPDF23 A14 LO
Triboson Sherpa 2 . 2 . 2 NNPDF3.0 LO
Others:
2 ` 2 ν Sherpa 2 . 2 . 2 NNPDF3.0 NLO
2 ` 2 q Sherpa 2 . 2 . 1 NNPDF3.0 NLO
4 t MG5_aMC NNPDF2.3 Pythia 8 NNPDF2.3 A14 NLO
3 t MG5_aMC NNPDF2.3 Pythia 8 NNPDF2.3 A14 NLO
t tWW ¯ MG5_aMC NNPDF3.0 Pythia 8 NNPDF2.3 A14 NLO
W H, Z H Pythia 8 NNPDF2.3 Pythia 8 NNPDF2.3 A14 NLO
4 Object reconstruction
The physics objects considered in this analysis are electrons, muons, jets and missing transverse mo- mentum.
The primary vertex of an event is the vertex with the highest Í p
2T, tracks
[46], where the sum extends over all associated tracks with p
T> 0 . 5 GeV. At least two tracks are required.
Electron candidates are reconstructed from energy clusters in the electromagnetic calorimeter that are associated with charged particle tracks reconstructed in the inner detector [47]. Only candidates with
| η | < 2 . 47 and p
T> 10 GeV are considered. The transition region 1 . 37 < | η | < 1 . 52 between the central
and the forward region of the electromagnetic calorimeter has a lower energy resolution and is therefore
excluded. Electron candidates are required to be consistent with originating from the primary vertex by requiring | d
0|/σ
d0< 5 and | z
0sin (θ)| < 0 . 5 mm, where d
0is the transverse impact parameter with uncertainty σ
d0, z
0the longitudinal impact parameter, and θ the polar angle.
A multivariate likelihood discriminant [48] combining shower shape and track information is used to define several identification working points (ID) characterised by different signal selection and background efficiencies, the latter corresponding to mis-identification rates. The loose ID has a signal (background) efficiency ranging between 0.92 (0.003) and 0.97 (0.008) depending on the candidate electron p
Tand η . The tight ID has a signal (background) efficiency ranging between 0.78 (0.001) and 0.91 (0.003) depending on the candidate electron p
Tand η . Electrons passing the tight ID are subject to calorimeter and track isolation requirements. The scalar sum of the tracks’ transverse momenta around the electron candidate within a cone of ∆R = min ( 0 . 2 , 10 GeV /p
eT
) must be less than 6 % of the transverse momentum of the electron ( p
eT
). In addition the sum of transverse energies of calorimeter clusters within a cone of
∆R = p
(∆ φ)
2+ (∆ η)
2= 0 . 2 around the electron candidate must be less than 6 % of the p
eT
. The isolation requirement has an efficiency of around 95 %.
Muon candidates are reconstructed by combining inner detector tracks with track segments or full tracks in the muon spectrometer [49]. The rigidity (charge/momentum) is determined by the track curvature in the magnetic fields. The identification criteria are based on the number of hits recorded in the muon spectrometer and the significance of the rigidity measurement. The average identification efficiency is around 98 % as measured on data. Track isolation is defined for muon candidates similarly as for electron candidates, except that a larger cone size at low p
Tis used ( ∆R = min ( 0 . 3 , 10 GeV /p
µT
) ). The impact parameter requirements for the muons are | d
0|/σ
d0< 3 and |z
0sin (θ)| < 0 . 5 mm. Only candidates with |η | < 2 . 5 and p
T> 10 GeV are considered. As for the electrons, a tight and a loose selection are considered. Loose muons are subject only to the identification requirements, while tight muons must also pass the track isolation requirement. The efficiency of the isolation requirement varies between 93 % and 100 % depending on the momentum of the muon.
Jets are reconstructed from calibrated topological clusters built from energy deposits in the calorimet- ers [50] using the anti- k
talgorithm [51] with a cone parameter R = 0 . 4. The jet calibration is based on simulation with additional corrections obtained using in-situ techniques [52] to account for differences between simulation and data. Jet candidates are required to have p
T> 25 GeV and |η| < 2 . 5. To reject jets arising from pileup collisions, an additional criterion using the Jet Vertex Tagger (JVT) [53] discriminant is applied for jets with p
T< 60 GeV and |η| < 2 . 4. The selected JVT working point provides an average efficiency of 92 % for hard-scatter jets and a rejection factor of 99 % for pileup jets.
Jets containing b -hadrons are identified ( b -tagged) using a multivariate discriminant combining informa- tion from algorithms using secondary vertices reconstructed within the jet and track impact parameters [54, 55]. The b -tagging efficiency is 77 % with a purity of 95 % at the chosen working point, for jets con- taining b -hadrons in simulated dileptonic t¯ t events. The b -tagged jets will be referred to as b -jets in the following.
The missing transverse momentum E
missT
, defined as the magnitude of the negative vector sum of all
selected objects, is reconstructed [56] using calibrated electrons, muons and jets as defined above. In
order to account for energy not associated to electrons, muons or jet, an additional soft term is built, using
tracks coming from the primary vertex and not associated to any reconstructed object. This term contains
contributions from the hard scattering as well as the underlying event and pileup interactions.
To avoid double counting of the same objects under different categories, an overlap removal algorithm is applied. The loose electron and muon definitions are used. First, electrons sharing a track with any muon are removed. Second, any jet within ∆R
y= p
(∆ y)
2+ (∆ φ)
2< 0 . 2 of an electron is removed ( y indicates the rapidity). Third, electrons within ∆R
y< 0 . 4 of any remaining jets are removed. Next, jets with less than three associated tracks and within ∆R
y< 0 . 2 of a muon are removed. Finally, muons within ∆R
y< 0 . 4 of remaining jets are removed.
5 Event selection and reconstruction
Only events having a primary vertex as defined above, and selected by a single-electron or single-muon trigger are accepted. Multiple triggers are used: the lowest-threshold triggers utilise isolation requirements to reduce the trigger rate, and have p
Tthresholds of 20 GeV for muons and 24 GeV for electrons in 2015 data, or 26 GeV for both lepton types in 2016 and 2017 data. These triggers are complemented by others with higher p
Tthresholds and no isolation requirements, in order to increase event acceptance.
In order to be considered, events have to contain exactly three tight leptons, and at least two jets, of which at most one b -tagged jet. The leading lepton p
Tis required to be larger than 27 GeV and at least one lepton with p
Tlarger than the trigger threshold has to be matched to a trigger. The sum of the lepton charges is required to be ± 1. To suppress background from Z bosons and hadrons that decay to leptons, events containing an opposite-sign same-flavour (OSSF) lepton pair with an invariant mass within 10 GeV of the Z boson mass (91.2 GeV) or below 15 GeV, are removed.
In the signal region, which is defined requiring the presence of at least one electron and one muon, a kinematic reconstruction is performed. The cLFV top candidate is built from the combination of the jet and opposite-sign different-flavour lepton pair whose invariant mass is closest to the top-quark mass. The jet with the highest b -tagging multivariate discriminant is excluded from the cLFV top-quark reconstruction, as the jet from the cLFV top-quark decay is not expected to originate from a b -quark. The remaining lepton and the missing transverse momentum are used to reconstruct the neutrino four-momentum imposing the W -mass constraint [57]. Finally, the previously excluded jet, the remaining lepton and the reconstructed neutrino are combined to form the SM-decaying top-quark candidate of the pair.
The leading background in the signal region is t t ¯ with an extra non-prompt lepton, which, together with Z + jets make roughly 60% of the total background. The W Z and Z Z production, in final states with three and four leptons respectively, constitute the largest prompt-lepton background (roughly 25% of the total background). Other relevant prompt-lepton backgrounds are, in order, t t Z ¯ , t¯ tW and t tH ¯ .
The non-prompt lepton background is estimated with a data-driven approach, because of its sensitivity to the details in the particles’ interactions with the detector material.
6 Non-prompt lepton estimation and validation regions
The non-prompt lepton background is modelled with a data-driven technique, called the matrix method [58].
The technique is based on a linear relation established between the unknown prompt or non-prompt nature
of the leptons and their observed isolation and identification quality. Using the loose lepton definition as
baseline, the identification and isolation quality for a given lepton can take two exclusive values: tight or
not-tight . The terms loose and tight refer to the lepton definitions introduced in Section 4. The matrix method is expressed analytically in Equation (3):
©
« N
TTN
TT¯N
TT¯N
T¯T¯ª
®
®
®
¬
= ©
«
rr r f f r f f
r ( 1 − r ) r( 1 − f ) f ( 1 − r ) f ( 1 − f ) ( 1 − r)r ( 1 − r ) f ( 1 − f )r ( 1 − f ) f ( 1 − r )( 1 − r ) ( 1 − r)( 1 − f ) ( 1 − f )( 1 − r) ( 1 − f )( 1 − f )
ª
®
®
®
¬
©
«
N
RRTT/rr N
RFTT/r f N
F RTT/ f r N
F FTT/ f f
ª
®
®
®
¬
. (3)
Only the second and third leading leptons are considered as, according to simulation, the leading lepton has a much lower probability to be non-prompt. The fraction of events in the signal region in which the leading lepton is non-prompt is less than 5%, as determined using simulated t¯ t events. The resulting bias is covered by a systematic uncertainty determined from studies on simulation. In Equation (3), the left-hand vector contains the number of events N with tight T and not-tight T ¯ leptons; the right-hand vector, instead, counts the number of events with two tight leptons ( TT ) which can be prompt ( R ) or non-prompt ( F ). The number of events with two tight leptons, of which at least one is non-prompt, is N
F= N
RFTT+ N
F RTT+ N
F FTT, which can be obtained by matrix inversion. The parameters r ( f ) in the matrix are called efficiencies and represent the probability of a loose prompt (non-prompt) lepton to be tight .
The r and f efficiencies are determined with a tag-and-probe approach, in dedicated dilepton regions, requiring at least two jets and at most one b -jet. In the dilepton regions, the leading lepton, used as tag, is required to be tight , while the sub-leading lepton is taken as probe. Probe leptons matched to a trigger with isolation requirements are vetoed, introducing, by consequence, the assumption that in the three-lepton regions the second or third leading leptons are not the only ones matched to such triggers. A systematic uncertainty, described in Section 8, is assigned to account for the fraction of events (10% in the signal region) not such assumption. The prompt efficiency r is extracted from simulated t t ¯ dilepton events in an opposite-sign (OS) dilepton selection. The non-prompt efficiency f is measured on data events in a same sign (SS) dilepton selection. Both, r and f are parameterised according to the lepton kinematic quantities:
p
Tand |η| for the electrons, and p
Tfor the muons.
Since the non-prompt efficiencies f are measured in data, the contamination from processes yielding two prompt SS leptons, estimated from simulation, is subtracted prior to the efficiency computation. Likewise, the number of events subject to electron charge mis-reconstruction are estimated from data and subtracted.
The electron charge-flip contamination is estimated by reweighing events selected in a region where all the requirements match the SS dilepton selection except for the lepton charges requirement, which is reversed.
The reweighing is based on the charge mis-reconstruction rate, measured in data by means of a maximum likelihood fit in the Z boson resonance, and parameterised on the electron p
Tand |η| .
The total expected background in a given region is obtained by combining the data-driven non-prompt lepton background prediction with simulated events containing three prompt leptons in the region’s acceptance. The prompt nature of the leptons in the simulated events is determined on the basis of the generator information.
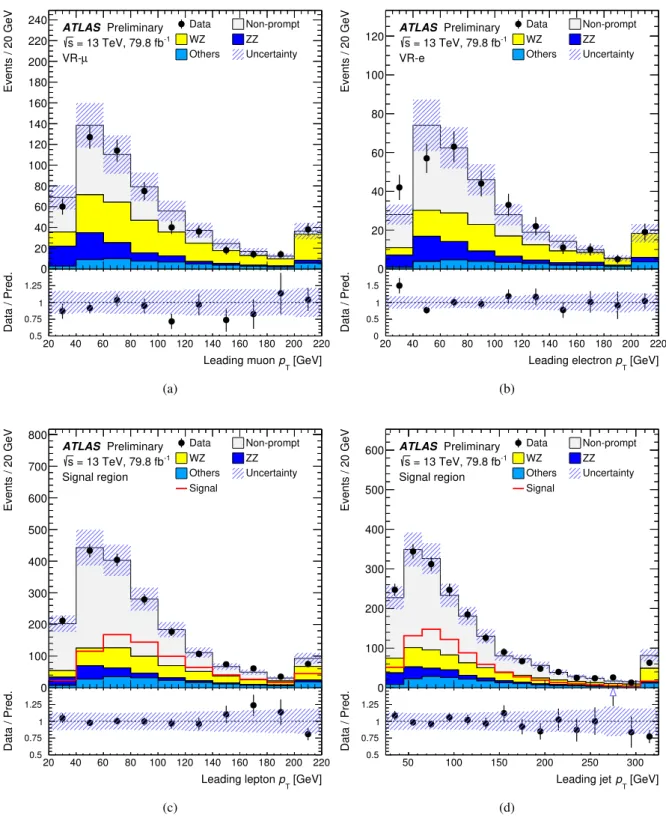
The background modelling is checked in two validation regions sharing the same requirements of the signal
region but having a different lepton flavour composition. The validation region VR- e consists of events with
exactly three electrons, while VR- µ consists of events with three muons. Figure 1 displays the background
modelling in the validation regions and in the signal region. The expected signal contamination (using
B(t → ``
0q) = 3 × 10
−4) in each validation region is less than 4 % in terms of signal over background.
[GeV]
pT
Leading muon
20 40 60 80 100 120 140 160 180 200 220
Data / Pred.
0.5 0.75 1 1.25
Events / 20 GeV
0 20 40 60 80 100 120 140 160 180 200 220
240 ATLAS Preliminary = 13 TeV, 79.8 fb-1
s µ VR- Pre-Fit
Data Non-prompt
WZ ZZ
Others Uncertainty
(a)
[GeV]
pT
Leading electron
20 40 60 80 100 120 140 160 180 200 220
Data / Pred.
0 0.5 1 1.5
Events / 20 GeV
0 20 40 60 80 100
120 ATLAS Preliminary = 13 TeV, 79.8 fb-1
s VR-e Pre-Fit
Data Non-prompt
WZ ZZ
Others Uncertainty
(b)
[GeV]
pT
Leading lepton
20 40 60 80 100 120 140 160 180 200 220
Data / Pred.
0.5 0.75 1 1.25
Events / 20 GeV
0 100 200 300 400 500 600 700 800
ATLAS Preliminary = 13 TeV, 79.8 fb-1
s
Signal region Pre-Fit
Data Non-prompt
WZ ZZ
Others Uncertainty Signal
(c)
[GeV]
pT
Leading jet
50 100 150 200 250 300
Data / Pred.
0.5 0.75 1 1.25
Events / 20 GeV
0 100 200 300 400 500
600 ATLAS Preliminary = 13 TeV, 79.8 fb-1
s
Signal region Pre-Fit
Data Non-prompt
WZ ZZ
Others Uncertainty Signal
(d)
Figure 1: Distributions of the leading lepton p
Tin the validation regions (a) VR- µ and (b) VR- e , and of the (c)
leading lepton and (d) leading jet p
Tin the signal region. In all cases the non-prompt lepton background is provided
by the data-driven estimation. All the backgrounds (filled histograms) are normalised to their prediction, while the
signal (overlaid line) normalisation corresponds to B(t → ``
0q) = 3 × 10
−4. Data (black points) are compared to
the sum of backgrounds in the upper panel, while the ratio is shown in the lower panel. All sources of systematic
uncertainty (described in Section 8) are included. The first and last bins in each distribution include the under- and
overflows, respectively.
7 Multivariate analysis
In the signal region, a multivariate discriminant, namely a boosted decision tree (BDT) [59], is trained on simulated events using the set of thirteen variables listed in Table 2. No advantages in terms of discrimination were found in training the BDT using the data-driven non-prompt lepton background.
The TMVA [59] implementation of the BDT is used. The BDT consists of one thousand trees with a maximum depth of three. The boosting is performed according to the AdaBoost [60] algorithm. The 2-fold cross-validation technique is applied: the signal and background datasets are split into two sets and two BDTs are defined. Then one BDT is trained on the first set and validated on the second, while opposite is the case for the second BDT. The BDT discriminant is able to provide a signal/background separation four times larger than the most discriminant variable. The separation is quantified analytically: given a variable x and the corresponding normalised distributions S(x) and B(x) for the signal and background respectively, the separation is proportional to the integral over x of (S( x) − B(x))
2. The separation is zero for identical signal and background shapes, and it is one for shapes with no overlap [59].
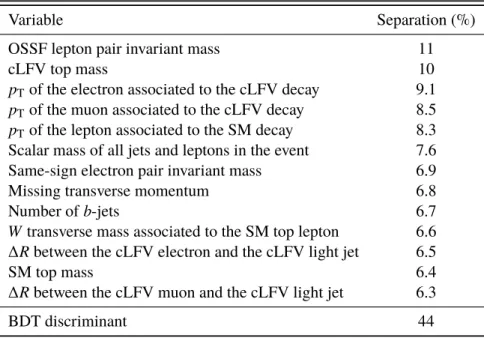
Table 2: Variables used in the multivariate analysis, sorted according to the method-specific ranking.
Variable Separation (%)
OSSF lepton pair invariant mass 11
cLFV top mass 10
p
Tof the electron associated to the cLFV decay 9.1 p
Tof the muon associated to the cLFV decay 8.5 p
Tof the lepton associated to the SM decay 8.3 Scalar mass of all jets and leptons in the event 7.6 Same-sign electron pair invariant mass 6.9
Missing transverse momentum 6.8
Number of b -jets 6.7
W transverse mass associated to the SM top lepton 6.6
∆R between the cLFV electron and the cLFV light jet 6.5
SM top mass 6.4
∆R between the cLFV muon and the cLFV light jet 6.3
BDT discriminant 44
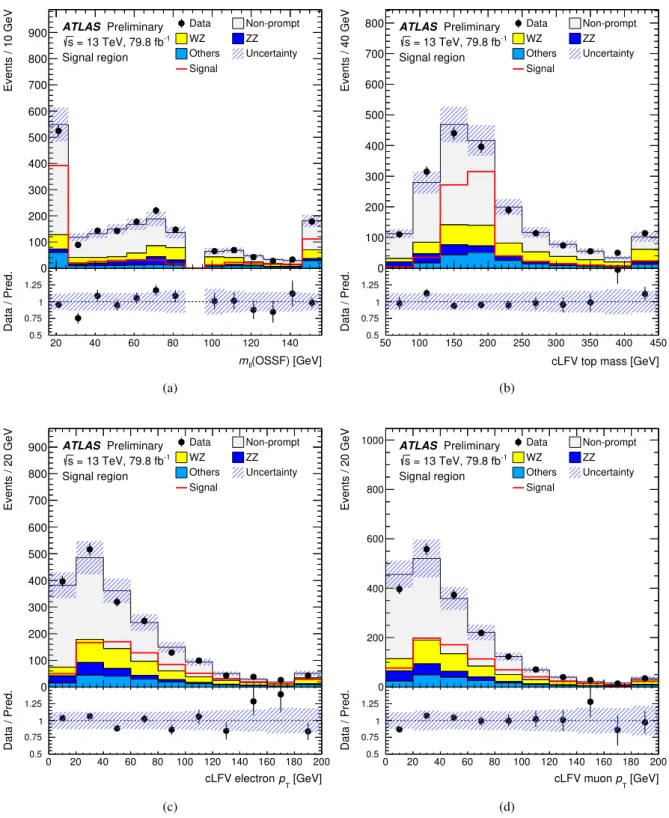
Figure 2 shows the four variables with the best separation: the invariant mass of the OSSF lepton pair
(set to zero if no such pair is present in the event), the reconstructed mass of the cLFV top-quark, and the
transverse momenta of the electrons and muons associated to the cLFV top-quark decay. The non-prompt
lepton background is modelled with the data-driven technique. Good agreement is observed between data
and expectation.
(OSSF) [GeV]
mll
20 40 60 80 100 120 140
Data / Pred.
0.5 0.75 1 1.25
Events / 10 GeV
0 100 200 300 400 500 600 700 800
900 ATLAS Preliminary = 13 TeV, 79.8 fb-1
s
Signal region Pre-Fit
Data Non-prompt
WZ ZZ
Others Uncertainty Signal
(a)
cLFV top mass [GeV]
50 100 150 200 250 300 350 400 450
Data / Pred.
0.5 0.75 1 1.25
Events / 40 GeV
0 100 200 300 400 500 600 700
800 ATLAS Preliminary = 13 TeV, 79.8 fb-1
s
Signal region Pre-Fit
Data Non-prompt
WZ ZZ
Others Uncertainty Signal
(b)
[GeV]
pT
cLFV electron
0 20 40 60 80 100 120 140 160 180 200
Data / Pred.
0.5 0.75 1 1.25
Events / 20 GeV
0 100 200 300 400 500 600 700 800
900 ATLAS Preliminary = 13 TeV, 79.8 fb-1
s
Signal region Pre-Fit
Data Non-prompt
WZ ZZ
Others Uncertainty Signal
(c)
[GeV]
pT
cLFV muon
0 20 40 60 80 100 120 140 160 180 200
Data / Pred.
0.5 0.75 1 1.25
Events / 20 GeV
0 200 400 600 800
1000 ATLAS Preliminary = 13 TeV, 79.8 fb-1
s
Signal region Pre-Fit
Data Non-prompt
WZ ZZ
Others Uncertainty Signal
(d)
Figure 2: Distributions of the four variables with the largest separation, entering the BDT in the signal region: (a)
the opposite-sign same-flavour dilepton invariant mass, set to zero when no opposite-sign same-flavour dilepton
pair is present, (b) the reconstructed mass of the cLFV top quark, the p
Tof (c) the electron and of (d) the muon
associated to the cLFV top quark. All the backgrounds (filled histograms) are normalised to their prediction, while
the signal (overlaid line) normalisation corresponds to B(t → ``
0q) = 3 × 10
−4. Data (black points) are compared
to the sum of backgrounds in the upper panel, while the ratio is shown in the lower panel. All sources of systematic
uncertainty (described in Section 8) are included. The first and last bins in each distribution include the under- and
overflows, respectively.
8 Systematic uncertainties
Several sources of uncertainty affect the measurement. They are related to the estimation of the data-driven non-prompt lepton background and to the prompt lepton background, estimated using simulation.
The uncertainties assigned to the non-prompt lepton background are listed in the following. For each set of uncertainties, the effect on the non-prompt lepton background normalisation is given in parenthesis.
Unless otherwise stated, each uncertainty includes both a normalisation and a shape component.
• Non-closure uncertainty (10 %). A 10 % normalisation uncertainty, determined from the results of a closure test performed on simulation, is included. The closure test consists in applying the matrix method entirely on simulation and quantifying the compatibility between the simulation prediction and method estimation in the signal region. Since the closure test revealed no significant shape mis-modelling in the BDT discriminant distribution, no shape uncertainty component has been included. The non-closure uncertainty is the only source of uncertainty related to the non-prompt lepton background without a shape component.
• Statistical uncertainties on the efficiencies (8.1 %). The statistical uncertainties on the efficien- cies are propagated analytically through the matrix inversion. This uncertainty also includes the simulation uncertainties accounted for in the computation of the prompt efficiencies.
• Trigger-matching assumption (6.5 %). The matrix method estimation is performed under the assumption that the second or third leading lepton should not be the only leptons matched to a trigger requiring isolation. The fraction of events not respecting this assumption ( ∼ 10 %) is subject to a 50 % systematic uncertainty, assigned on the basis of studies on simulated events.
• Variation of regions where the efficiencies are calculated (3.2 %). The electron efficiencies are computed in a same-sign dilepton region which includes both the ee and e µ flavour combinations.
The variations on the background prediction arising from using exclusively the ee or eµ selections are considered as two uncorrelated sources of uncertainty. The region variation has been introduced to cover the difference of the non-prompt electron composition in the dilepton region with respect to the signal region, where the matrix method is applied. The e µ and ee selections are, in fact, populated by t¯ t and Z + jets in different fractions, resulting in different proportions of non-prompt leptons originating from b -hadron decays and photon conversion. No similar variations is introduced for the muons, whose composition is more homogeneous due to the negligible photon conversion component.
• Prompt-lepton contamination uncertainty (2.6 %). In calculating the non-prompt efficiencies, the contamination from processes having prompt leptons ( W Z , Z Z , t¯ t Z , t tW ¯ ) is subtracted using the prediction from simulation. The cross section and modelling uncertainties are propagated to the matrix-method prediction.
• Statistical uncertainty (1.3 %). The statistical uncertainty on the data-driven prediction is con- sidered independently bin-by-bin as a systematic source of uncertainty. The uncertainty reaches 50 % in the last BDT bin.
• Alternative efficiency parameterisation (∼1 %). The matrix method efficiencies have been para-
meterised using an alternative set of variables ( p
Tand number of b -jets for the electrons, track
isolation over p
Tfor the muons) and the variation propagated to the estimation. For both the
electron and muon efficiencies the variation on the prediction is ∼ 1 % with non-negligible shape dependence.
• Charge-flip contamination uncertainty (0.3 %). Similarly to the prompt events subtraction, also the events in which the electron charge has been mis-reconstructed need to be subtracted. This contamination is estimated on data and its uncertainty is propagated through the matrix method.
The prompt-lepton background is affected by both, modelling and instrumental uncertainties. Modelling uncertainties on the leading prompt backgrounds are reported in the following.
• Cross-section uncertainty. A 6 % [61, 62] normalisation uncertainty, corresponding to the cross section uncertainty, is assigned to the diboson backgrounds W Z and Z Z . Similarly, a 11 % (13 %) [35] uncertainty is assigned to the t t Z ¯ ( t¯ tW ) contributions.
• Scale uncertainties. The uncertainties on the diboson and t tV ¯ acceptance due to the uncertainties in the renormalisation ( µ
R) and factorisation scales ( µ
F) are determined by comparing the nominal acceptance with that obtained when varying independently the scales up or down by a factor of 2 and 1/2. The largest variation ( µ
R) gives an acceptance uncertainty for the diboson processes of 15 %. Both the normalisation and shape components are considered.
• Modelling uncertainties. A normalisation and shape modelling uncertainty, obtained by comparing different generator predictions (Sherpa versus Powheg), is assigned to the W Z and Z Z processes.
The normalisation component amounts to 35 % for W Z and 33 % for Z Z . Acceptance uncertainties have also been assigned to the signal.
• Scale uncertainty. Factor 2 and 1 / 2 variations of the factorisation and renormalisation scale result in a
+2−4..6%5%uncertainty. Both, normalisation and shape components are considered. The shape uncertainty has been obtained comparing the BDT distribution variations with respect to the scale choice. The comparison is performed applying the BDT at particle level, i.e. on events in which the hard process, hadronisation and fragmentation are simulated but not the interaction with the detector.
• PDF uncertainty. A 2.5 % uncertainty derives from PDF variations. The uncertainty carries only a normalisation component as no shape variations have been observed. The variation has been determined using MSTW2008lo68cl [63] as alternative PDF set.
For both the estimated signal and simulated backgrounds, experimental uncertainties resulting from detector effects are considered, including the lepton reconstruction, identification and trigger efficiencies, as well as lepton momentum scales and resolutions [64–66]. Uncertainties of the E
missT
scale [67], pileup
effects, and jet energy scale and resolution [68, 69] are also considered. The b -tagging uncertainty
component, which includes the uncertainty of the b - and mistagged c - and light jet scale factors, is
evaluated by varying the scale factors applied to each jet, according to its flavour, in the simulated event
samples. The uncertainty related to the integrated luminosity for the dataset used in this analysis is
2.0 %, derived following the methodology described in [70]. The impact of the instrumental sources of
systematic uncertainties is small, amounting to a 2.2 % uncertainty on the background yield.
9 Results
The full BDT shape is used as input for a binned maximum-likelihood fit used to test for the presence of signal events. The fit is performed using the profile likelihood technique [71], where systematic uncertainties are encoded as nuisance parameters and are allowed to vary in the fit according to log- normal (for normalisation uncertainties) or Gaussian (for shape uncertainties) probability density penalty functions. For each systematic uncertainty, the components (shape or normalisation) corresponding to a negligible ( < 0.1%) background variation are dropped.
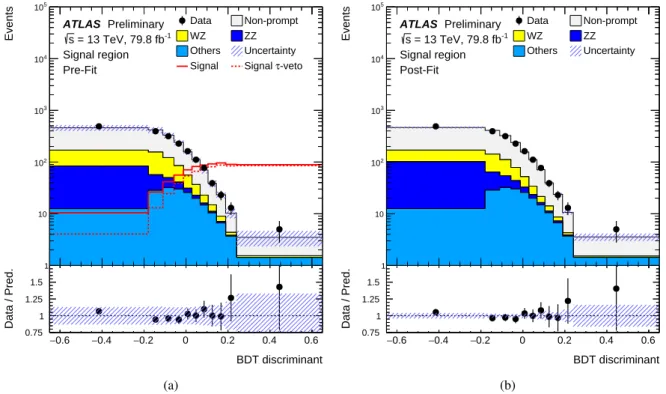
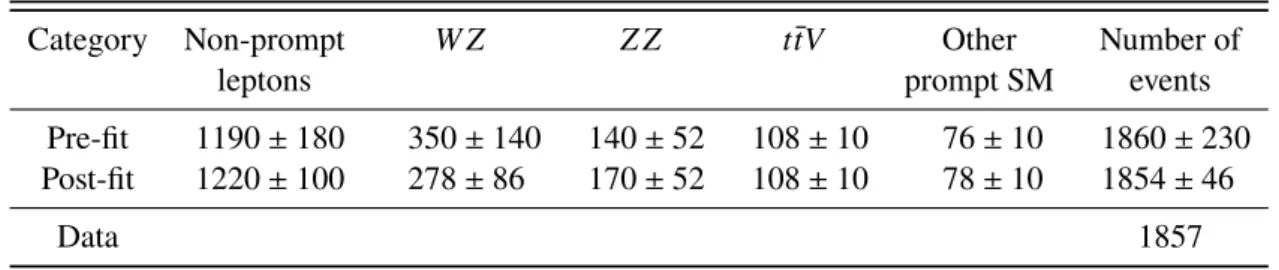
The data is found to be compatible with the absence of the signal. A background-only fit has been performed on data and is displayed in Figures 3 and 4 and in Table 3. The fit constrains the uncertainties on the background pulling slightly up the non-prompt lepton background, decreasing the W Z yield by 20 % and increasing the Z Z yield by 20 %. The amount of data in the last two bins of the BDT distribution is slightly larger than the prediction (by a factor 1 . 2 – 1 . 4 prior to the background-only fit), well within the uncertainties (0 . 90 σ significance).
BDT discriminant
−0.6 −0.4 −0.2 0 0.2 0.4 0.6
Data / Pred.
0.75 1 1.25 1.5
Events
1 10 102
103
104
105
ATLAS Preliminary = 13 TeV, 79.8 fb-1
s
Signal region Pre-Fit
Data Non-prompt
WZ ZZ
Others Uncertainty Signal Signal τ-veto
(a)
BDT discriminant
−0.6 −0.4 −0.2 0 0.2 0.4 0.6
Data / Pred.
0.75 1 1.25 1.5
Events
1 10 102
103
104
105
ATLAS Preliminary = 13 TeV, 79.8 fb-1
s
Signal region Post-Fit
Data Non-prompt
WZ ZZ
Others Uncertainty
(b)
Figure 3: (a) BDT discriminant distribution before the fit (pre-fit) with the signal including and excluding τ leptons
(Signal τ -veto) in the cLFV vertex overlaid. The signals are normalised according to Equation (2), with branching
ratios B(t → `
±`
0∓q) = 3 × 10
−4and B(t → eµq) = 1 × 10
−4. All sources of systematic uncertainty (described in
Section 8) are included. (b) BDT discriminant distribution after a background-only fit (post-fit). Data (black points)
are compared to the sum of backgrounds in the upper panel, while the ratio is shown in the lower panel.
(OSSF) [GeV]
mll
20 40 60 80 100 120 140
Data / Pred.
0.5 0.75 1 1.25
Events / 10 GeV
0 100 200 300 400 500 600 700 800
900 ATLAS Preliminary = 13 TeV, 79.8 fb-1
s
Signal region Post-Fit
Data Non-prompt
WZ ZZ
Others Uncertainty
(a)
cLFV top mass [GeV]
50 100 150 200 250 300 350 400 450
Data / Pred.
0.5 0.75 1 1.25
Events / 40 GeV
0 100 200 300 400 500 600 700
800 ATLAS Preliminary = 13 TeV, 79.8 fb-1
s
Signal region Post-Fit
Data Non-prompt
WZ ZZ
Others Uncertainty
(b)
[GeV]
T
p cLFV electron
0 20 40 60 80 100 120 140 160 180 200
Data / Pred.
0.5 0.75 1 1.25
Events / 20 GeV
0 100 200 300 400 500 600 700 800
900 ATLAS Preliminary = 13 TeV, 79.8 fb-1
s
Signal region Post-Fit
Data Non-prompt
WZ ZZ
Others Uncertainty
(c)
[GeV]
T
p cLFV muon
0 20 40 60 80 100 120 140 160 180 200
Data / Pred.
0.5 0.75 1 1.25
Events / 20 GeV
0 200 400 600 800
1000 ATLAS Preliminary = 13 TeV, 79.8 fb-1
s
Signal region Post-Fit
Data Non-prompt
WZ ZZ
Others Uncertainty
(d)
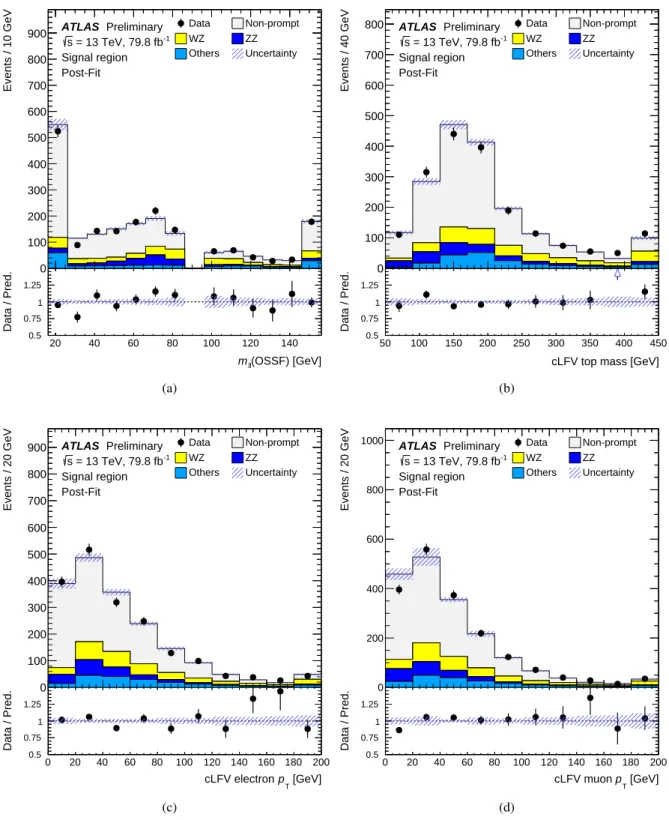
Figure 4: Distributions of the four variables with the largest separation, entering the BDT in the signal region, after
a background-only fit (post-fit): (a) the opposite-sign same-flavour dilepton invariant mass, set to zero when no
opposite-sign same-flavour dilepton pair is present, (b) the reconstructed mass of the cLFV top-quark, the p
Tof
(c) the electron and of (d) the muon associated to the cLFV top-quark. Data (black points) are compared to the
sum of backgrounds (filled histograms) in the upper panel, while the ratio is shown in the lower panel. All sources
of systematic uncertainty (described in Section 8) are provided as input to the fit. The first and last bins in each
distribution include the under- and overflows, respectively.
Table 3: Pre- and post-fit yields for the background-only fit in the signal region. The post-fit uncertainties account for correlations among the nuisance parameters.
Category Non-prompt W Z Z Z t¯ tV Other Number of
leptons prompt SM events
Pre-fit 1190 ± 180 350 ± 140 140 ± 52 108 ± 10 76 ± 10 1860 ± 230 Post-fit 1220 ± 100 278 ± 86 170 ± 52 108 ± 10 78 ± 10 1854 ± 46
Data 1857
In the absence of signal a 95 % confidence level upper limit on the branching fraction B(t → ``
0q) is set, using the C L
smethod [72]. The expected limit on the cLFV decay branching ratio is
B(t → ``
0q) < 1 . 36
+0−0..6137× 10
−5( expected ).
The observed exclusion limit is
B(t → ``
0q) < 1 . 86 × 10
−5( observed ).
The upper limit is recomputed removing all generated signal events where a τ lepton is present in the cLFV decay vertex. The potentially large contributions from EFT operators including τ leptons is therefore removed and only the prompt t → e µq decay is probed. The discarded signal events in the signal region amount to 17 % and, due to the softer lepton p
T, are concentrated around the central part of the BDT range. The signal BDT distribution after the τ -veto is shown in Figure 3.
Keeping the same fit setup, the expected and observed limits on the B(t → e µq) decay branching ratio are
B(t → e µq) < 4 . 8
+2−1..14× 10
−6( no τ in cLFV vertex, expected ), B(t → eµq) < 6 . 6 × 10
−6( no τ in cLFV vertex, observed ).
This first direct search for the process t → ``
0q improves the constraints on the t → eµq decay by roughly three orders of magnitude with respect to the previous indirect estimation of B(t → eµq) . 10
−3[19].
10 Conclusion
A search for charged lepton-flavour violation in top-quark decays is presented, using data collected from proton–proton collisions at the LHC at a centre-of-mass energy of
√ s = 13 TeV, corresponding to an
integrated luminosity of 79.8 fb
−1. This search targets the decay t(¯ t) → `
±`
0∓q(`
±`
0∓q) ¯ , with q = {u, c} ,
in top-quark pair events, where the second top quark of the pair decays semileptonically according to
the Standard Model. The final-state topology is thus characterised by the presence of three isolated
charged leptons, at least two jets, and missing transverse momentum from the undetected neutrino. No
evidence for a signal is found and an observed (expected) upper limit on the t → ``
0q branching ratio
of 1 . 86 ( 1 . 36 ) × 10
−5is set at the 95% confidence level. When considering only charged lepton-flavour
violating decays that do not involve τ leptons, the observed (expected) upper limit on t → e µq is found to
be 6 . 6 ( 4 . 8 ) × 10
−6.
References
[1] L. Calibbi and G. Signorelli,
Charged Lepton Flavour Violation: An Experimental and Theoretical Introduction , Riv. Nuovo Cim. 41 (2018) 1, arXiv: 1709.00294 [hep-ph] .
[2] I. Doršner, S. Fajfer, A. Greljo, J. F. Kamenik and N. Košnik,
Physics of leptoquarks in precision experiments and at particle colliders , Phys. Rept. 641 (2016) 1, arXiv: 1603.04993 [hep-ph] .
[3] H. Georgi and S. L. Glashow, Unity of All Elementary Particle Forces , Phys. Rev. Lett. 32 (1974) 438.
[4] H. Georgi, The State of the Art—Gauge Theories , AIP Conf. Proc. 23 (1975) 575.
[5] H. Fritzsch and P. Minkowski, Unified Interactions of Leptons and Hadrons , Annals Phys. 93 (1975) 193.
[6] S. M. Barr, A New Symmetry Breaking Pattern for SO(10) and Proton Decay , Phys. Lett. B 112 (1982) 219.
[7] A. De Rujula, H. Georgi and S. L. Glashow, Flavour goniometry by proton decay , Phys. Rev. Lett. 45 (1980) 413.
[8] J. P. Derendinger, J. E. Kim and D. V. Nanopoulos, Anti-SU(5) , Phys. Lett. B 139 (1984) 170.
[9] I. Antoniadis, J. R. Ellis, J. S. Hagelin and D. V. Nanopoulos,
Supersymmetric Flipped SU(5) Revitalized , Phys. Lett. B 194 (1987) 231.
[10] L. J. Hall and M. Suzuki, Explicit R-Parity Breaking in Supersymmetric Models , Nucl. Phys. B 231 (1984) 419.
[11] S. Dawson, R-Parity Breaking in Supersymmetric Theories , Nucl. Phys. B 261 (1985) 297.
[12] G. F. Giudice and R. Rattazzi, R-parity violation and unification , Phys. Lett. B 406 (1997) 321, arXiv: hep-ph/9704339 .
[13] C. Csaki, Y. Grossman and B. Heidenreich, MFV SUSY: A Natural Theory for R-Parity Violation , Phys. Rev. D 85 (2012) 095009, arXiv: 1111.1239 [hep-ph] .
[14] B. Bajc and L. Di Luzio, R-parity violation in SU(5) , JHEP 07 (2015) 123, arXiv: 1502.07968 [hep-ph] .
[15] E. Eichten, I. Hinchliffe, K. D. Lane and C. Quigg, Signatures for Technicolor , Phys. Rev. D 34 (1986) 1547.
[16] E. Farhi and L. Susskind, Technicolor , Phys. Rept. 74 (1981) 277.
[17] H. Georgi and S. L. Glashow, Unextended Technicolor and Unification , Phys. Rev. Lett. 47 (1981) 1511.
[18] M. Carpentier and S. Davidson, Constraints on two-lepton, two quark operators , Eur. Phys. J. C 70 (2010) 1071, arXiv: 1008.0280 [hep-ph] .
[19] S. Davidson, M. L. Mangano, S. Perries and V. Sordini,
Lepton Flavour Violating top decays at the LHC , Eur. Phys. J. C 75 (2015) 450,
arXiv: 1507.07163 [hep-ph] .
[20] A. Aktas et al. (H1 Collaboration),
Search for single top quark production in ep collisions at HERA , Eur. Phys. J. C 33 (2004) 9, arXiv: hep-ex/0310032 .
[21] F.D. Aaron et al. (H1 Collaboration), Search for Single Top Quark Production at HERA , Phys. Lett. B 678 (2009) 450, arXiv: 0904.3876 [hep-ex] .
[22] S. Chekanov et al. (ZEUS Collaboration),
Search for single top production in ep collisions at HERA , Phys. Lett. B 559 (2003) 153, arXiv: hep-ex/0302010 .
[23] ATLAS Collaboration, The ATLAS Experiment at the CERN Large Hadron Collider , JINST 3 (2008) S08003.
[24] ATLAS Collaboration, ATLAS Insertable B-Layer Technical Design Report , ATLAS-TDR-19, 2010, url: https://cds.cern.ch/record/1291633 ,
ATLAS Insertable B-Layer Technical Design Report Addendum , ATLAS-TDR-19-ADD-1, 2012,
URL