A TL-PHYS-PROC-2018-033 19 May 2018
MEASUREMENTS OF THE TOP QUARK MASS USING THE CMS AND ATLAS DETECTORS AT THE LHC
S. Menke, on behalf of the ATLAS and CMS Collaborations
Max-Planck-Institute f¨ ur Physik, F¨ ohringer Ring 6, 80805 M¨ unchen, Germany
Measurements of the top quark mass obtained by the ATLAS and CMS experiments in proton- proton collisions at the LHC for centre-of-mass energies of 7, 8 and 13 TeV are presented.
The mass of the top quark is measured using several methods and channels, including the reconstructed invariant mass distribution of the top quark and shapes of kinematic observables from top quark decay products. Measurements of the top-quark pole-mass based on the inclusive and differential t¯ t production cross sections and observables based on the differential cross section in the t¯ t + 1jet channel are also discussed.
1 Introduction
The top quark is by far the heaviest known fermion and the heaviest known fundamental particle.
This gives the top-quark mass a unique role in over-constraining Standard Model (SM) fits 1 and testing their validity in comparisons to direct mass measurements. Together with the mass of the Higgs boson the top-quark mass has consequences on the SM vacuum stability 2 .
Precision measurements of the top-quark mass are based on the “Run-1” datasets with integrated luminosities of about 5 fb −1 and 20 fb −1 for both LHC experiments, ATLAS 3 and CMS 4 , at 7 and 8 TeV, respectively. For “Run-2” both experiments have collected ∼ 85 fb −1 by now at √
s = 13 TeV and results from CMS with the first 35.9 fb −1 are already available. The statistical and systematic uncertainties on the top-quark mass reach levels well below 1 GeV – with smaller uncertainties reached at 8 TeV due to the increased statistics.
Direct measurement methods as discussed in section 2 lead currently to the smallest overall uncertainties but indirect methods as described in section 3 catch up in precision. For both the theoretical question, how exactly the measured top-quark mass can be interpreted, seems to converge to the same answer – that it can be identified with the top-quark pole mass. Exper- imentally, within uncertainties, direct and indirect measurements are giving consistent results, hence supporting this view 5 .
Copyright 2018 CERN for the benefit of the ATLAS and CMS Collaborations. Reproduction of this article
or parts of it is allowed as specified in the CC-BY-4.0 license
2 Direct top-quark mass measurements
A typical analysis leading to a direct top-quark mass measurement starts with the reconstruction of top-quark candidates in events matching the signature of pp → t¯ t both in data and simulated samples. Often with the aid of a kinematic fit improving the four-vectors of the decay products assuming the decay chain t → Wb followed by either leptonic (W → νl) or hadronic (W → qq 0 ) decay of the W-boson.
The top-quark mass is then obtained in likelihood fits in one (the top-quark mass m top ) or more (jet energy scale factors for light-quark and b-quark jets, the fraction of background events, ...) parameters of kinematic distributions in data to templates 6 or ideograms 7 from the simulation.
Templates are probability-density-functions constructed from full Monte Carlo simulations in the final observables (for example the reconstructed top-quark mass). For a variety of differ- ent top-quark-mass settings in the Monte Carlo and, optionally, variations in other quantities, like a systematic shift in the jet-energy scale (JES) or jet-energy-scale factor (JSF), templates are obtained for signal and background samples. Their shapes are parameterised and for the signal samples the shape parameters are expressed as polynomial in m top and the other varied quantities.
Ideograms extend the idea of templates by allowing multiple permutations per event – in the signal templates and in the final observable. The signal templates for the reconstructed top- quark mass can differ for example by the number of correct matches of the reconstructed decay products with generator-level partons and in each event all possible assignments of reconstructed objects to partons are used with a weight proportional to the goodness-of-fit probability (p g.o.f. ).
2.1 Lepton plus Jets Channel
Experimentally, t¯ t events with one of the W-bosons from top decay decaying leptonically (e or µ) and the other one to quarks offers the best compromise between low backgrounds (through the presence of an isolated high p ⊥ charged lepton), large statistics and kinematic constraints (only one neutrino escapes detection and can be accounted for with its transverse momentum through the measurement of the missing transverse momentum vector). Therefore, the lepton+jets channel leads typically to the lowest overall uncertainty on the top-quark mass. Beyond the requirements for the leptons the signature is completed by 4 central jets, where exactly two of them are identified as b-quarks. The reconstructed hadronic W-boson mass, m reco W , prior to the
[GeV]
reco
m
top130 140 150 160 170 180 190 200
Events / GeV
0 200 400 600 800 1000 1200
data, l+jets Best fit background Best fit
Uncertainty
ATLAS Preliminary
=8 TeV, 20.2 fb
-1s
[GeV]
fit
m
t100 200 300 400
Data/MC 0.5
1 1.5
Permutations / 5 GeV 10000
20000 30000 40000 50000 60000 70000 80000
correct t t
wrong t t
unmatched t
t Data
Single t W+jets Z+jets QCD multijet Diboson
(13 TeV) 35.9 fb
-1CMS Preliminary
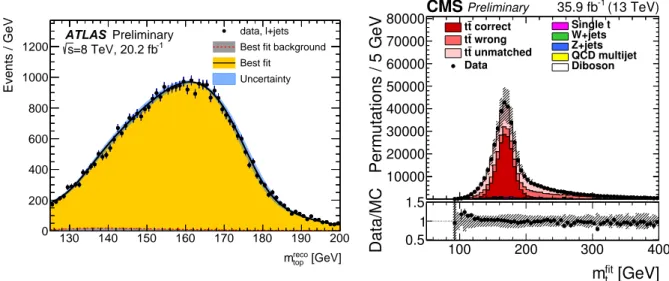
Figure 1 – The reconstructed top-quark mass. Overlaid is the template fit for ATLAS
8on the left and the
ideogram fit for CMS
9on the right.
adjustments of the four-vectors of the jets, is sensitive to the jet energy scale and is used as one of the templated observables. The reconstructed top-quark mass, m reco top in ATLAS 8 , and m fit t in CMS 9 , after the kinematic fit, is the main templated observable (see Fig. 1).
ATLAS uses in addition a template in R reco bq , the ratio of transverse momenta of b-tagged over light jets prior to the kinematic fit, which gives a handle on the b-jet energy scale bJSF.
For the most recent ATLAS analysis at 8 TeV 8 an optimisation procedure led to a set of 13 input variables for a boosted-decision-tree (BDT) analysis to improve the event selection. The three with the largest separation power are the log Likelihood of the kinematic fit, the distance
∆R qq between the two light jets and the transverse momentum of the hadronic W-boson. The final template fit to one-dimensional distributions in the three observables mentioned above for the permutation with the highest BDT output leads to the result m top = 172.08 ± 0.39 stat ± 0.82 sys (0.54 JES ⊕0.38 bTag ⊕ 0.32 Model ⊕ ...) GeV. All modelling and theory-related uncertainties are combined here and for other quoted direct mass measurements in σ Model , which together with jet-energy and flavour-tagging uncertainties accounts for the dominant part of systematic uncertainty.
CMS’ most recent analysis in this channel 9 is one of the first at 13 TeV employing simul- taneous ideogram fits in up to two observables (m reco W and m fit t ) where both are weighted with p g.o.f. . Compared to the 1D fit in just the top-quark mass and the full 2D fit in m top and JSF the best precision is achieved in the hybrid approach, where the 2D fit is augmented by a Gaussian prior in JSF based on jet energy correction (JEC) constraints: m top = 172.25 ± 0.08 stat+JSF ± 0.62 sys (0.41 Flavor ⊕0.41 Model ⊕0.19 JEC ⊕...) GeV. The use of modern generators for this analysis which contain next-to-leading order (NLO) effects in the top-quark decay are an important step to unite the theoretical view of direct and indirect top-quark mass measurements.
2.2 Di-Lepton Channel
Requiring exactly two isolated oppositely charged leptons (except taus) in addition to two cen- tral jets, where at least one of them carries a b-tag, describes the base selection for the di-lepton channel, in which both W-bosons decay leptonically. This channel features the smallest back- ground among all top-pair channels but suffers from two neutrinos escaping detection. The two most recent analyses for ATLAS 10 and CMS 11 are performed at 8 TeV. For same flavour leptons large missing transverse momentum requirements and di-lepton invariant mass vetoes protect against resonance decays to lepton pairs. Templates in the invariant mass of one of the leptons and one of the b-jets (in case only one jet is b-tagged, the one with the highest b-tag weight is taken as second b-jet), m reco `b , are used to fit the top-quark mass.
ATLAS takes the permutation of lepton-b-jet pairings with the lowest average m `b . An opti- misation procedure on the expected uncertainty of the fitted top-quark mass led to a restriction on the combined lepton-b-jet transverse momentum, p ⊥,`b > 120 GeV, and a fiducial range for the templates of 30 GeV < m reco `b < 170 GeV. The fit of m top and the background fraction as free parameters yields: m top = 172.99 ± 0.41 stat ± 0.74 sys (0.54 JES ⊕ 0.35 Model ⊕ 0.30 bJES ⊕ ...) GeV, presently the result with the lowest overall uncertainty from ATLAS.
CMS employs two matching routes. The first is selecting for each b-jet the lepton that gives
the smallest m `b and the second is selecting for each lepton the b-jet that gives the smallest
m `b . This leads to either two or three different m `b , bound by the same kinematic endpoint
as the correct pairings and thus improves the statistical precision. In addition to templates
in m `b CMS also uses templates in a “stransverse” mass, m bb T2 , which treats both W-bosons
as invisible. The third templated observable is m b`ν , the invariant mass of all three decay
products of each top-quark, where the neutrino four-vectors are inferred from a minimisation
procedure on another “stransverse” mass, m `` T2 , treating the neutrinos as invisible. 1D and
2D fits in m top (1D) or m top , JSF (2D) to m b` and m bb T2 are performed and compared to an
alternative 1D fit in m top to m bb T2 and m b`ν . The best precision is expected from a hybrid
approach with 80% weight given to the regular 1D fit and 20% to the 2D fit, and yields: m top =
172.22 ± 0.18 stat +0.89 −0.93
sys ( +0.62 −0.65
Model ⊕ +0.43 −0.46
JES ⊕ 0.40 b-frag ⊕ ...) GeV.
2.3 Full-Hadronic Channel
Top-quark-pair events, where both W-bosons decay hadronically, exhibit a fully resolved final state, allowing for a direct mass measurement without inferred momenta. However, since the event selection for this full-hadronic channel involves 6 jets and no leptons, analyses suffer from the large QCD multijet background. The use of b-tags, and kinematic constraints (either via topological cuts on the jets (ATLAS) or via cut on p g.o.f. of a kinematic fit (CMS)) reduces the overwhelming background significantly. Still, data-driven methods are needed to estimate shape and amount of the remaining background. The latest results are based on the 8 TeV datasets for ATLAS 12 and CMS 13 .
ATLAS obtains from a template fit of the top-quark mass to the 3-jet to 2-jet mass ratio, R 3/2 ≡ m jjj /m jj : m top = 173.72 ± 0.55 stat ± 1.01 sys (0.69 Model ⊕ 0.60 JES ⊕ 0.34 bJES ⊕ ...) GeV.
R 3/2 reduces the impact of JES significantly without the need to construct templates in a second observable.
For CMS the hybrid fit in m top and JSF to ideograms in m fit t and m reco W offers as for the other direct measurements the best result on the top-quark mass for this channel: m top = 172.32 ± 0.25 stat + JSF ± 0.59 sys (0.41 Flavor JSF ⊕ 0.35 Model ⊕ 0.26 JES ⊕ ...) GeV.
3 Indirect top-quark mass measurements
Indirect top-quark mass measurements complement the direct measurements by reversing the analysis chain: Instead of fits of simulated templates or ideograms, which reflect the parton level
“folded” with the detector response, to data distributions, the indirect method is to unfold the data to hadron or parton level and compare the unfolded distributions with QCD predictions with m pole top as parameter. The advantage is a better control over the scheme in which the top-quark mass is defined but the price to pay are larger uncertainties connected with the unfolding of the data and, due to the indirect dependency, potentially less sensitivity to the top-quark mass. An example for the latter is the top-pair-production cross section. The ratio of next-to-next-to leading order (NNLO) to NLO predictions for the same mass differ by O(10%).
At the same time a 5% uncertainty in the cross-section corresponds to a 1% uncertainty in the top-quark mass only 14 – i.e. without the large dependency on neglected higher orders for the normalisation, indirect measurements would be very competitive. Also, cross-sections need absolute normalisations from the experimental side giving rise to yet another uncertainty on the top-quark mass from the luminosity measurements. The way out are observables that are differential in nature and thus not sensitive to overall normalisations.
3.1 Top-Quark Pair plus Jet Channel
One of the above mentioned observables is constructed from the differential cross section in t¯ t + 1jet events 15 : R(m pole top , ρ s ) = 1
σ t¯ t+1 jet
dσ t¯ t+1 jet
dρ s (m pole top , ρ s ), with ρ s = √ 2m 0
s t¯ tj , twice the ratio of an arbitrary mass scale m 0 in the vicinity of m top over the invariant t¯ t + 1jet mass. The latest ATLAS 16 result is based on the 7 TeV dataset with a lepton+jets selection for the top-quark pair, while for CMS 17 the most recent result has been obtained at 8 TeV in the di-lepton channel for the top-quark pair.
The event selection proceeds along the same criteria as for the corresponding t¯ t analysis for
the top-quark candidates. The leading unused jet is combined with the top-quark candidates
to reconstruct ρ s . The distribution in ρ s is unfolded and compared to NLO calculations with
parton showering. m pole top is extracted from χ 2 -fits to theory with regularised covariance matrices
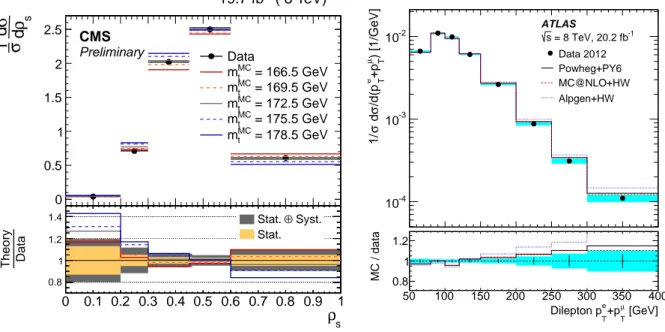
in the unfolded ρ s ∈ [0.25, 1] (ATLAS) and ρ s ∈ [0.2, 1] (CMS, see Fig. 2 left), leaving out
the lowest bin (starting at 0) which is fully correlated to the others due to the normalisation:
m pole, ATLAS
top = 173.7 ± 1.5 stat +1.0 −0.5 theo ± 1.4 sys (0.9 JES+bJES ⊕ 0.7 ISR/FSR ⊕ 0.5 PDF ⊕ ...) GeV, m pole, CMS top = 169.9 ± 1.1 stat +3.6 −1.6
theo +2.5
−3.1 sys ( +1.0 −2.8
Scale
−0.1
+1.6 Jet-Parton Match ⊕ 1.0 Bkgd ⊕ ...) GeV.
The lepton+jets channel offers currently the smaller theoretical and systematic uncertainties, partially due to the better constrained ρ s with only one neutrino escaping detection.
3.2 Lepton plus Jets Channel
The total t¯ t production cross section in the first 2.2 fb −1 at 13 TeV in the lepton+jets channel has been used by CMS 18 to extract the top-quark pole mass. Events are selected in 11 different categories according to the total number of jets and the number of b-tagged jets among them in addition to the base selection of an isolated central electron or muon and at least one central jet.
The total number of events is used in event categories with 0 b-tags, while m b` (or the smallest m b` in events with more than one b-tag) is used in the event categories with at least one b-tag.
The cross section is measured to: σ t¯ t (13 TeV) = 888 ± 2 stat +28 −26
syst ± 20 lumi pb, which translates to a top-quark pole mass in NNLO of: m pole top = 170.6 ± 2.7( −2.2 +2.5
fid. fit ⊕ −0.9 +1.1
PDF ,µ
R/F,α
S⊕
−0.7
+1.1 extrapol. ⊕ ...) GeV. The dominant uncertainty in the top-quark mass extraction stems from the modelling of the fiducial region of the fit.
3.3 Di-Lepton Channel
ATLAS 19 obtained 8 differential distributions from events selected with oppositely charged di-lepton (eµ) final states with exactly 1 or 2 b-tagged jets at 8 TeV. Five of the differential distributions in p ` ⊥ , p eµ ⊥ , m eµ , p e ⊥ + p µ ⊥ and E e + E µ are sensitive to m pole top (see Fig. 2 right).
And among these the three p ⊥ -based ones have the highest sensitivity. Three other differential
s ρ d σ
d 1 σ
0 0.5 1 1.5 2 2.5
( 8 TeV) 19.7 fb
-1CMS
Preliminary Data
= 166.5 GeV
MC
m
t= 169.5 GeV
MC
m
t= 172.5 GeV
MC
m
t= 175.5 GeV
MC
m
t= 178.5 GeV
MC
m
tρ
s0 0.1 0.2 0.3 0.4 0.5 0.6 0.7 0.8 0.9 1
Data Theory
0.8 1 1.2
1.4
Stat. ⊕ Syst.
Stat.
50 100 150 200 250 300 350 400
) [1/GeV]
µ T+p
e T/d(p σ d σ 1/
10
-410
-310
-2ATLAS
= 8 TeV, 20.2 fb-1
s
Data 2012 Powheg+PY6 MC@NLO+HW Alpgen+HW
[GeV]
µ