ATLAS-CONF-2014-055 30September2014
ATLAS NOTE
ATLAS-CONF-2014-055
September 28, 2014
Measurement of the top quark mass in topologies enhanced with single top quarks produced in the t-channel
at √
s = 8 TeV using the ATLAS experiment
The ATLAS Collaboration
Abstract
This note presents a measurement of the top quark mass in topologies enhanced with single top quarks produced in the t-channel via weak interaction produced via weak in- teractions. The dataset was collected at a centre-of-mass energy of
√s
=8 TeV with the ATLAS detector at the LHC and corresponds to an integrated luminosity of 20.3 fb
−1. Se- lected events contain one lepton, missing transverse momentum, and two jets, one of which is b-tagged. The top quark processes are further enhanced using a neural network-based discriminant. To determine the top quark mass, a template method is used, based on the distribution of the invariant mass of the lepton and the b-tagged jet as estimator. The result of the measurement is m
top =172.2
±0.7(stat.)
±2.0(syst.) GeV.
c Copyright 2014 CERN for the benefit of the ATLAS Collaboration.
Reproduction of this article or parts of it is allowed as specified in the CC-BY-3.0 license.
1 Introduction
The top quark distinguishes itself from other elementary particles via its large mass which is a fundamen- tal parameter of the Standard Model. Since its discovery in 1995 at the Tevatron [1, 2], various properties of the top quark have been measured, the most precisely measured quantity being the top quark mass m
top.
The recent world combination of measurements performed by the CDF and DØ experiments at the Tevatron and the ATLAS and CMS experiments at the LHC yields m
top =173.34
±0.27 (stat.)
±0.71 (syst.) GeV [3]. In all measurements considered in the world combination as well as in the pre- sented analyses, the analyses are calibrated to the Monte Carlo (MC) top quark mass definition. It is expected that the difference between the MC mass definition and the formal pole mass of the top quark is up to the order of 1 GeV (see Refs. [4–6] and references therein). The most precise measurements have been performed based on top quark pairs (t¯t) in the t¯t
→lepton+jets decay channel, where one of the W-bosons from the t¯t pair decays into a charged lepton and a neutrino, and the other W-boson decays into a quark-antiquark pair. The t¯t
→dilepton decay channel, where both W-bosons decay into a charged lep- ton and the corresponding (anti-)neutrino and the t¯t
→all-hadronic decay channel, where both W-bosons decay into a quark and an antiquark, also give significant contributions to the world average.
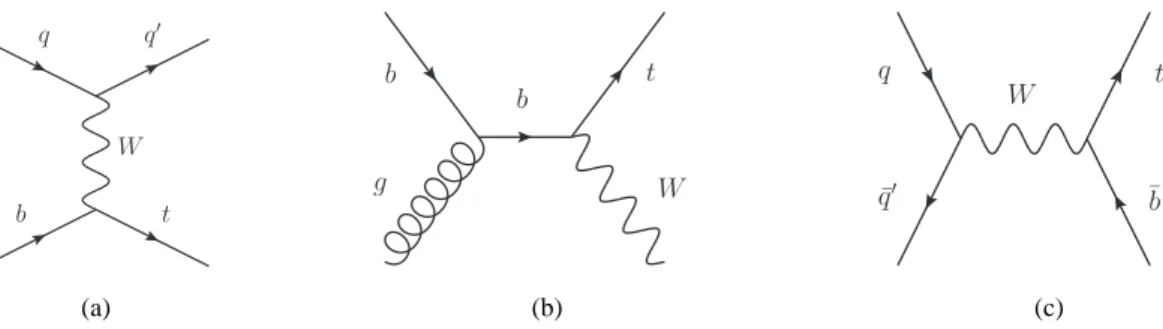
In contrast to the t¯t pair production via the strong interaction, in proton-proton (pp) collisions at the LHC, top quarks can also be produced singly via the weak charged-current interactions, giving another possibility for measuring the top quark mass. The dominant process for single top quark production is the t-channel exchange of a virtual W-boson depicted in Figure 1(a). Considering the leptonic decay of the W-boson from the top quark decay, there is only one b-jet in the final state. Thus the top quark can be reconstructed reconstructed with less ambiguities in the jet-parton assignment, and thereby less combinatorial background, which worsens the mass resolution. However, the lower jet multiplicity of the final state corresponds to a higher background rate yielding an overall lower signal to background ratio. Another important difference comes from the production mode. Due to the t-channel exchange of a W-boson, there is only a color connection between the top quark and the proton, from which the inital b-quark is coming, and not to the whole event like in t¯t production. Finally, the typical energy scale Q
2of single top production is much smaller than typical scales of the pair production. These differences, resulting different sizes of certain systematic uncertainties, and the fact that the measurement of the top quark mass is obtained from a statistically independent sample, provide excellent motivation for such a measurement and for including it in future combinations with other measurements.
q q′
W
b t
(a)
W
b t
g
b
(b)
q
q¯′
W
¯b t
(c)
Figure 1: Feynman diagrams of single top quark production processes: (a) t-channel production, (b) associated Wt production, and (c) s-channel production.
Single top quark production via the t-channel has been measured at the LHC by the ATLAS and CMS collaborations [7, 8] at
√s
=8 TeV and the production cross-section was found to be consistent
with the predictions at approximate next-to-next-to-leading order (NNLO),
σt =87.8
+3.4−1.9pb [9]. The
two sub-leading processes are Wt production, shown in Figure 1(b), measured for the first time at the
LHC [10, 11], and the Drell-Yan type s-channel production, observed at the Tevatron [12], shown in Figure 1(c). The predicted cross sections at approximate NNLO for Wt associated production are
σWt=22.4
±1.5 pb [13] and for the s-channel
σs=5.6
±0.2 pb [14] at
√s
=8 TeV. All quoted cross sections are given for m
top =172.5 GeV.
In this note, a first measurement of m
topin topologies enhanced with t-channel single top quark pro- duction is presented. Production of top quark pairs also gives a significant contribution to the sample, while Wt production and s-channel production only give minor contributions. The invariant mass of the charged lepton and the b-tagged jet, m(ℓb), is employed as an estimator for m
topusing the template method [15]. Events are characterised by an isolated high-p
Tcharged lepton (electron or muon), miss- ing transverse momentum from the neutrino and exactly two jets, produced by the hadronisation of the b-quark and the light quark in the t-channel. Events with a W-boson decaying into a
τ-lepton, wherethe
τdecays into an electron or a muon, are also included. The main backgrounds are W/Z+jets produc- tion, especially in association with heavy quarks, diboson production, and multijet production via QCD processes. Events from all single top production processes and t¯t production are treated as signal in the analysis.
This note is organised as follows: after a short description of the ATLAS detector in Section 2, the data and Monte Carlo (MC) simulated samples are discussed in Section 3. The event selection is presented in Section 4, and the background estimates are discussed in Section 5. The classification of events into signal- and background-like events using a neural network is discussed in Section 6. In Section 7 the m(ℓb) variable used as the mass estimator is introduced and a general description of the template method is given. Sources of systematic uncertainties are summarised in Section 8. The results are given in Section 9, and a summary and conclusions are given in Section 10. Details about the components of the jet energy scale uncertainty are separately summarised in the Appendix.
2 The ATLAS Detector
The ATLAS detector [16] at the LHC consists of an inner tracking detector surrounded by a thin su- perconducting solenoid, electromagnetic and hadronic calorimeters, and an external muon spectrometer incorporating three large superconducting toroid magnet assemblies. The inner-detector system is im- mersed in a 2 T axial magnetic field and provides charged particle tracking in the range
|η|<2.5
1. The high-granularity silicon pixel detector covers the vertex region and provides typically three measurements per track. It is followed by the silicon microstrip tracker which provides measurements from four double strip layers. These silicon detectors are complemented by the transition radiation tracker, which enables extended track reconstruction up to
|η| =2.0. By providing typically more than 30 straw-tube mea- surements per track, the transition radiation tracker improves the inner detector momentum resolution, and also provides electron identification information. The calorimeter system covers the pseudorapidity range
|η| <4.9. Within the region
|η| <3.2, electromagnetic calorimetry is provided by barrel and end cap lead/liquid argon (LAr) electromagnetic calorimeters, with an additional thin LAr presampler cover- ing
|η|<1.8 to correct for energy loss in material upstream of the calorimeters. Hadronic calorimetry is provided by a steel/scintillating-tile calorimeter, segmented into three barrel structures within
|η| <1.7, and two copper/LAr hadronic endcap calorimeters. The solid angle coverage is completed with forward copper/LAr and tungsten/LAr calorimeter modules optimised for electromagnetic and hadronic mea- surements, respectively. The muon spectrometer comprises separate trigger and high-precision tracking
1ATLAS uses a right-handed coordinate system with its origin at the nominal interaction point (IP) in the centre of the detector and the z-axis along the beam pipe. The x-axis points from the IP to the centre of the LHC ring, and they-axis points upward. Cylindrical coordinates (r, ϕ) are used in the transverse plane,ϕbeing the azimuthal angle around the beam pipe. The pseudorapidity is defined in terms of the polar angleϑasη=−ln tan(ϑ/2). Transverse momentum and energy are defined as pT =p sinϑand ET =E sinϑ, respectively.
chambers measuring the deflection of muons in a toroidal magnetic field. The precision chamber system covers the region
|η| <2.7 with three layers of monitored drift tubes, complemented by cathode strip chambers in the forward region. The muon trigger system covers the range
|η|<2.4 with resistive plate chambers in the barrel, and thin gap chambers in the endcap regions. A three-level trigger system is used. The first level trigger is implemented as a part of the detector hardware and uses a subset of de- tector information to reduce the event rate to a design value of at most 75 kHz. This is followed by two software-based trigger levels, which together reduce the event rate to about 300 Hz.
3 Data and Monte Carlo Samples
This analysis is performed using pp collision data recorded at a centre-of-mass energy of
√s
=8 TeV by the ATLAS experiment in 2012. Only the periods in which all the sub-detectors were fully operational are considered, resulting in a data sample corresponding to an integrated luminosity of
L =20.3 fb
−1. The mean number of interactions per bunch crossing for this dataset is about 21.
Detector and trigger simulations are performed within the GEANT4 framework [17, 18]. The same offline reconstruction methods used for data events are applied to the simulated samples. Minimum bias events generated by P
ythia8 [19] are used to simulate multiple pp interactions in the same and nearby bunch crossings, corresponding to the LHC operation with 50 ns bunch separation and an average of 18 additional pp interactions per bunch crossing. All simulated samples are reweighted to match the number of interactions per bunch crossing found in data.
All top quark processes, apart from the mass variation samples, are produced with an assumed top quark mass of 172.5 GeV. Electroweak t-channel single top quark events are simulated using the A
c-
erMC generator [20] and the leading order (LO) parton density functions (PDFs) CTEQ6L1 [21]. A
c-
erMC includes two t-channel subprocesses: qb
→q
′t and qg
→q
′t ¯b, including the decay of the top quark. Events generated according to the 2
→2 and 2
→3 processes are combined into one consistent sample based on an implementation of the ACOT matching prescription [22] to avoid kinematic over- laps. The factorisation and renormalisation scales,
µfand
µrare set to
µr=µf =m
top. Since A
cerMC is a LO generator the complete decay chain can be generated, preserving all spin correlations. The parton shower and the underlying event are simulated using P
ythia6 [23] with the CTEQ6L1 PDF sets and the corresponding Perugia 2011C tune [24].
The P
owheg-
boxNLO generator [25, 26] is used as a second generator for t-channel events in order to assess systematic uncertainties. Events are generated either in the four-flavour schema [27] using the CT104f [28] PDF sets, or in the five-flavour scheme [29] using the CT10 PDF sets. In the first case, the renormalisation and factorisation scales are calculated event-by-event with
µr= µf =4
q
m
2b+p
2T,b, where m
band p
T,bare the mass and p
Tof the b-quark of the initial gluon splitting, and in the second case
µr = µf =m
topis used. In both cases the parton shower and the underlying event are simulated using P
ythia6 with the CTEQ6L1 PDF sets and the corresponding Perugia 2011C tune. The top quarks produced at matrix element (ME) level are decayed using M
adS
pin[30] preserving all spin correlations.
The P
owheg-
boxgenerator with the CT10 PDF set is used to generate t¯t, Wt and s-channel single
top quark events. The parton shower and the underlying event are added using P
ythia6 and the Peru-
gia2011C tune. For systematic studies of the t¯t, t-channel, Wt and s-channel single top quark processes
the same events are interfaced to the H
erwig(v6.520) [31] and J
immy(v4.31) [32] generators with the
ATLAS AUET2 tune [33]. Initial and final state radiation (ISR/FSR) effects in t¯t events are studied
with the A
cerMC generator interfaced to P
ythia6 for hadronisation. Under this scheme, ISR and FSR
can be adjusted separately via variation of 1/Λ
IS RQCD, the coherence imposed on the first emission in the
(space-like) parton shower, the
ΛFS RQCDscale and the FSR parton shower cut-off. To address systematic un-
certainties related to non-perturbative QCD in t¯t and t-channel single top quark processes three P
owheg+
P
ythia6 samples containing exactly the same matrix element events but different parton shower tunes, explained in Section 8, are used.
In addition to the simulated samples mentioned, t¯t and single top quark production samples are generated using six values of m
topin 2.5 GeV intervals from 165 GeV to 180 GeV with the same setup as for the central sample. For t-channel single top quark production events are generated with A
cerMC and for all other processes, namely s-channel, Wt production, and t¯t production, P
owheg+P
ythia6 is used.
Dedicated generators are used to model the W- and Z-boson background. In order to generate ex- clusive processes of the same order in perturbation theory for different jet multiplicities, processes with a different number of additional partons are merged together. For this analysis S
herpa(v.1.4.1) is used to generate the hard process, the parton shower and hadronisation, and the underlying event, with the CT10 PDF set. S
herpauses the CKKW method [34] to remove overlaps between the n and n
+1 parton samples. The removal of double counting between the inclusive W
+n parton samples and samples with associated heavy-flavour quark pair production (W/Z+HF) is done consistently by using massive c- and b-quarks in the shower.
Finally, diboson events (WW, WZ and ZZ) are simulated using the H
erwig(v6.520) and J
immy(v4.31) generators with the ATLAS AUET2 tune.
4 Event Selection
Based on the expected signature of the signal, events are selected with exactly one isolated electron or muon, missing transverse momentum and exactly two jets, out of which one is required to be identified as a b-quark jet. Events are considered only if they are accepted by a single-lepton trigger [35]. Two single- electron triggers are employed, with thresholds of transverse energy E
T >24 GeV for isolated electrons or E
T >60 GeV with no isolation criteria, and two single-muon triggers at transverse momentum p
T >24 GeV with or p
T >36 GeV without isolation criteria. Offline electron candidates are defined as clusters of cells in the electromagnetic calorimeter associated with a well-measured track fulfilling several quality requirements [36]. Electron candidates are required to satisfy p
T >25 GeV and
|ηclus|<2.47, where
ηclusis the pseudorapidity of the cluster of calorimeter cells. A veto is placed on electron candidates in the calorimeter barrel-endcap transition region, 1.37
< |ηclus| <1.52. High-p
Telectrons associated with the W-boson decay can be mimicked by hadronic jets, or non-isolated lepton from heavy flavour hadron decay which passes all the selection cuts, including isolation. These backgrounds can be suppressed by isolation criteria which require minimal calorimeter activity and only low-p
Ttracks in an
η-φcone around the electron candidate. Isolation cuts optimised to achieve a uniform isolation efficiency as a function of pseudorapidity and transverse energy are applied to the electron candidates. For the calorimeter isolation a cone size of
∆R = p(∆η)
2+(∆φ)
2 =0.2 is used. In addition, the scalar sum of the p
Tof all tracks within a cone of radius
∆R =0.3 around the electron direction, excluding the track belonging to the electron, is restricted to be below an E
T-dependent threshold.
Muon candidates are reconstructed by matching track segments or complete tracks in the muon spec- trometer with inner detector tracks [37]. The final candidates are required to have p
T>25 GeV and to be in the region of
|η|<2.5. Isolation criteria are applied to reduce background events in which a high-p
Tmuon is produced in the decay of a heavy flavour quark. An isolation with variable cone size [38] is defined as the scalar sum of the p
Tfrom all tracks with p
Tabove 1 GeV (except the one matched to the muon) within a cone of radius R
iso=10 GeV/p
T(µ). Muon candidates are accepted only if they have an isolation of less than 5% of the muon p
T.
Jets are reconstructed using the anti-k
talgorithm [39] with a distance parameter of 0.4, starting
from calorimeter energy clusters calibrated using the local cluster weighting method [40], and corrected
for the effects of pile-up as described in [41]. Jets are calibrated using an energy- and
η-dependentsimulation-based calibration scheme, with in-situ corrections based on data [42], and required to satisfy
p
T >30 GeV and
|η| <4.5. Jets within 2.75
<|η|<3.5, which have significant energy deposited in the endcap-forward calorimeter transition region, must have p
T>35 GeV.
If any jet falls within
∆R <0.2 of a reconstructed electron the jet is removed. Remaining electron candidates overlapping with jets within
∆R<0.4 are rejected. To reject jets from pile-up events, a jet- vertex fraction criterion [41] is applied, where at least 50% of the scalar sum of the p
Tof tracks matched to a jet is required to be from tracks compatible with the primary vertex
2associated to the hard-scattering collision. This criterion is only applied to jets with p
T <50 GeV and
|η|<2.4.
One of the selected jets is required to have p
T>30 GeV and be identified (b-tagged) as a b-quark jet.
The tagging algorithm exploits the properties of a b-quark decay in a jet using neural network techniques and the reconstruction of secondary vertices [43]. The b- and c-tagging efficiencies, and the mis-tag rate for the taggers, are measured using the same methods as described in [44,45] and updated using the 2012 dataset [46, 47]. The b-tagging algorithm has an efficiency of 50% for b-jets in simulated t¯t events, while 0.1% of the light quark jets and 3.7% of the c-quark jets are mis-tagged as b-quark jets.
The magnitude of the missing transverse momentum vector is defined as E
missT = ~p
missT, where
~
p
missTis calculated using the calibrated jets, together with either the calibrated calorimeter energy cluster associated with an electron or the p
Tof a muon track [48]. Energy deposited in calorimeter cells but not associated with any high-p
Tobject is also included in the E
Tmisscalculation. Due to the presence of a neutrino in the final state of the signal process, candidate events must have E
Tmiss >30 GeV. In order to reduce the number of multijet background events, which are characterised by low E
missTand low transverse W-boson mass
3m
T(W), the event selection requires m
T(W)
>50 GeV. Another class of multijet background events entering the selection are events where the selected lepton has low p
Tand is opposite to one of the jets in the transverse plane. These events are further reduced by applying an additional cut, which is realised by the following condition between the lepton p
Tand the
∆φ( j
1, ℓ):p
T(ℓ)
>40 GeV 1
− π− |∆φ( j
1, ℓ)| π−1
!
,
(1)
where
ℓdenotes the identified charged lepton and j
1the reconstructed jet with the highest p
T.
Two kinematical regions are defined in this analysis, both being subject to the same event selection requiring exactly one lepton, missing transverse momentum from the neutrino and exactly two jets, of which one is a b-tagged jet:
•
In the signal region (SR) the default b-tagging requirement is used and exactly one of the two selected jets is required to be b-tagged.
•
In the W-boson control region (CR) exactly one b-tagged jet is selected, but with a less stringent b-tagging requirement with a b-tagging efficiency of 80%. Events contained in the SR are rejected.
The control region is defined such that the composition of the resulting sample is dominated by W+jets production and the remaining signal contamination is about 2.5%. The same object defi- nitions can be used as in the signal region in order to check the modelling of kinematic variables.
2The primary vertex associated with the hard scatter is defined as the vertex with the largestP
p2Tof the associated tracks.
3The transverse W-boson mass is defined as: mT(W)= q
2h
pT(ℓ)EmissT −~pT(ℓ)·~pmissT i
, where~pT(ℓ) denotes the transverse momentum of the lepton and pT(ℓ)=
~pT(ℓ) .
5 Background Estimation
All background processes, except multijet production, are normalised to the theoretical cross-section predictions. The calculations of the cross-sections and their uncertainties follow the procedure explained in [49].
Multijet events may be selected if a jet is misidentified as an isolated lepton or if the event contains a non-prompt lepton from a heavy flavour hadron decay which passes all the selection cuts, including isolation. To determine the normalisation of the multijets background, a binned maximum likelihood fit to a variable sensitive to this background is performed. Template distributions for the multijet backgroud are obtained by different methods in the electron and muon channel, correspondingly.
In the electron channel a jet-lepton model [49] is obtained by selecting simulated multijet events, generated using P
ythia6, with jets that have similar properties to selected electrons. Each jet has to fulfil the same p
Tand
ηrequirements as a signal lepton, contain at least four tracks, and deposit 80-95% of its energy in the electromagnetic calorimeter. The simulated event is accepted if exactly one ‘jet-lepton’ is found.
In the muon channel, an anti-muon method [49] is used, which builds a multijet model derived from collision data. In order to select a sample that is highly enriched with muons from multijet events, some of the muon identification cuts are inverted or changed, for example the usual muon ID cut on z
0(the longitudinal impact parameter) is omitted, and the isolation criteria are inverted.
A binned maximum likelihood fit is then performed to the E
Tmissdistribution in data after applying all selection criteria, with the cut on E
missTremoved. In the electron channel, fits are performed separately for electron candidates in the endcap (
|η| >1.5) and central (
|η| <1.5) regions of the electromagnetic calorimeter. The multijet template is fitted together with templates derived from MC simulation for all other processes whose rate uncertainties are accounted for in the fitting process in the form of additional constrained nuisance parameters [49]. For the purpose of these fits the contributions from W
+light jetsand W
+HF+jets (W+jets), the contributions from t¯t and single top quark production, and the contribu-tions from Z+jets and diboson production, are each joined into one template. Based on comparisons of the rates obtained by using alternative methods, a systematic uncertainty of 50% on the estimated multijet contributions is assigned. The alternative methods comprise the matrix method [50], interchanging the models used for electrons with the ones used for muons and vice versa, and choosing different variables, i.e. m
T(W) instead of E
Tmiss, for the binned maximum-likelihood fit. A shape uncertainty is obtained by comparing the shapes of the jet-lepton model, the anti-muon model and shapes obtained with the matrix methods.
The corresponding E
missTdistributions after rescaling the different backgrounds and the multijet tem- plate to their respective fit results are shown in [49] for both the electron and muon channel.
6 Neural Network Selection
Following the event selection described in Section 4, the selected sample is still dominated by back- ground processes. Multivariate analysis techniques are used to separate signal from background candi- dates. A neural network classifier [51] that combines a three-layer feed-forward neural network with a preprocessing of the input variables is used to enhance the separation power. In order to improve the per- formance and to avoid overtraining, Bayesian regularisation is implemented during the training process.
The network infrastructure consists of one input node for each of the 12 input variables plus one bias
node, 15 nodes in the hidden layer, and one output node which gives a continuous output in the interval
[0, 1]. The training is done using single top t-channel events as signal during the training and W
+jets,Z+jets and diboson processes are considered as background. To enhance the fraction of top quark pro-
cesses in the signal region, the t¯t process is not included in the training. Extensive studies were done to
Table 1: Variables used as input to the neural network ordered by their importance, as estimated from the total correlation loss to the target caused by the removal of each specific variable.
loss of total loss of total
Variable correlation (%) Variable correlation (%)
m(ℓνb) 38 E
Tmiss7
m( jb) 31 m
T(W) 7
m(ℓb) 18 cos
θ(ℓ,j) in the top quark rest frame 6
|η( j)|
14 p
T(W) 3
η(ℓν)
13
η(lνb)2
H
T(ℓ, jets, E
missT) 10
∆R(ℓ, ℓνb)1
b) [GeV]
ν m(l
100 150 200 250 300
Event fraction
0 0.1 0.2
t-channel , Wt, s-channel t
t W+jets 2 Jets SR electrons + muons
Preliminary
ATLAS Simulation
m(j b) [GeV]
0 50 100 150 200 250 300 350 400 450 500
Event fraction
0 0.1 0.2
t-channel , Wt, s-channel t
t W+jets 2 Jets SR electrons + muons
Preliminary
ATLAS Simulation
(a) (b)
Figure 2: Kinematic distributions of the two most significant variables in the signal region normalised to unit area for single-top t-channel and other processes: the invariant mass of the reconstructed top quark (a), invariant mass of the reconstructed light jet plus reconstructed b-tagged jet (b).
ensure that using a signal sample with a fixed top quark mass does not bias the result of the measurement.
Different discriminating variables including variables obtained from the reconstructed W-boson and the top quark are explored. To reconstruct the four-momentum of the W-boson, the neutrino four- momentum is derived from the measured
~p
missTbecause it cannot be measured directly. Given the lepton four-momentum, the neutrino longitudinal momentum, p
νz, is calculated by imposing a kinematic con- straint on the invariant mass of the W-boson, (p
W)
2=(p
ℓ+p
ν)
2=m
2W =(80.4 GeV)
2, where p
W, p
ℓand p
νare the four-momenta of the W-boson, charged lepton and neutrino, respectively. In case of a solution for which p
νzis real, the twofold ambiguity is resolved by choosing the smallest
|p
νz|solution, because the W-boson is expected to be produced with small pseudorapidity. In about 30% of the events the relation has imaginary solutions. In these cases, the value of E
Tmissis rescaled by a factor such that the imaginary part vanishes. The top quark candidate is reconstructed by adding the four-momentum of the b-tagged jet to the four-momentum of the reconstructed W-boson.
Variables are selected as inputs to the neural network such that for a minimal number of variables
the best possible separation between the signal and background processes is achieved. Each variable is
initially tested for agreement between the MC background model and observed data events in the control
region and, taking into account potential signal contributions, is also tested in the signal region. This
leads to 12 variables remaining for the network. Table 1 shows a summary of the variables ordered
Events / 10 GeV
0 20000 40000
DATA
uncertainty Multijets Z+jets, diboson W+HF+jets W+light jets
, Wt, s-channel t t t-channel 2 Jets W CR electrons + muonsPreliminary
∫
L dt = 20.3 fb-1 s=8TeV ATLASb) [GeV]
ν m(l
100 150 200 250 300 350
rel. difference
-0.4 -0.2 0 0.2 0.4
Events / 20 GeV
0 50000
DATA
uncertainty Multijets Z+jets, diboson W+HF+jets W+light jets
, Wt, s-channel t t t-channel 2 Jets W CR electrons + muonsPreliminary
∫
L dt = 20.3 fb-1 s=8TeV ATLASm(j b) [GeV]
0 50 100 150 200 250 300 350 400 450 500
rel. difference
-0.4 -0.2 0 0.2 0.4
(a) (b)
Events / 10 GeV
0 10000
20000 DATA
uncertainty Multijets Z+jets, diboson W+jets
, Wt, s-channel t t t-channel 2 Jets SR electrons + muonsPreliminary
∫
L dt = 20.3 fb-1 s=8TeV ATLASb) [GeV]
ν m(l
100 150 200 250 300 350
rel. difference
-0.4 -0.2 0 0.2 0.4
Events / 20 GeV
0 10000 20000 30000
DATA
uncertainty Multijets Z+jets, diboson W+jets
, Wt, s-channel t t t-channel 2 Jets SR electrons + muonsPreliminary
∫
L dt = 20.3 fb-1 s=8TeV ATLASm(j b) [GeV]
0 50 100 150 200 250 300 350 400 450 500
rel. difference
-0.4 -0.2 0 0.2 0.4
(c) (d)
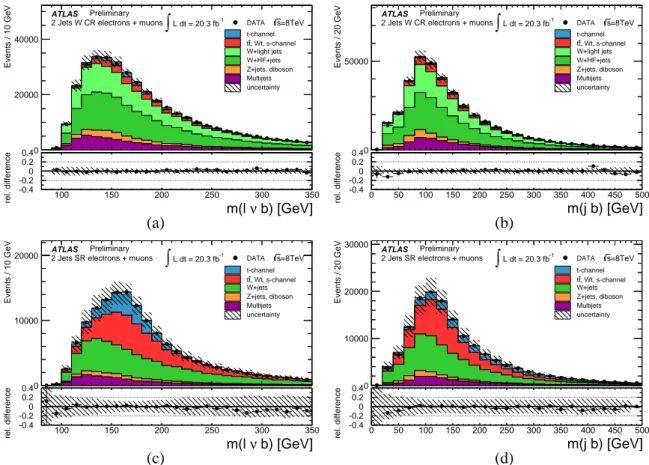
Figure 3: Simulated kinematic distributions of the two most significant variables in the construction of the neural network: the invariant mass of the reconstructed top quark (a, c), and the invariant mass of the reconstructed light-jet plus reconstructed b-tagged jet (b, d), shown in the control region (a, b) normalised to the result of the binned maximum likelihood fit used to determine the fraction of multijet events. The signal region shown in (c, d) is normalised to the number of expected events estimated in [49]. The relative difference (O
i−E
i)/E
ibetween the observed O
iand expected E
inumber of events in each bin i is shown in the lower histogram. The hatched bands indicate the statistical uncertainty from the simulated samples size and the systematic uncertainty on the multijet normalisation in the control region (a, b) and the statistical and W
+jets normalisation uncertainties in the signal region in (c,d). Thecombined electron and muon channel is shown.
by their importance, where the importance of the variables is estimated using an iterative procedure after their preprocessing. In this step the correlation matrix of the input variables is computed and their significance is determined by removing each single variable and calculating the loss of correlation between the obtained and the optimal output. The variable causing the smallest loss of correlation is discarded, after which the correlation matrix is computed again and the procedure is repeated on the remaining (n
−1)-dimensional correlation matrix. At the end, a list of variables, ordered in importance, is obtained, together with the fractional loss of total correlation to the target by the removal of each variable.
Figure 2 shows the shape distributions of the two most effective variables, namely the invariant
mass of the reconstructed top quark, m(ℓνb), and the invariant mass of the reconstructed light-jet plus
reconstructed b-tagged jet, m( jb), from simulation for the signal processes and W+jets, which is the
most important background process. Distributions of the corresponding variables are shown in Figure 3
NN output
0 0.1 0.2 0.3 0.4 0.5 0.6 0.7 0.8 0.9 1
rel. difference
-0.4 -0.2 0 0.2 0.4
Events / 0.05
0 50000
DATA
uncertainty Multijets Z+jets, diboson W+HF+jets W+jetst, Wt, s-channel t
t-channel 2 Jets W CR electrons + muons
Preliminary ATLAS
=8TeV s
L dt = 20.3 fb-1
∫
NN output
0 0.1 0.2 0.3 0.4 0.5 0.6 0.7 0.8 0.9 1
rel. difference
-0.4 -0.2 0 0.2 0.4
Events / 0.05
0 10000 20000
DATA
uncertainty Multijets Z+jets, diboson W+jetst, Wt, s-channel t
t-channel 2 Jets SR electrons + muons
Preliminary ATLAS
=8TeV s
L dt = 20.3 fb-1
∫
(a) (b)
Figure 4: (a) Neural network output distribution in the control region normalised to the result of the binned maximum likelihood fit used to determine the fraction of multijet events. (b) Neural network out- put distribution in the signal region normalised to the number of expected events estimated in [49]. The relative difference (O
i−E
i)/E
ibetween the observed O
iand expected E
inumber of events in each bin i is shown in the lower histogram. The hatched band indicates the statistical uncertainty from the simulated samples size, the systematic uncertainty on the relative top normalisation and the systematic uncertainty on the multijet normalisation in (a) and statistical uncertainty and on the W
+jets normalisation in (b).in the control and signal region. The distributions are normalised using the scale factors of the different processes obtained in the binned maximum likelihood fit to the E
missTdistribution. The resulting neural network output distributions for the various processes in the control region are shown in Figure 4(a), while in Figure 4(b) the same distribution in the signal region is shown. Signal-like events have output values close to one, whereas background-like events accumulate near zero. In [49] it was shown that the contribution from single-top t-channel production is slightly underestimated while the contribution from other top quark processes is slightly overestimated in simulation. The resulting scale factors, for the t-channel production of 1.07 and for the remaining top quark processes of 0.87, are taken into account in the top mass measurement. To enhance the signal sample with single top and t¯t events a cut on the neural network output variable larger than 0.75 is chosen. In the signal region 19833 events that fulfill this cut are observed in data while the expectation from SM backgrounds amounts to 19470
±2700 events.
The number of expected events is calculated using the acceptance from MC samples normalised to their respective theoretical cross sections. The uncertainties are defined by the corresponding uncertainty on the theoretical cross section or, in case of the multijet background, the uncertainty of the normalisation.
Table 2 summarises the event yields in the signal region and the selected subsample used to measure the
mass of the top quark for each of the processes considered. Since in both cases, a fit to data is performed,
the expected and observed yields agree well. After the full event selection the expected fraction of
non-top quark background is about 28% and the fraction of t¯t events is about 26%.
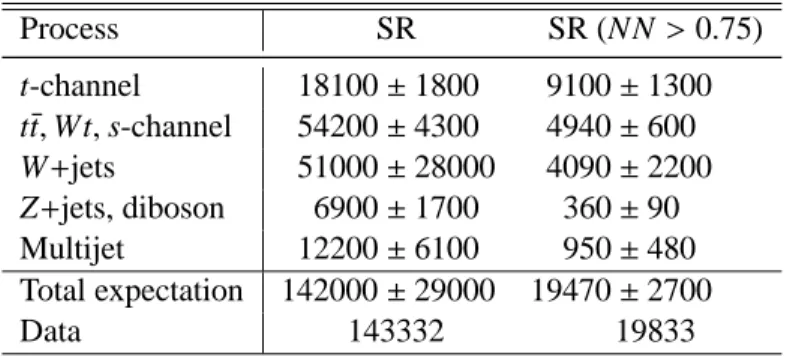
Table 2: Predicted and observed event yields for the signal region (SR), for all selected events and events that fulfill a cut on the neural network (NN) output variable larger than 0.75. The multijet background estimation is derived from collision data based as discussed in Section 5 and the quoted uncertainty is the total uncertainty, dominated by the systematic uncertainty assignment of 50%. In the signal region SR (NN
>0.75), the data driven correction factors for the top processes are applied as well as the cor- responding uncertainties. All the other expectations are derived using theoretical cross sections, and the corresponding uncertainties are theoretical. Since in both cases, a fit to data is performed, the expected and observed yields agree well.
Process SR SR (NN
>0.75)
t-channel 18100
±1800 9100
±1300 t¯t, Wt, s-channel 54200
±4300 4940
±600
W+jets 51000
±28000 4090
±2200
Z
+jets, diboson6900
±1700 360
±90
Multijet 12200
±6100 950
±480
Total expectation 142000
±29000 19470
±2700
Data 143332 19833
7 The Template Method
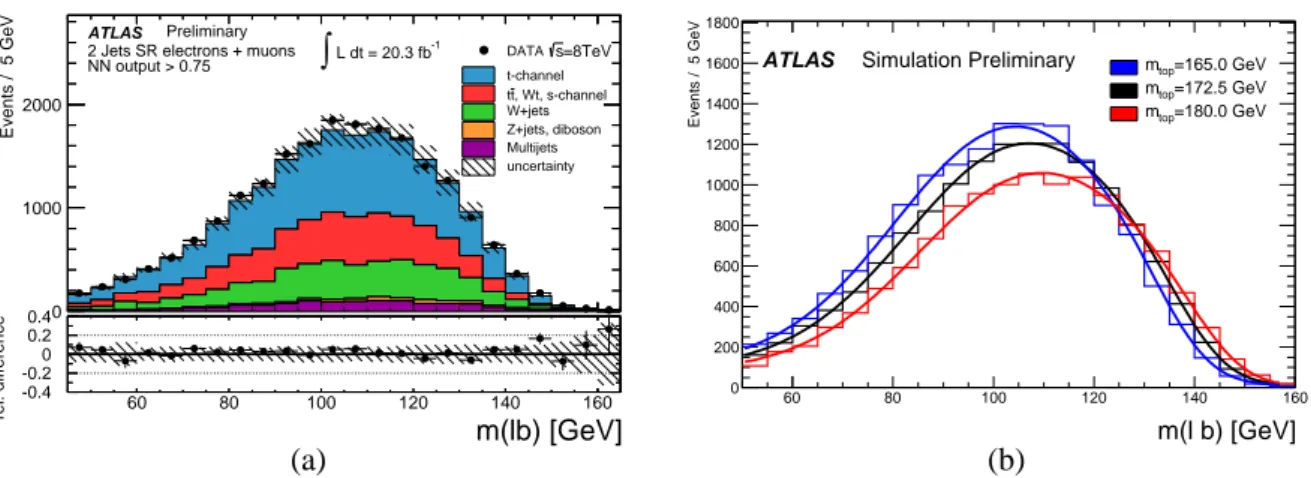
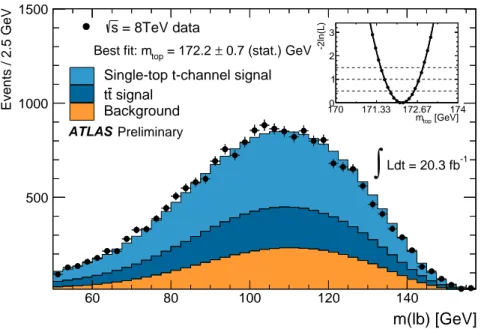
In order to measure the top quark mass in the signal region after the cut on the neural network, a template method is used. Simulated distributions are constructed for m(ℓb), which is sensitive to the top quark mass, using a number of discrete values of m
top. This m(ℓb) estimator is defined as the invariant mass of the charged lepton plus b-jet system. Selected events contain exactly one charged lepton and one b-tagged jet making the assignment unambiguous and leading to a good mass resolution of the chosen estimator. The resulting distribution in the signal region after the cut on the neural network output in data together with the prediction assuming m
top=172.5 GeV is shown in Figure 5(a).
The templates are parametrised and the parameters are then interpolated between different values of m
top. In Figure 5(b) the sensitivity of the m(ℓb) observable to the input value of the top quark mass is shown by the m(ℓb) distributions for three different mass points together with their respective fitted parametrisations. In the final step a likelihood fit to the observed data distribution is used to obtain the value of m
topthat best describes the data. In this procedure, the experimental distributions are con- structed such that they result in unbiased estimators of the top quark mass in the signal MC samples.
Consequently, the top quark mass determined in this way from data corresponds to the mass definition used in the MC.
Signal and background templates for m(ℓb) are constructed for top quark masses in the range 165-
180 GeV, using separate MC samples for each of the seven different mass points. All single-top and t¯t
processes are treated as signal and the signal templates for m(ℓb) are fitted using the sum of a Landau
and a Gaussian function. The same parametrisation is used for the mass-independent m(ℓb) distribution
of the background, which is dominated by W+jets and QCD-multijet production. The parameters of the
fitting function of m(ℓb) have an approximately linear dependence on m
topfor the signal, and probability
functions, s
i(m
top), for the m(ℓb) estimator depending only on m
topare built. These normalised templates
for the signal, s
i(m
top), and background, b
i, are used as the input to a binned maximum likelihood fit to
Events / 5 GeV
0 1000 2000
DATA
uncertainty Multijets Z+jets, diboson W+jets
, Wt, s-channel t t t-channel 2 Jets SR electrons + muons
NN output > 0.75Preliminary
∫
L dt = 20.3 fb-1 s=8TeV ATLASm(lb) [GeV]
60 80 100 120 140 160
rel. difference
-0.4 -0.2 0 0.2 0.4
m(l b) [GeV]
60 80 100 120 140 160
Events / 5 GeV
0 200 400 600 800 1000 1200 1400 1600 1800
ATLAS Simulation Preliminary mtop=165.0 GeV
=172.5 GeV mtop
=180.0 GeV mtop
(a) (b)
Figure 5: (a) Distributions of m(ℓb) in the signal region for events with an output value of the neural network larger than 0.75. The data are compared to the MC predictions for signal and background.
The signal MC processes assume m
top =172.5 GeV and the expected distribution is normalised to the number of expected events estimated in [49]. The hatched bands indicate the statistical uncertainty from the simulated sample size and the systematic uncertainty on the W+jets normalisation. (b) Dependence of the m(ℓb) distribution of all top quark processes on m
topfor the signal MC samples generated with different input top quark masses, together with the signal probability density functions obtained from the parametrisation described in Section 7. The processes are normalized to the expectation for 20.3 fb
−1.
the data with the following likelihood function:
L= Y
bins i
P
m(ℓb)
datai |λi(N, f, s
i(m
top), b
i)
·
G
f
|f
bkg, σfbkg
(2)
The likelihood has three parameters: the top quark mass m
top, the relative background fraction, f and the overall normalisation, N. f is constrained by a Gaussian distribution centred around the prediction from simulation, f
bkg. The width of the Gaussian,
σfbkg, reflects the theoretical uncertainty on the background fraction.
Using pseudo-experiments on large MC samples, a good linearity is found between the input top
quark mass and the mean value derived from the distributions of reconstructed top quark masses. The
pseudo-experiments are constructed by drawing N events from MC where N is taken from a Poisson
distribution of the number of expected events. Within their statistical uncertainties, the mean values and
widths of the pull distributions are consistent with the expectations of zero and one, respectively, for
all input top quark masses. Finally, the expected statistical uncertainty on m
topobtained from pseudo-
experiments for an input top quark mass of m
top =172.5 GeV, and for an integrated luminosity of
20.3 fb
−1, is 0.7 GeV.
8 Systematic Uncertainties
Systematic uncertainties are estimated by varying each source of uncertainty and determining the impact on the mass measurement via pseudo-experiments with the signal and background templates unchanged.
Wherever applicable the sources of uncertainty are varied by one standard deviation (
±1σ) with respect to their default values. The resulting average value of the fitted m
topin the pseudo-experiments
Dm
outtopEwith the upwards variation (+1σ) is compared with the corresponding downwards variation (
−1σ) and symmetrised. When only one variation is used to define the systematic uncertainty, the value of
Dm
outtopEis compared to the corresponding value without variation, and the difference is quoted as the systematic uncertainty. In all cases the actual observed difference is quoted as the systematic uncertainty on the corresponding source, even if it is smaller than the statistical precision of the difference, following [52].
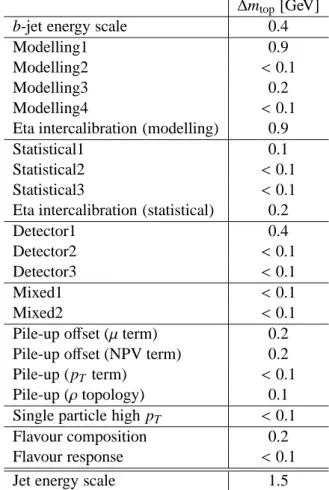
In the case of variations of the lepton or jet energy scales or energy resolution the missing transverse energy calculation is adjusted accordingly. The total uncertainty is calculated as the quadratic sum of the individual contributions, i.e. assuming them to be uncorrelated. The sources and systematic uncertainties investigated are listed in Table 3 and their evaluation is explained in the following.
Jet energy scale (JES):
The JES is a calibration to correct the jet energy measured in the calorimeters for energy loss in the inert material, particle leakage and signal inefficiency. The JES has been evaluated for the in-situ jet calibration [40, 42, 53], that uses Z+jet,
γ+jet, and di-jet pT-balance measurements in data. The JES uncertainty increases with
|η|and decreases with p
Tof the reconstructed jet. The uncertainty is evaluated in several different categories, a detailed description of which can be found in References [42, 53]. Additional contributions to this uncertainty due to the larger pile-up effects in 2012 data are included and range from less than 2% to 7% as a function of jet p
Tand
η. Due to differencesbetween light quark and gluon jets as opposed to jets containing b-hadrons, for b-quark induced jets an additional flavour-specific jet energy scale uncertainty of 0.8% to 2.5%, depending on the jet p
T, is added in quadrature to the JES uncertainty. The JES is independently varied for each of the uncertainty components by
±1σ with respect to the default value, depending on jet p
Tand
η. For each component,the m
topis obtained for the up and down variation with pseudo-experiments, and half the difference is taken as the uncertainty due to this JES component. Finally, to obtain the total uncertainty on m
topdue to the JES uncertainties, the 21 individual JES uncertainties are summed quadratically. The uncertainties for the individual components and their sum are given in Table 4 in the Appendix.
Jet energy resolution:
To assess the impact of this uncertainty, before performing the event selection, the energy of each reconstructed jet in the simulation is additionally smeared by a Gaussian function such that the width of the resulting Gaussian distribution corresponds to the one including the uncertainty on the jet energy resolution [54]. The difference in the
Dm
outtopEwith respect to the unsmeared case is taken as the uncertainty.
Other jet uncertainties:
The jet reconstruction efficiency was measured previously [55] and found to be fully efficient with negligible uncertainty for jets with p
T >30 GeV, a criterion satisfied by all jets used in this analysis. Thus, no dedicated systematic uncertainty for the reconstruction efficiency of jets is assigned. The effect of uncertainties associated with the jet vertex fraction is also considered for each jet.
Flavour-tagging efficiency and mis-tag rate:
Since the analyses makes use of b-tagging, the un-
certainties on the b- and c-tagging efficiencies and the mis-tag rate are taken into account. Correction
factors evaluated from collision data in dijet or t¯t events, are applied to correct the b-tagging performance
in simulated events to match the data. Both b-jets and c-jets in simulation use correction factors with
uncertainties that depend on the p
Tand
ηof the jet. The uncertainties on the correction factors vary from
10% to 20% for b- and c-quark jets [44, 46, 47], while for light jets the mis-tagging uncertainty ranges from 20% to 40% as a function of jet p
Tand
η[47].
Electron and muon uncertainties:
This category takes into account the uncertainties in the efficiency of the trigger, in the identification and reconstruction of electrons and muons, as well as residual uncer- tainties due to a possible miscalibration of the lepton energy scales. The uncertainties are estimated in measurements of different resonances (Z
0 →e
+e
−,J/ψ
→e
+e
−,Z
0→µ+µ−, J/ψ
→µ+µ−, Υ→µ+µ−) and E
/p studies with isolated electrons from W-boson decays [36, 37, 56]. The number quoted is thequadratic sum of all the individual components and is dominated by the uncertainty on the lepton energy scales.
Missing transverse momentum:
The impact of a possible miscalibration of the E
Tmissis assessed by changing the energy scale and resolution of the soft calorimeter energy deposits not included in the reconstructed jets and leptons within their uncertainties.
Monte Carlo generators:
Systematic effects from the modelling of the signal and background pro- cesses are taken into account by comparing different generator models and varying parameters of the event generation. The MC modelling of the t¯t process is studied by comparing two NLO generators interfaced to the H
erwigshower generator, namely MC@NLO [57]
+H
erwigand P
owheg+H
erwig. For the single top t-channel the choice of the generator and the scale is varied at once by comparing an A
cerMC
+P
ythia6 (scale: m
top, generator A
cerMC 2
→2 and 2
→3 ACOT matched [22]) sample and a P
owheg+P
ythia6 sample, described in Section 3. The modelling of the single top Wt-channel is studied by comparing a P
owheg+P
ythia6 and a MC@NLO
+H
erwigsample. In order to assess the uncertainty connected with the removal of the interference with the t¯t process P
owheg+Pythia6 samples using different separation schemes (diagram removal, default) and (diagram subtraction scheme) [58] are compared.
For the single top s-channel a sample generated with P
owheg+P
ythia6 and one with MC@NLO
+H
erwigare compared. For the t¯t processes the amount of initial (ISR) and final state radiation (FSR) was varied by modifying the parameters in samples generated with A
cerMC and interfaced to the P
ythia6 generator. The range of parameter variations was determined using collision data and is described in more detail in [59]. Since for the single top processes the variation due to ISR and FSR is already covered by the variations mentioned above no additional ISR and FSR variation is applied. Finally, the uncertainty due to the limited statistical size of the MC samples is also included.
Hadronisation and underlying event:
Effects of the parton shower modelling and hadronisation are evaluated by comparing P
owhegsamples interfaced to two different shower generators, H
erwigand P
ythia6. This is done independently for the single top t-channel production process and t¯t production.
The systematic uncertainties are referred to as t-channel and t¯t hadronisation. Additionally a system-
atic uncertainty directly connected with the underlying event is estimated using samples simulated with
P
owhegand P
ythia6 independently for the single top t-channel production and t¯t. The uncertainty is
obtained by comparing a sample with the Perugia 2012 tune to a sample with the Perugia 2012 mpiHi
tune [24]. Both tunes use the CT10 PDF set [28] for parton shower and hadronisation. The same ME
level P
owhegevents generated with CT10 PDF are used for both samples. The full difference in the fitted
mass between the two models is taken as the systematic uncertainty for this source. The Perugia 2012
mpiHi tune is a variation of the Perugia 2012 tune with more semi-hard multiple parton interactions. The
colour reconnection parameters are kept fixed to the Perugia 2012 tune values. Both tunes are based on
the Perugia 2011C and Perugia 2011C mpiHi tune documented in [24]. The Perugia 2011C mpiHi tune
gives similar predictions to Perugia 2011C for transverse activity against leading-track p
T, an observable
sensitive to underlying event activity in inclusive proton proton collisions [60]. The samples used for
colour reconnection uncertainties yield notably different predictions for these observables.
Colour reconnection:
The impact of different models of colour reconnection of the partons entering the hadronisation is assessed by comparing samples simulated with P
owhegand P
ythia6 based on the Perugia 2012 tune and the Perugia 2012 loCR tune [24] for parton shower and hadronisation. As for the underlying event systematics, the same ME level P
owhegevents generated with CT10 PDF are used for both samples. Both tunes are based on the Perugia 2011C and Perugia 2011C noCR tune documented in [24]. Compared to the standard Perugia 2011 tune the Perugia 2011 noCR tune leads to significantly less activity in the transverse region with respect to the leading charged particle as measured in [60]. In addition to the effect of colour reconnection this tune is also used to estimate the systematic uncertainty associated with the particle spectra in the underlying event. The full difference in the fitted mass between the two assumptions on the size of the colour reconnection parameters is taken as the systematic uncer- tainty for this source. The systematic uncertainty due to colour reconnection is estimated independently for the single top t-channel production and t¯t.
Parton distribution functions (PDFs):
The systematic uncertainties related to the PDFs are taken into account for all samples involving top quarks generated with the NLO generator MC@NLO. The events are reweighted according to each of the PDF uncertainty eigenvectors. The uncertainties are calculated using the formula given in Equation (43) of [61]. The final PDF uncertainty is calculated as the envelope of the estimated uncertainties for the CT10, MSTW2008nlo68cl [62] and NNPDF2.3 [63] PDF sets, following the PDF4LHC recommendations [64].
Background normalisation and shape:
To estimate the impact of the background normalisation, pseudo-experiments are performed with the background contribution shifted by
±1σ and the half differ- ence of
Dm
outtopEcomparing the upwards and downwards variation is assigned as a systematic uncertainty due to the background normalisation. This kind of background normalisation uncertainty is evaluated independently for the W
+jets, multijet and the combined Z+jets and diboson background. A shape un-certainty on the multijet background is obtained by interchanging the models used to estimate the multijet background, namely the jet-lepton model and the anti-muon model. This variation also encompasses the change seen when using the matrix method estimate. The shape uncertainty on the W
+jets process forthe S
herpaMC generator is obtained using PDF reweighting to two different PDF sets. The default PDF set is CT10, which is reweighted to NNPDF2.3 and MSTW2008nlo68cl. The systematic uncertainty is calculated as the envelope of the maximum deviations between these three sets. A second contribution accounts for possible shape differences due to the flavor composition of the W+jets background from the W-boson production in association with b-, c- and light-flavoured jets. The two components are added in quadrature and listed as the W
+jets shape uncertainty in Table 3.Top normalisation:
An additional systematic uncertainty arises from the relative mixture of the domi- nant single-top t-channel process and other processes containing top-quarks, dominated by t¯t production.
Both sources contribute to the analysis as signal and their relative contribution is varied to study any ef- fect on the measurement of m
top. This is done by changing the normalization of each process within its uncertainties. Correlated and anti-correlated variations between the processes are considered and the envelope of all variations are used to determine the final uncertainty.
The total uncertainty is dominated by the jet energy scale and the modelling of the t-channel signal.
Another important contribution arises from the background normalisation. Table 3 summarises the re-
sulting systematic uncertainties together with the measured top quark mass and its statistical uncertainty.
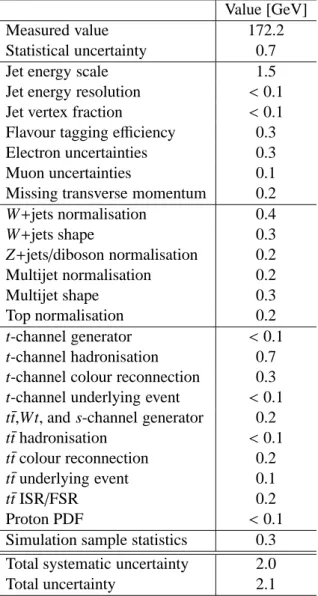
Table 3: Measured value of m
topand uncertainties on the measurement for the systematic variations explained in Section 8.
Value [GeV]
Measured value 172.2
Statistical uncertainty 0.7
Jet energy scale 1.5
Jet energy resolution
<0.1 Jet vertex fraction
<0.1 Flavour tagging efficiency 0.3 Electron uncertainties 0.3
Muon uncertainties 0.1
Missing transverse momentum 0.2
W+jets normalisation 0.4
W+jets shape 0.3
Z+jets/diboson normalisation 0.2 Multijet normalisation 0.2
Multijet shape 0.3
Top normalisation 0.2
t-channel generator
<0.1 t-channel hadronisation 0.7 t-channel colour reconnection 0.3 t-channel underlying event
<0.1 t¯t,Wt, and s-channel generator 0.2 t¯t hadronisation
<0.1 t¯t colour reconnection 0.2
t¯t underlying event 0.1
t¯t ISR/FSR 0.2
Proton PDF
<0.1
Simulation sample statistics 0.3 Total systematic uncertainty 2.0
Total uncertainty 2.1
m(lb) [GeV]
60 80 100 120 140
Events / 2.5 GeV
500 1000 1500
[GeV]
mtop
170 171.33 172.67 174
-2ln(L)
0 1 2
= 8TeV data 3
s
Background signal t t
Single-top t-channel signal
Preliminary ATLAS
Ldt = 20.3 fb-1
∫
0.7 (stat.) GeV
± = 172.2 Best fit: mtop