ATLAS-CONF-2012-056 06/06/2012
ATLAS NOTE
ATLAS-CONF-2012-056
June 6, 2012
Measurement of the t-channel single top-quark and top-antiquark cross-sections and their ratio in pp collisions at √
s = 7 TeV
The ATLAS Collaboration
Abstract
We present measurements of the single top-quark and top-antiquark production cross- sections and their ratio in
t-channel production inppcollisions with a center-of-mass energy of
√s=
7 TeV at the LHC. The collision data recorded with the ATLAS detector correspond to an integrated luminosity of 4.7 fb
−1. Selected events contain one charged lepton, miss- ing transverse momentum, and two or three jets, one and only one of them
b-tagged. Thebackground consists of multijet,
W+jets andtt¯ pair events, with smaller contributions from
Z+jets and diboson events. The top-quark and top-antiquark production cross-sections aremeasured by perfoming a binned maximum likelihood fit to the output distribution of neural networks in the
W+2 jets and
W+3 jets data sets that are split according to the charge of the lepton, resulting in
σt(t)
=53.2
±10.8 pb and
σt(¯
t) =29.5
+7.4−7.5
pb. A cross-section ratio of
Rt =1.81
+0.23−0.22is measured. When evaluating the uncertainties of
Rtthe correlations between the individual cross-section measurements are taken into account, leading to a reduction of the uncertainty. The ratio
Rtis sensitive to the ratio of the up-quark and down-quark parton distribution functions in the proton. The measurement is in agreement with the predictions that vary between 1.86 and 2.07.
c Copyright 2012 CERN for the benefit of the ATLAS Collaboration.
Reproduction of this article or parts of it is allowed as specified in the CC-BY-3.0 license.
1 Introduction
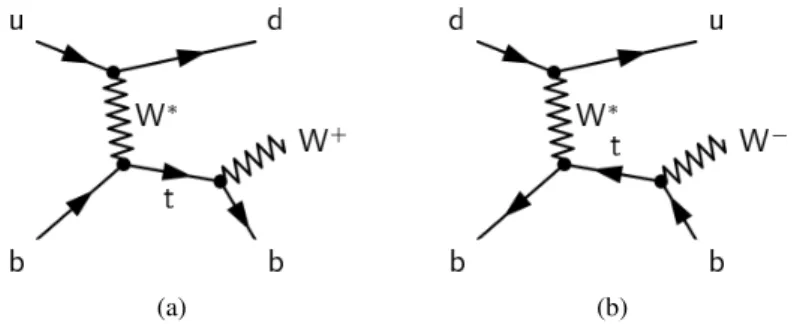
At the LHC, top quarks are expected to be produced singly via weak, charged-current interactions with a cross-section of the same order of magnitude as the one for t t ¯ pair production mediated via the strong interaction. There are three relevant single top-quark subprocesses that are distinguished by the virtuality of the exchanged W boson. The dominant process is the t-channel exchange of a virtual W
∗, depicted in Figure 1, which is the focus of this analysis. A light quark from one of the colliding protons interacts with a b quark from another proton exchanging a virtual W boson, W
∗. Since the up-quark density inside the proton is about twice as high as the down-quark density, the production cross-section of single top-quarks is about twice as high as the cross-section for top-antiquark production. The typical momentum fraction x of the incoming light quarks is in the range of 0.02
.x
.0.5, with a median of 0.17 for u quarks and a median of 0.13 for d quarks. In the large x regime the parton distribution functions (PDF) are dominated by the valence-quark contributions. The current knowledge of the valence-quark distributions, as derived from QCD-fit analyses, relies mainly on the deep inelastic scattering data in the high-x region which is experimentally more challenging.
(a) (b)
Figure 1: Feynman diagrams of (a) single top-quark and (b) single top-antiquark production via the t-channel exchange of a virtual W
∗boson.
In this note we present measurements of the cross-sections of single top-quark and single top- antiquark production,
σt(t) and
σt(¯ t) in the t-channel, and a measurement of the cross-section ratio R
t ≡ σt(t)/σ
t(¯ t) at a center-of-mass energy of
√s
=7 TeV. The measurements of
σt(t) and
σt(¯ t) are sensitive to the PDFs of the u-quark and the d-quark in the x regime mentioned above. The measurement of R
tis sensitive to the ratio of the two PDFs and features smaller systematic uncertainties because of partial cancellations. These single top-quark measurements are complementary to measurements of the W
±charge asymmetry that probe the regime 10
−3 .x
.10
−1at the LHC [1] and 0.005
.x
.0.3 at the Tevatron [2, 3].
Investigating R
tprovides also an interesting handle on searching for new physics contributions in single top-quark (top-antiquark) production [4] or in understanding the nature of physics beyond the Standard Model if it would be observed [5].
Subleading single top-quark processes are the associated production of an on-shell W boson and a top quark (Wt) and the Drell-Yan type production of t b ¯ (s-channel). The cross-sections of all three single top-quark production processes have been calculated with approximate next-to-next-to-leading order precision. In pp collisions at
√s
=7 TeV, the cross-sections of top-quark and top-antiquark production in the t-channel are predicted to be
σt
(t)
=41.9
+1.8−0.8pb and
σt(¯ t)
=22.7
+0.9−1.0pb,
assuming a top-quark mass of m
t =172.5 GeV [6]. The predicted cross-sections for the s-channel
production are
σs(t)
=3.1
±0.1 pb and
σs(¯ t)
=1.4
±0.1 pb [7]. As the Wt production is charge
symmetric, we quote its combined cross-section of
σWt =15.7
±1.1 pb [8]. Systematic uncertainties on the predicted cross-sections are related to the choice of the factorisation and renormalization scale and to the uncertainties associated with the parton density functions. The cross-sections given above are used to compute the number of expected single top-quark events for this analysis.
We consider only events in the so called lepton+jets channel, where the lepton can be either an elec- tron or muon originating from a W-boson decay. Fully-hadronic final states are not considered because of the overwhelming multijet background. The analysis has acceptance for signal events involving W
→τνdecays if the
τlepton subsequently decays to either eν
eντor
µνµντ. The W-boson branching ratios to eν,
µν, andτνused to compute the number of expected single top-quark events are taken from the Particle Data Group [9].
The experimental signature of candidate events is thus given by one charged lepton (electron or muon), large values of E
missT, the magnitude of the missing transverse momentum, and two or three hadronic jets with high p
T. One of these jets originates from a b-quark. The acceptance for t-channel events is dominated by the two-jet signature, where one jet is a b-quark jet, while the second jet is a light- quark jet. A significant fraction of single top-quark events are also present in the three-jet bin, while in the four-jet bin, the t t ¯ background becomes dominant. For this reason, the analysis only considers the W
+2 and W
+3 jets data sets.
The most important background for single top-quark processes in the lepton+jets channel is W+jets production. If one of the jets contains heavy-flavour hadrons, these events have the same signature as signal events. Due to possible misidentification of a light jet as a b-quark jet, W+light jets production also contributes to the background. Another important background comes from t¯ t events, which are difficult to separate from single top-quark events, since they contain real top quarks. Another background comes from QCD-multijet production, where a hadronic jet is misidentified as a lepton, most usually an electron, or a real high-p
Tlepton is produced within a jet due to the semileptonic decay of a heavy-flavour hadron and passes the lepton isolation criteria. Other smaller backgrounds come from diboson production (WW , WZ, and ZZ) and Z+jets events.
This note is organised as follows. In Section 2 we give an overview of the prediction of the cross- section ratio R
tfor different PDF sets. Section 3 summarises the data samples used and samples of simulated events. The definition of physics objects and the event selection are summarised in Section 4, while Section 5 is dedicated to the estimation of the background rates and testing of the background model. Signal and background discrimination using neural networks (NN) is presented in Section 6.
Section 7 describes the systematic uncertainties considered in the analysis. The measurement of the cross-sections and of R
tand the estimation of the expected and observed uncertainties are discussed in Section 8. The results are summarised in Section 9.
2 Predictions for the cross-section ratio R
tThe cross-section ratio R
tis sensitive to the momentum probability density of quarks in the proton.
Looking at the most important leading order (LO) Feynman diagram of the t-channel process, one can see that the initial state consists of a light quark and a b-quark. The charge of the light quark is directly connected to the charge of the W boson coming from the top-quark or top-antiquark decay, see Figure 1.
The charge of the lepton from the subsequent W-boson decay indicates whether the initial light quark was an up-type or a down-type quark.
Parton distribution functions are available from various groups worldwide, e.g. CTEQ [10], GJR [11],
ABKM [12], MSTW [13], NNPDF [14], and HERAPDF [15]. The PDFs provided by the different groups
differ in the data used, the value of
αs, the values of quark masses, and the treatments of the heavy quark
masses. They also differ in the way higher order corrections are implemented, the parametrisation form,
the way of treating systematic uncertainties and the criteria for estimating confidence levels. For these
reasons the measurement presented here could provide additional information to further constrain PDFs.
To be consistent with the model which is used to simulate t-channel single top-quark events, the cross-section calculation described below is done with massive b-quarks in the initial state. Thus, we consider for this analysis only the most current PDF sets that implement the fixed-flavour number scheme with four active flavours in which the b quark is dynamically generated. We cross-checked the results with PDF sets using five active flavours, including the b-quark PDF, and found them to be in agreement within 1%.
For the calculation of the cross-section, the standard ATLAS values for the electroweak parameters are used. The renormalisation and factorisation scales are set to m
t/2 for the light quark line andm
t/4for the heavy quark line, respectively, following the calculation in [16]. The various considered next-to- leading order (NLO) PDF sets are included in the calculation using LHAPDF v5.8.6 [17]. The cross- section ratio is calculated for CT10 with and without including the D0 W
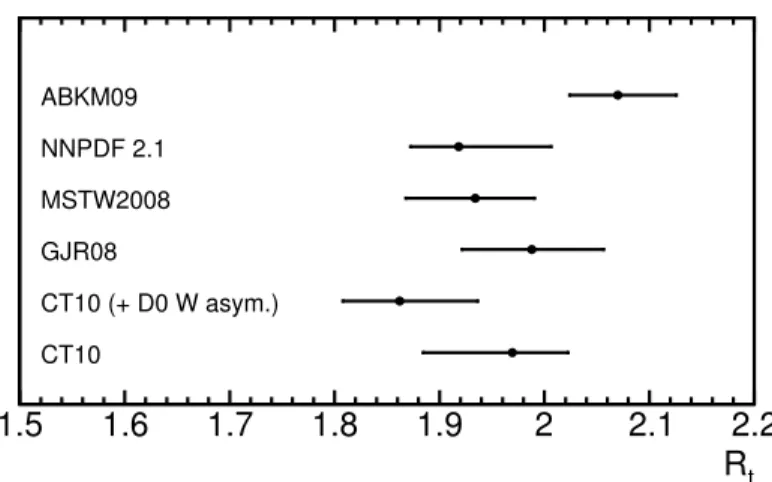
±asymmetry data [2], GJR08, MSTW2008, NNPDF 2.1, and ABKM09 and the results are summarised in Table 1 and displayed in Figure 2. The comparison of the calculation for the CT10 set with and without including the D0 W
±asymmetry data, which is the only PDF set providing it, is interesting, since it directly affects the ratio of up quarks and down quarks in the x region probed by our measurement of R
t. The CDF measurement of the W
±charge asymmetry [3] is of similar precision, is sensitive in the same x range and is included in both CT10 fits.
The statistical uncertainty on the cross-section calculation for top-quark or top-antiquark production is
∼0.5%. Treated as uncorrelated, the resulting uncertainty on R
tis
∼0.9%. We estimate the uncertainty on the renormalisation and factorisation scale by both dividing and multiplying the default values by a factor of two. The uncertainties are treated as correlated between the top-quark and the top-antiquark production. Uncertainties connected with the determination of the PDFs itself are evaluated using the corresponding description. The uncertainty for the NNPDFs is estimated using an ensemble of pseudo- experiments, described in [14]. For all others we use the formula given in [18] Equation 43. In case of the CT10 we use the eigenvectors of the five flavour PDF set.
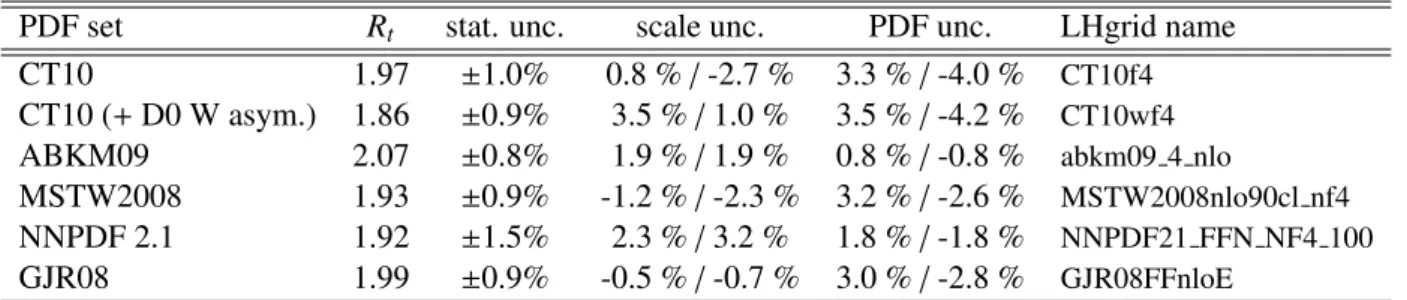
Table 1: Calculated R
tvalues for different NLO PDF sets. The scale errors contain the uncertainty on the renormalisation and factorisation scales.
PDF set R
tstat. unc. scale unc. PDF unc. LHgrid name
CT10 1.97
±1.0% 0.8 %
/-2.7 % 3.3 %
/-4.0 %
CT10f4CT10 (+ D0 W asym.) 1.86
±0.9% 3.5 %
/1.0 % 3.5 %
/-4.2 %
CT10wf4ABKM09 2.07
±0.8% 1.9 %
/1.9 % 0.8 %
/-0.8 %
abkm09 4 nloMSTW2008 1.93
±0.9% -1.2 %
/-2.3 % 3.2 %
/-2.6 %
MSTW2008nlo90cl nf4NNPDF 2.1 1.92
±1.5% 2.3 %
/3.2 % 1.8 %
/-1.8 %
NNPDF21 FFN NF4 100GJR08 1.99
±0.9% -0.5 %
/-0.7 % 3.0 %
/-2.8 %
GJR08FFnloEAmong the predictions of R
tpresented in Figure 2 it is interesting to note that the inclusion of the W
±charge asymmetry measured by D0 [2] in the case of the CT10 PDF set leads to a shift of the prediction by about 1
σ.3 Data samples and samples of simulated events
The analysis described in this note uses pp LHC collision data at a centre-of-mass energy of 7 TeV
collected with the ATLAS detector [19] between March and November 2011. The selected events
were recorded based on single electron and single muon triggers. Stringent detector and data quality
Rt
1.5 1.6 1.7 1.8 1.9 2 2.1 2.2
CT10
CT10 (+ D0 W asym.) GJR08
MSTW2008 NNPDF 2.1 ABKM09
Figure 2: Calculated R
tvalues for different NLO PDF sets. The errors contain the uncertainty on the renormalisation and factorisation scales, the statistical uncertainty of the calculation and the uncertainty of the PDF itself.
requirements are applied, resulting in a data set corresponding to an integrated luminosity of 4.71
±0.18 fb
−1[20, 21].
Samples of simulated events for all three single-top processes are produced with the A
cerMC pro- gram [22] linked to PYTHIA [23] for showering and hadronisation. For the generation the MRST LO** [24] set of PDFs were used and the factorisation and renormalisation scales were set to
µR = µF = √ˆ
s, the centre-of-mass energy of the partonic system. Samples for the t t ¯ process are generated using MC@NLO [25]. All processes involving top quarks are produced assuming a top-quark mass of 172.5 GeV. Vector boson (W/Z) production in association with jets is simulated using the leading order generator ALPGEN [26], coupled with the CTEQ6L1 set of PDFs [27]. The diboson processes WW , WZ and ZZ are generated using HERWIG [28]. For all background processes the hadronisation is performed by HERWIG in connection with the JIMMY [29] underlying event model. After the event generation step, all samples are passed through the full simulation of the ATLAS detector [30] based on GEANT4 [31] and are then reconstructed using the same procedure as for collision data. The simulation includes the effect of multiple pp collisions per bunch crossing at a variable rate and is weighted to the same number of collisions per bunch crossing as the data.
4 Object definition and event selection
In this section, we describe the definition of physics objects and the selection criteria for candidate events. Electron candidates are reconstructed offline using a cluster-based algorithm and are required to have E
T >25 GeV and
|ηcl| <2.47, where
ηcldenotes the pseudorapidity of the calorimeter cluster.
Clusters falling in the calorimeter barrel-endcap transition-region, corresponding to 1.37
< |ηcl|<1.52, are ignored. High-quality electron candidates are selected using a set of cuts [32] which include stringent requirements on the matching between the track and the calorimeter cluster. Electrons must also be well isolated: the sum of the calorimeter transverse energy within a cone of radius
∆R= p∆η2+ ∆φ2 =
0.2
(excluding the cells associated with the electron) is required to be below a certain threshold that depends
on the electron E
T, the electron
ηand the number of reconstructed primary vertices and is chosen such
that the efficiency for real electrons to pass this isolation requirement is 90%. In addition, the p
Tof all
tracks within a cone of radius
∆R=0.3 around the electron direction, again excluding the track belonging
to the electron, is also restricted to fall below an E
T-dependent threshold. The efficiency for this track- based isolation requirement is also 90% for real electrons. The inefficiencies for the track-based and the calorimetry-based isolation are correlated.
Muon candidates are reconstructed by combining track segments found in the inner detector and in the muon spectrometer. We only consider candidates that have p
T >25 GeV and
|η| <2.5. Selected muons must additionally satisfy a series of cuts on the number of track hits present in the various track- ing sub-detectors [32]. Muon candidates are also required to be isolated. The sum of the calorimeter transverse energy within a cone of radius
∆R =0.2 is required to be below 4 GeV, while the p
Tof all tracks within a cone of radius
∆R =0.3 must be below 2.5 GeV. The efficiency for this combined isolation requirement is between 95% and 97%.
Particle jets are reconstructed using the anti-k
talgorithm [33] with a width parameter of 0.4, using topological clusters [34] identified in the calorimeter as inputs to the jet clustering. The response of the calorimeter is corrected through a p
T- and
η-dependent factor, which is derived from simulated eventsand validated with data. It is applied to each jet to provide an average energy scale correction [35]. Jets overlapping with selected electron candidates within
∆R<0.2 are removed, as in these cases the jet and the electron are very likely to correspond to the same physics object. Only jets having p
T >25 GeV and
|η|<4.5 are considered. Jets in the endcap-forward calorimeter transition region, corresponding to 2.75
<|η|<3.75, must have p
T>50 GeV. To reject jets from pile-up events, a quantity called jet-vertex fraction
ǫjvfis defined as the ratio of
Pp
Tfor all tracks within the jet that originate from the primary vertex associated to the hard-scattering collision to the
Pp
Tof all tracks matched to the jet; and it is required that
ǫjvf >0.75 for those jets which have associated tracks. Jets containing bottom-quarks are tagged in the region
|η|<2.5 by reconstructing secondary and tertiary vertices from the tracks associated with each jet and combining lifetime related information with a neural network [36]. The chosen working point, when cutting on the NN discriminant, corresponds to a b-tagging efficiency of about 60% and a light-quark jet rejection rate (reciprocal of the efficiency to b-tag light-quarks) of about 600 for jets in t t ¯ events. The E
missTis calculated using topological clusters and corrected for the presence of electrons, muons, and jets [37].
Candidate events are selected if they contain at least one good primary vertex candidate with at least five associated tracks. Events containing jets with uncalibrated transverse momentum p
T >10 GeV failing quality criteria against misreconstruction [38] are rejected.
The event selection requires exactly one charged lepton, e or
µ, exactly two or three jets, andE
missT >30 GeV. A trigger matching requirement is applied where the lepton must lie within
∆R<0.15 of its trigger-level object. Since the multijet background is difficult to model precisely, we reduce its con- tribution by computing the transverse mass of the lepton-E
Tmisssystem which resembles the transverse mass of the W boson for W+ jets events:
m
T(W)
= q2 p
T(ℓ)E
Tmissh1
−cos
∆φℓ,
E
missT i .and requiring m
T(W)
>30 GeV.
The following samples are defined for this analysis: a “pretag sample” with two or three jets, without making any b-tagging requirement, and a “tagged sample” with two jets or three jets, exactly one of which is b-tagged.
5 Background estimation
The main backgrounds to the single top-quark final state arise from W boson production in association
with jets, top quark pair (t¯ t) production and QCD multijet events. Smaller backgrounds originate from
Z+jets, Wt-channel and s-channel single top-quark production, and diboson production. These smaller
Jet bin e central channel e forward channel
µchannel
e
+e
−e
+e
− µ+ µ−2-jets 5.6% 7.0% 12.0% 16.6% 5.9% 7.1%
3-jets 4.6% 7.6% 9.2% 9.9% 4.9% 3.3%
Table 2: Estimated fractions of the QCD-multijet background in different jet bins and bins of lepton charge for b-tagged events in the central electron+jets, forward electron+jets and muon+jets data sets.
An overall uncertainty of 50 % is assigned on these rates.
backgrounds and the top pair background are modeled using Monte Carlo simulation and normalised to the corresponding theory predictions.
5.1 Estimation of the QCD-multijet background
The multijet background normalisation is obtained with the use of a binned maximum likelihood fit to the E
Tmissdistribution in the data, before application of the E
Tmisscut, using a data-derived template for the multijet background and Monte-Carlo simulation templates for all other processes (top, W/Z+jets, dibosons). The multijet template consists of events where the electron requirement in the selection is replaced by a jet requirement (jet-electron model). This jet must have p
T >25 GeV, satisfy the same
|η|cuts as the signal electrons, have
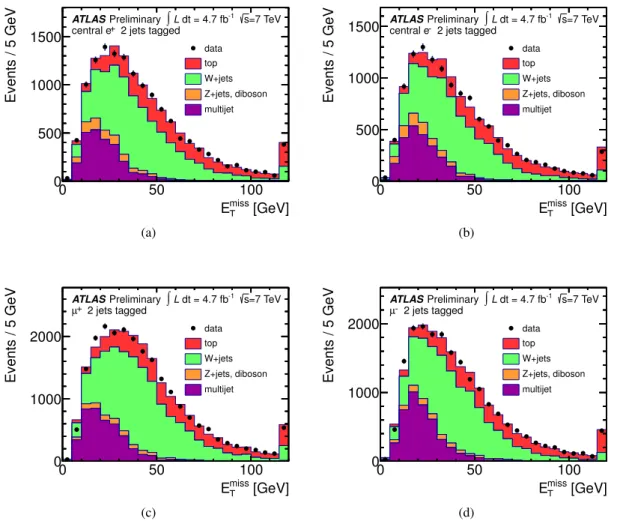
ǫjvf >0.75, and 80-95% of its energy must be deposited in the electromagnetic section of the calorimeter. The jet must also contain at least four tracks, thus reducing the contribution from converted photons. The same model is also used in the muon channel, as all QCD sensitive distributions are also well-described by the model in this channel. The electron distributions are fitted in two channels, electrons in the forward and central region of the electromagnetic calorimeter, to estimate the multijet background. The resulting estimates, done separately for each lepton channel and lepton charge, of the fractions of the multijet background in the tagged data sets are given in Table 2. The absolute rates of multijet events are consistent between the two lepton charges. The fitted E
missTdistributions in the W
+2 jets data set leading to these results are shown in Fig. 3.
To evaluate the systematic uncertainty for the QCD estimation we divide the jet-electron data sample into a high pile-up sample and a low pile-up sample based on the number of primary vertices. The method is applied to both samples separately to gauge the effect of pile-up on the procedure. Additionally, the rate of the multijet background in the muon+jets data set was estimated with the so-called matrix method [39].
As a result of these studies we assign a systematic uncertainty of 50% on the QCD-multijet rate.
The distribution of the selected jet electron-sample as a function of the discriminating variables used in the NN is used as the shape of the multijet background. All selection cuts are applied, including the requirement of one b-tagged jet. For this a working point with a b-tagging efficiency of 85% is chosen to increase the statistics of the sample. To avoid a contamination of the jet-electron sample with W+jets events, events are vetoed if they contain one or more leptons that are identified according to high-efficiency, but low-purity identification criteria.
5.2 Estimation of the W+ jets background
For the backgrounds other than QCD-mulitjet, the expected number of events passing the selection cri-
teria is based on the cross-section from a theoretical calculation or the prediction of the Monte-Carlo
generator. In case of the ALPGEN samples the prediction based on the ALPGEN LO calculation is
multiplied with a scale factor of 1.2 for the W
+b b, ¯ W
+c c ¯ and W+light jets samples to correct the pre-
diction to the inclusive next-to-next-to-leading order theory calculation with FEWZ [40]. The ALPGEN
prediction for the W
+c jets process is scaled by a factor of 1.52 that is obtained by a study based on
[GeV]
miss
ET
0 50 100
Events / 5 GeV
0 500 1000
1500 central e+ 2 jets tagged
=7 TeV s
-1 dt = 4.7 fb
∫L Preliminary ATLAS
data top W+jets Z+jets, diboson multijet
(a)
[GeV]
miss
ET
0 50 100
Events / 5 GeV
0 500 1000
1500 central e- 2 jets tagged
=7 TeV s
-1 dt = 4.7 fb
∫L Preliminary ATLAS
data top W+jets Z+jets, diboson multijet
(b)
[GeV]
miss
ET
0 50 100
Events / 5 GeV
0 1000 2000
2 jets tagged
µ+ Preliminary ∫L dt = 4.7 fb-1 s=7 TeV ATLAS
data top W+jets Z+jets, diboson multijet
(c)
[GeV]
miss
ET
0 50 100
Events / 5 GeV
0 1000 2000
2 jets tagged
µ- Preliminary ∫L dt = 4.7 fb-1 s=7 TeV ATLAS
data top W+jets Z+jets, diboson multijet
(d)
Figure 3: E
missTdistributions in the W
+2 jets tagged data set: (a) e
+central channel, (b) e
−central channel, (c)
µ+channel, and (d)
µ−channel. All processes are normalised to the result of the binned likelihood fit used to determine the fraction of QCD-multijet events.
next-to-leading order calculations using MCFM. The normalisation uncertainties are estimated from the uncertainty in the cross-section of the W
/Z+0 jet process and the uncertainty in the cross-section ratio of W
/Z +(n
+1) jet to W/Z
+n jet. A cross-section uncertainty of 4% is assigned for the W
/Z +0 jet process, while ALPGEN parameter variations of the factorisation and renormalisation scale and the matching parameter consistent with experimental data yield an uncertainty on the cross-section ratio of 24% [41]. Background contributions from the heavy-quark processes Wb b, ¯ Wc c ¯ and Wc have additional relative uncertainties of 50%, estimated using a tag counting method in control regions [42]. We do not apply an additional data-based scale factor since we fit for these factors for the W+heavy flavour and the W+light jets contributions simultaneously when extracting the signal content. For the purpose of plots and the binned likelihood fit the W
+b b, ¯ W
+c¯ c, and W
+c jets processes are combined and labeled as W+heavy flavour.
5.3 Event yield
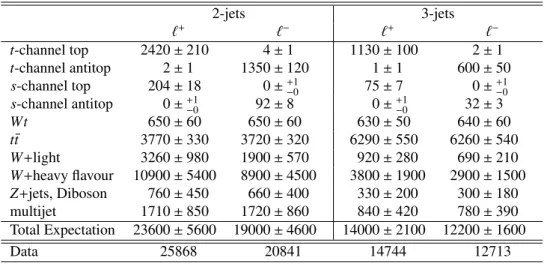
Table 3 lists the event yields after event selection for the tagged data set, where exactly one b-jet is
required. The observed event yield in data agrees well with the prediction within the systematic un-
certainties on the background prediction of about 20%. The largest background in the 2-jet data set is
2-jets 3-jets
ℓ+ ℓ− ℓ+ ℓ−
t-channel top 2420±210 4±1 1130±100 2±1
t-channel antitop 2±1 1350±120 1±1 600±50 s-channel top 204±18 0±+1−0 75±7 0±+1−0
s-channel antitop 0±+1−0 92±8 0±+1−0 32±3
Wt 650±60 650±60 630±50 640±60
t¯t 3770±330 3720±320 6290±550 6260±540
W+light 3260±980 1900±570 920±280 690±210
W+heavy flavour 10900±5400 8900±4500 3800±1900 2900±1500 Z+jets, Diboson 760±450 660±400 330±200 300±180 multijet 1710±850 1720±860 840±420 780±390 Total Expectation 23600±5600 19000±4600 14000±2100 12200±1600
Data 25868 20841 14744 12713
Table 3: Predicted and observed event yield for the tagged data set with 2 and 3 jets separated according to the lepton charge. The multijet estimation is derived from collision data based on the fit of the jet-electron model. All the other expectations are derived using theoretical cross-sections and their uncertainties are also theoretical. Additional scale factors to match the heavy-flavour jets content in collision data are not applied.
W+jets production which contributes about 60% to the total prediction. For the 3-jet selection the t¯ t background is largest component with about 50% of the total predicted yield. The 2-jet-ℓ
+channel has the highest signal-to-background ratio of about 10%. In the 2-jet-ℓ
−sample about 7% of the events are expected to come from t-channel single top-quark production.
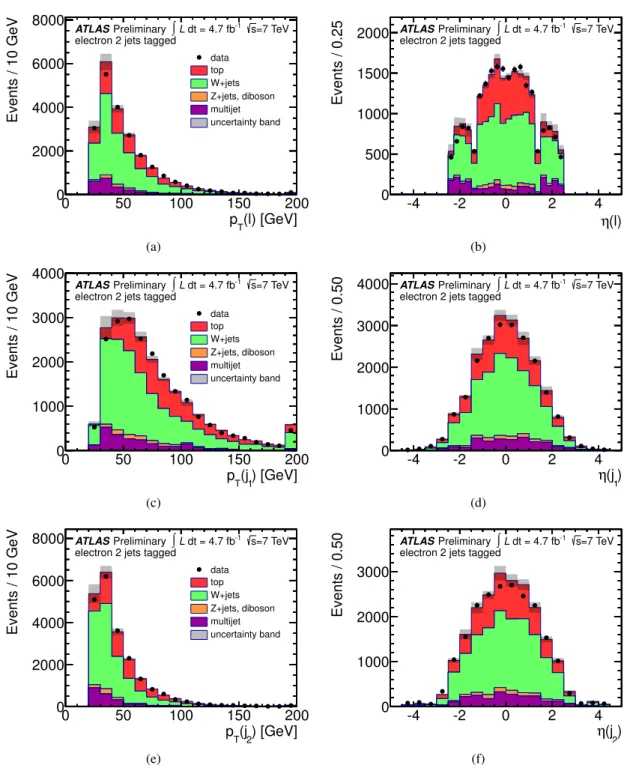
Based on the fit results obtained from the determination of the multijet background (Section 5.1) we investigate the modelling of basic kinematic variables, such as the p
Tand
ηof the charged lepton and the jets. As an example we show these distributions in the electron+2 jets channel in Figure 4.
6 Signal and background discrimination
To separate t-channel single top-quark signal events from the expected background events we combine several kinematic variables into one discriminant by employing a neural network. A large number of po- tential input variables have been studied, including kinematic variables of the identified physics objects, but also variables obtained from the reconstruction of the W-boson and the top-quark. In this calculation the transverse momentum of the neutrino is given by the the x- and
y-components of theE
Tmissvector, while the unmeasured z-component of the neutrino momentum p
z(ν) is inferred by imposing a W-boson mass constraint on the lepton-neutrino system. Since the constraint leads to a quadratic equation for p
z(ν), a two-fold ambiguity arises. In the case of two real solutions, the one with the lower
|p
z|is chosen.
In case of complex solutions which can occur due to the limited E
missTresolution, a fit is performed that rescales the neutrino p
xand p
ysuch that the imaginary radical vanishes and at the same time keeps the transverse components of the neutrino as close as possible to the x- and
y-components ofE
Tmiss.
As a compromise between discrimination power and the need for a manageable number of variables
the 15 highest-ranking variables are chosen in the W
+2 jets tagged sample while in the W
+3 jets tagged
sample the 19 highest-ranking variables are used. The variables used in the W
+2 jets data set are: the
absolute value of
ηof the light (untagged) jet
|η( j)
|; E
T( j); the invariant mass of the four-vector of the b-
tagged jet m (b); the scalar sum of the transverse momenta of the jets, the charged lepton and the missing
transverse energy H
T(ℓ, jets, E
missT); the absolute value of the difference in
ηof the charged lepton and
(l) [GeV]
pT
0 50 100 150 200
Events / 10 GeV
0 2000 4000 6000 8000
electron 2 jets tagged
=7 TeV s
-1 dt = 4.7 fb
∫L Preliminary ATLAS
data top W+jets Z+jets, diboson multijet uncertainty band
(a)
η(l)
-4 -2 0 2 4
Events / 0.25
0 500 1000 1500
2000 electron 2 jets tagged
=7 TeV s
-1 dt = 4.7 fb
∫L Preliminary ATLAS
(b)
) [GeV]
(j1
pT
0 50 100 150 200
Events / 10 GeV
0 1000 2000 3000 4000
electron 2 jets tagged
=7 TeV s
-1 dt = 4.7 fb
∫L Preliminary ATLAS
data top W+jets Z+jets, diboson multijet uncertainty band
(c)
1) η(j
-4 -2 0 2 4
Events / 0.50
0 1000 2000 3000 4000
electron 2 jets tagged
=7 TeV s
-1 dt = 4.7 fb
∫L Preliminary ATLAS
(d)
) [GeV]
(j2
pT
0 50 100 150 200
Events / 10 GeV
0 2000 4000 6000 8000
electron 2 jets tagged
=7 TeV s
-1 dt = 4.7 fb
∫L Preliminary ATLAS
data top W+jets Z+jets, diboson multijet uncertainty band
(e)
2) η(j
-4 -2 0 2 4
Events / 0.50
0 1000 2000 3000
electron 2 jets tagged
=7 TeV s
-1 dt = 4.7 fb
∫L Preliminary ATLAS
(f)
Figure 4: Distributions of basic kinematic quantities in the electron+2 jets data set after applying all
selections. The observed data are compared to the compound model consisting of simulated events and
the jet-electron sample to model the QCD-multijet background. The uncertainty band represents the rate
uncertainty of the multijet estimation of 50%. (a) p
Tand (b)
ηof the electron, (c) p
Tand (d)
ηof the
leading jet and, (e) p
Tand (f)
ηof the sub-leading jet. All processes are normalised to the result of the
binned maximum likelihood fit used to determine the fraction of QCD-multijet events.
b) [GeV]
ν m(l
0 100 200 300 400 500
Event fraction
0 0.1 0.2
0.3 t-channel (top)
ttbar, Wt W+heavy flavour 2 jets tagged
l+
= 7 TeV s Preliminary ATLAS
(a)
η(j)|
|
0 1 2 3 4 5
Event fraction
0 0.05 0.1
t-channel (top) ttbar, Wt W+heavy flavour 2 jets tagged
l+
= 7 TeV s Preliminary ATLAS
(b)
b) [GeV]
ν m(l
0 100 200 300 400 500
Event fraction
0 0.1 0.2
t-channel (top) ttbar, Wt W+heavy flavour 3 jets tagged
l+
= 7 TeV s Preliminary ATLAS
(c)
3)|
1,j η(j
∆
|
0 2 4 6
Event fraction
0 0.05 0.1 0.15
0.2 t-channel (top)
ttbar, Wt W+heavy flavour 3 jets tagged
l+
= 7 TeV s Preliminary ATLAS
(d)
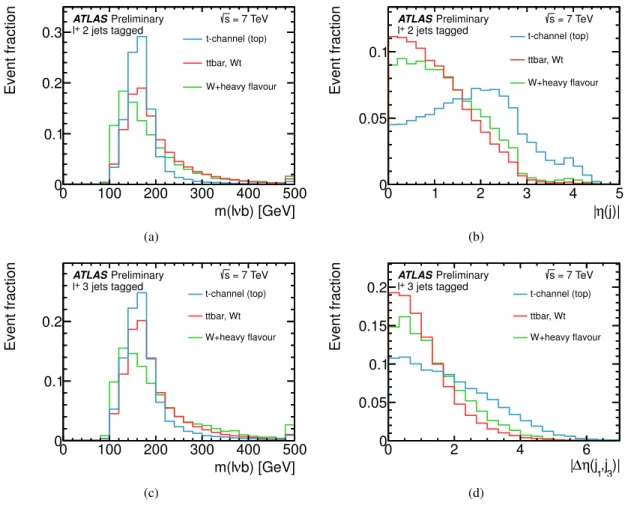
Figure 5: Examples of normalised distributions of three discriminating variables: (a) the reconstructed top-quark mass and (b)
|η|of the light jet in the 2-jets tagged
ℓ+data set; (c) the reconstructed top-quark mass and (d)
|∆η|of the leading and the lowest p
Tjet in the 3-jets tagged
ℓ+data set. The signal shape is shown together with the shape of the two largest backgrounds.
the b-tagged jet
|∆η(bℓ)
|; the absolute value of the difference in
ηof the charged lepton and untagged jet
|∆η
(ℓ, j)
|; the absolute value of the difference in
ηof the b-tagged and untagged jet
|∆η( j
,b)
|; absolute value of the difference in
ηbetween the b-tagged jet and the neutrino
|∆η(b, ν)
|; the invariant mass of the b-tagged (b) and untagged ( j) jet in the event m ( jb); the invariant mass of the lepton (ℓ) and the b-tagged jet m (ℓb); the top-quark mass reconstructed from the charged lepton, the neutrino and the b-tagged jet m (ℓνb); the invariant mass of the untagged jet and the reconstructed top-quark m (ℓνb j); the cosine of the angle
Θbetween the neutrino and the reconstructed W-boson cos
Θ(ν, lν); the cosine of the angle between the untagged jet and the charged lepton in the rest frame of the top-quark (which is sensitive to the polarisation); and the sphericity
1. The probability density distributions of two variables used in the W
+2 jets positive charge data set are shown in Figures 5(a) and (b).
These are the 19 variables used in the W
+3 jets tagged data set: the pseudorapidity of the recon- structed W-boson
|η(ℓν)
|; the transverse momentum of the charged lepton p
T(ℓ); the transverse mo- mentum of the second (central) untagged jet p
T( j
l2); E
missT; H
T(ℓ, jets, E
missT); the absolute value of the
1The sphericity is an event shape variable that is defined as32(λ2+λ3), whereλ2andλ3are the two smallest eigenvalues of the sphericity tensor that is defined asSαβ=(P
ipαipβi)/(P
i|~pi|2). The sum runs over the lepton, the reconstructed neutrino and all reconstructed jets in the event.
difference in
ηof the two leading jets
|∆η( j
1,j
2)
|; the absolute value of the difference in
ηof the leading and the lowest p
Tjet
|∆η( j
1,j
3)
|;
|∆η(ℓ, b)
|;
|∆η(b, ν)
|; the difference of the transverse momentum of the charged lepton and the forward untagged jet
∆pT(l, j
l); the difference of the transverse momentum of the reconstructed top-quark and the forward untagged jet
∆pT(ℓνb, j
l); the absolute value of the dif- ference in
ηof the reconstructed W-boson and the leading jet
|∆η( j
1,W)
|; m
T(ℓν); the invariant mass of the two leading jets m ( j
1j
2); the invariant mass of the two jets present in the event without the leading jet m ( j
2j
3); m (ℓνb); m (ℓb); the
∆Rof the charged lepton and the b-tagged jet
∆R(l, b); and the cosine of the angle
Θbetween the forward light jet and the reconstructed top-quark cos
Θ( j
l, ℓνb). Comparisionsbetween simulated and observed distributions of these variables are shown in the Appendix.
6.1 Neural network training
This analysis uses the NeuroBayes [43, 44] tool which combines a three-layer feed-forward NN with a complex preprocessing of the input variables. NeuroBayes uses Bayesian regularisation techniques for the training process to improve generalisation performance and to avoid overtraining. The network infrastructure consists of one input node for each input variable plus one bias node, an arbitrary, user- defined number of hidden nodes, and one output node which gives a continuous output in the interval [0, 1]. In this specific case we use 33 nodes in the hidden layer and the ratio of signal to background events in the training was chosen to be 50:50, where the different background processes are weighted according to their number of expected events. For the training of the NN only the MC simulated events are used. Background events from the multijet data sample are not used in the network training.
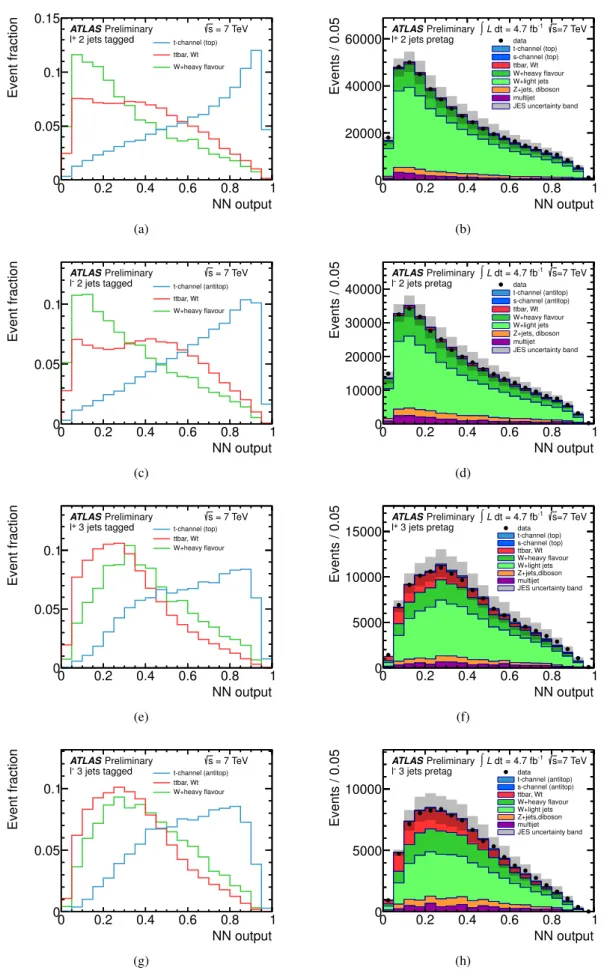
The training of the NNs is done individually in the four different channels that are considered (2- jets-ℓ
+, 2-jets-ℓ
−, 3-jets-ℓ
+, and 3-jets-ℓ
−). The resulting NN output distributions for the signal and the two largest background physics processes are shown in Figures 6(a) and (c) and Figures 6(e) and (g).
The kinematic modelling is checked in the large pretag data set by applying the NNs to these data. The resulting distributions are shown in Figures 6(b) and (d) for the W
+2 jet data set and in Figures 6(f) and (h) for the W
+3 jets data set.
7 Systematic uncertainties
Systematic uncertainties on the normalisation of the individual backgrounds and on the signal acceptance affect the measured single top-quark t-channel cross section. Also the shape of the individual predictions is affected; both the rate and the shape uncertainties are taken into account by generating correlated pseudo-experiments. The impact of the systematic uncertainties on the t-channel cross-section mea- surement is estimated from these pseudo-experiments. The uncertainties can be split into the following categories:
Object modelling
Systematic uncertainties for the reconstruction and energy calibration of jets, elec- trons and muons are propagated through the analysis. The main source of object modelling uncertainty comes from the jet energy scale, including the modelling of pile-up, as well as b-jet identification. Other components include lepton energy scale and lepton and jet identification efficiencies. The jet energy scale (JES) uncertainty has been evaluated using 2010 ATLAS data [35]. Additional contributions to this uncertainty due to the larger pile-up effects in 2011 data are included and range from less than 2% to 7%
as a function of jet p
Tand
η. Forb-quark induced jets, an additional flavour-specific jet energy scale un-
certainty of 0.8% to 2.5%, depending on the jet p
T, is added in quadrature to the JES uncertainty. Scale
factors, determined from collision data, are applied to correct the b-tagging performance in simulated
events to match the data. Both b-jets and c-jets in simulation use the same tagging scale factors with
uncertainties that depend on the p
Tand
ηof the jet. The uncertainties on the scale factors vary from
10 to 20% for b-quark jets [45] and from 20 to 40% for c-quark jets [46]. For light jets the mis-tagging
NN output
0 0.2 0.4 0.6 0.8 1
Event fraction
0 0.05 0.1 0.15
t-channel (top) ttbar, Wt W+heavy flavour
2 jets tagged l+
= 7 TeV s Preliminary ATLAS
(a)
NN output
0 0.2 0.4 0.6 0.8 1
Events / 0.05
0 20000 40000
60000 l+ 2 jets pretag
=7 TeV s
-1 dt = 4.7 fb
∫L Preliminary ATLAS
data t-channel (top) s-channel (top) ttbar, Wt W+heavy flavour W+light jets Z+jets, diboson multijet JES uncertainty band
(b)
NN output
0 0.2 0.4 0.6 0.8 1
Event fraction
0 0.05 0.1
t-channel (antitop) ttbar, Wt W+heavy flavour
2 jets tagged l-
= 7 TeV s Preliminary ATLAS
(c)
NN output
0 0.2 0.4 0.6 0.8 1
Events / 0.05
0 10000 20000 30000
40000 l- 2 jets pretag
=7 TeV s
-1 dt = 4.7 fb
∫L Preliminary ATLAS
data t-channel (antitop) s-channel (antitop) ttbar, Wt W+heavy flavour W+light jets Z+jets, diboson multijet JES uncertainty band
(d)
NN output
0 0.2 0.4 0.6 0.8 1
Event fraction
0 0.05 0.1
t-channel (top) ttbar, Wt W+heavy flavour
3 jets tagged l+
= 7 TeV s Preliminary ATLAS
(e)
NN output
0 0.2 0.4 0.6 0.8 1
Events / 0.05
0 5000 10000
15000 l+ 3 jets pretag
=7 TeV s
-1 dt = 4.7 fb
∫L Preliminary ATLAS
data t-channel (top) s-channel (top) ttbar, Wt W+heavy flavour W+light jets Z+jets,diboson multijet JES uncertainty band
(f)
NN output
0 0.2 0.4 0.6 0.8 1
Event fraction
0 0.05 0.1
t-channel (antitop) ttbar, Wt W+heavy flavour
3 jets tagged l-
= 7 TeV s Preliminary ATLAS
(g)
NN output
0 0.2 0.4 0.6 0.8 1
Events / 0.05
0 5000 10000
3 jets pretag l-
=7 TeV s
-1 dt = 4.7 fb
∫L Preliminary ATLAS
data t-channel (antitop) s-channel (antitop) ttbar, Wt W+heavy flavour W+light jets Z+jets,diboson multijet JES uncertainty band
(h)
Figure 6: Distributions of the neural network output in the W
+2-jet and W
+3 jet data sets. The normalised distributions for signal and the two most important background processes are shown in (a) and (e) for positive and (c) and (g) for negative lepton charge. The result of the application of the NNs in the pretag control region is shown in (b) and (f) for positive and in (d) and (h) for negative lepton charge.
Here the overall MC model expectation is scaled to the number of observed data events by respecting the relative normalisation between the different processes. The error band in these plots represents the
12
uncertainty ranges from 20 to 50% as a function of jet p
Tand
η[47]. The difference in the b-tagging efficiency between b quark and ¯ b initiated processes is on the order of 1% for the t-channel top-quark and top-antiquark samples and taken into account as such. Other minor uncertainties are assigned to the reconstruction of E
missTand to account for the impact of pile-up collisions on E
Tmiss.
Monte Carlo generators
Systematic uncertainties arising from the modelling of the single top signal and the t t ¯ background are taken into account. The largest contributions come from the amount of initial- state and final-state radiation, estimated using dedicated A
cerMC samples interfaced to PYTHIA where parameters controlling the ISR/FSR emission are varied by a factor of two up and down [48]. The uncertainty due to the choice of the single top t-channel signal generator is estimated from the difference between A
cerMC and MCFM [16] based on a parton-level study. For the W+jets background a shape uncertainty is assigned based on the variation of the choices of the matching scale and of the functional form of the factorisation scale in ALPGEN. The impact of using simulation samples of limited size is also taken into account.
The systematic uncertainties related to the parton distribution functions are taken into account for all single top-quark processes and for t t ¯ production. These events are reweighted according to each of the PDF uncertainty eigenvectors. The uncertainties are calculated using the formula given in [18] Equation 43. We take the envelope of the estimated uncertainties for the CT10 PDF set and the MSTW2008nlo [49]
PDF set as final PDF uncertainty.
Theoretical cross-section normalisation
The t¯ t, single top Wt- and s-channel backgrounds are nor- malised to their theory predictions, to which we assign uncertainties of 8.5%, 7% and 4%, respectively.
Since we group the t t ¯ and Wt processes in the statistical analysis together, we add both uncertainties respecting the relative fractions linearly, which leads to the combined uncertainty of 8.7%. The uncer- tainty on the combined Z+jets and diboson background is 60%, while the uncertainties of the W+jets backgrounds are 34% for W+light jets and 60% for W
+heavy flavour jets, as detailed in Section 5.2.
Additionally an uncertainty on the relative fraction of two to three jet events of 24% is applied.
Luminosity
The uncertainty on the integrated luminosity is 3.9% [20, 21].
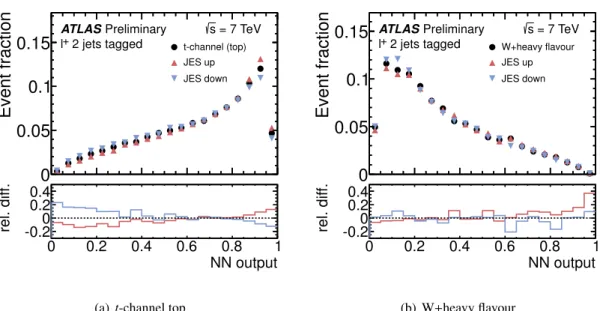
The systematic uncertainties discussed above cause variations on the signal acceptance, the back- ground rates and the shape of the neural network output distribution. As an example, Figure 7 shows the shape variation for the t-channel signal and the W+heavy flavour process for the variation of the jet energy scale.
8 Cross-section and R
tmeasurement
To extract R
twe perform a binned maximum-likelihood fit to the entire NN output distribution treating
t-channel top-quark and t-channel top-antiquark production as independent processes. The rates of the
background processes are also fitted within constraints to their expectation and the associated uncertain-
ties. The fit parameters of the likelihood function are scale factors
βjthat multiply the predicted expected
value for each process j, except for the multijet process whose rate is fixed to the value estimated from
the data. Since there is one factor
βjfor each background process, the corresponding background rates
in the
ℓ+and
ℓ−channels are forced to be equal, except for s-channel single top-quark production for
which two parameters, one for top-quark and one for top-antiquark production, are used. The applied
constraints are 60% for W+heavy flavour production, 34% for W+light jets, 60% for the combined
contribution of Z+jets and diboson production, 8.7% for t t ¯ and Wt production and 10% for single top
s-channel production. The likelihood fit is performed in all channels simultaneously. The sensitivity to
Event fraction
0 0.05 0.1
0.15
l+ 2 jets tagged= 7 TeV s Preliminary ATLAS
t-channel (top) JES up JES down
NN output
0 0.2 0.4 0.6 0.8 1
rel. diff.
-0.20.20.40
(a)t-channel top
Event fraction
0 0.05 0.1
0.15
l+ 2 jets tagged= 7 TeV s Preliminary ATLAS
W+heavy flavour JES up JES down
NN output
0 0.2 0.4 0.6 0.8 1
rel. diff.
-0.20.20.40
(b) W+heavy flavour
Figure 7: The normalised shape variation of the NN discriminant for the JES variation in the 2-jets
ℓ+channel, shown for the t-channel top (a) and the W+heavy flavour (b) sample. The nominal shape is shown by the black points. Red denotes the JES shift-up and blue the neural network response for JES shift-down.
the background rates is mostly given by the background dominated region close to zero in the NN output distributions.
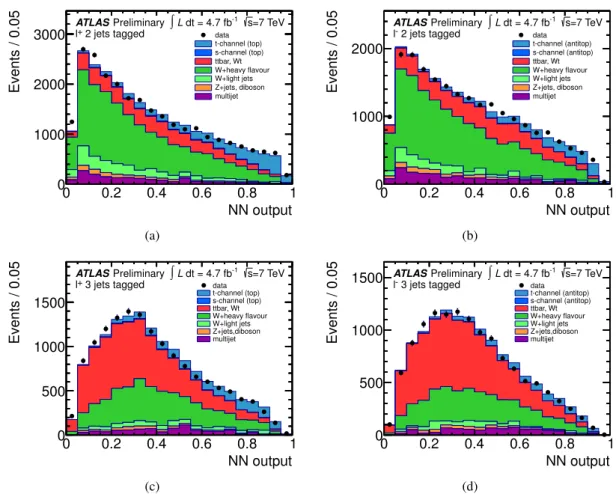
For the observed NN output distribution and the templates of the different processes we find the minimum of the negative log likelihood function for the parameter values shown in Table 4. These estimated values of the parameters are denoted with ˆ
βjfor each process j. In Figure 8 the observed NN output distributions are shown compared to the compound model of signal and background normalised to the fit results of Table 4. The residual differences are covered by the various rate and shape uncertainties of the different processes. The cross-section ratio is then computed as R
t =σt(t)/σ
t(¯ t).
8.1 Estimation of the systematic uncertainties on R
tThe systematic uncertainties on the individual top-quark and top-antiquark cross-section measurements and their ratio are determined using a frequentistic method based on pseudo-experiments that account for variations of the signal acceptance, the background rates and the shape of the NN output. The correlations between the different channels are fully accounted for by applying correlated systematic shifts across all channels. By performing the measurement of the single top-quark and top-antiquark t-channel cross- section on these pseudo-data and computing R
teach time, one obtains an estimator of the probability density of all possible outcomes of the R
tmeasurement. The RMS of this estimator distribution is itself an estimator on the expected uncertainty when performing the pseudo-experiments based on the expected signal and background cross-sections. Using the measured single top-quark and top-antiquark t-channel cross-section and the estimated nuisance parameters one can estimate the uncertainty of the actual measurement.
To estimate the uncertainty of the total t-channel cross-section, the systematic uncertainties of the top-quark and top-antiquark t-channel cross-section measurements are treated as fully correlated, while their statistical uncertainties are added in quadrature.
Table 5 shows a breakdown of the contributions of systematic uncertainties to the uncertainties on
Process
βˆ t channel top 1.27
±0.04 t channel antitop 1.30
±0.06 W+ heavy flavour 1.21
±0.03 W+ light jets 0.74
±0.11 Z+ jets, diboson 1.05
±0.10 t t, ¯ Wt 1.00
±0.02 s channel top 0.98
±0.10 s channel antitop 1.00
±0.10
Table 4: Estimators ˆ
βof the parameters of the likelihood function as obtained from the maximum likeli- hood fit. The quoted uncertainties are statistical only.
NN output
0 0.2 0.4 0.6 0.8 1
Events / 0.05
0 1000 2000
3000 l+ 2 jets tagged
=7 TeV s
-1 dt = 4.7 fb
∫L Preliminary ATLAS
data t-channel (top) s-channel (top) ttbar, Wt W+heavy flavour W+light jets Z+jets, diboson multijet
(a)
NN output
0 0.2 0.4 0.6 0.8 1
Events / 0.05
0 1000 2000
2 jets tagged l-
=7 TeV s
-1 dt = 4.7 fb
∫L Preliminary ATLAS
data t-channel (antitop) s-channel (antitop) ttbar, Wt W+heavy flavour W+light jets Z+jets, diboson multijet
(b)
NN output
0 0.2 0.4 0.6 0.8 1
Events / 0.05
0 500 1000 1500
3 jets tagged l+
=7 TeV s
-1 dt = 4.7 fb
∫L Preliminary ATLAS
data t-channel (top) s-channel (top) ttbar, Wt W+heavy flavour W+light jets Z+jets,diboson multijet
(c)
NN output
0 0.2 0.4 0.6 0.8 1
Events / 0.05
0 500 1000
1500 l- 3 jets tagged
=7 TeV s
-1 dt = 4.7 fb
∫L Preliminary ATLAS
data t-channel (antitop) s-channel (antitop) ttbar, Wt W+heavy flavour W+light jets Z+jets,diboson multijet
(d)
Figure 8: Neural network output distributions normalised to the result of the binned maximum-likelihood fit in (a) the 2-jet tagged
ℓ+data set, (b) the 2-jet tagged
ℓ−data set, (c) the 3-jet tagged
ℓ+data set, and (d) the 3-jet tagged
ℓ−data set.
the cross-section measurements of
σt(t) and
σt(¯ t) and on the cross-section ratio R
t. We provide the
uncertainties evaluated for the observed signal and background rates as obtained from the maximum
Source
∆σt/σt(t) [%]
∆σt/σt(¯ t) [%]
∆Rt/Rt[%]
Data statistics
±3.2
±5.0
±5.5
MC statistics
±2.4
±3.7
±3.7
Multijet normalisation
+1.1/-2.0
+3.1/-4.2
+3.9/-3.7
Other background normalisation
±3.4
±1.3
±4.5
Jet energy scale
±16.4
±19.5
+3.7/-3.6
Jet energy resolution
±3.4
±4.3
±0.8
Jet reconstruction efficiency
+0.7/-0.4
±0.3
+0.8/-0.5 b-tagging efficiency scale-factor
±5.9
±8.5
±2.5
Mistag efficiency scale-factor
±0.8
±2.0
±2.7
b/ b ¯ acceptance
±1.0
±1.0
±0.4
E
missTmodeling
+0.6/-0.9
+0.9/-1.3
+0.8/-0.7
Lepton efficiencies
±2.9
±2.9
±0.3
Lepton energy resolution
+0.5/-0.8
+1.1/-1.4
+1.0/-1.1 Electron energy scale
+0.3/-0.5
+0.7/-0.8
±0.6
3.3
±4.5
+1.1/-1.2
W+jets shape variation
+0.6/-0.5
±0.5
±0.7
Top MC generator
±7.1
±7.1
±0.7
ISR
/FSR
±0.7
±3.5
±4.2
Luminosity
±3.9
±3.9
±0.4
Total Systematic
±20.0
+24.7/-24.9 +11.5/-11.1Total
±20.2
+25.2/-25.4 +12.8/-12.4Table 5: Detailed breakdown of the contribution of each source of uncertainty to the total uncertainty on the measured values of
σt(t),
σt(¯ t), and R
t.
likelihood fit to the observed collision data. The total relative observed uncertainty on R
tis found to be
+13
−12
%.
8.2 Results
After performing the binned maximum likelihood fit and estimating the total uncertainty we extract the results of this analysis. The cross-sections of the top-quark and top-antiquark production in the t-channel and for their cross-section ratio R
tare measured to be:
σt