ATLAS-CONF-2012-132 17September2012
ATLAS NOTE
ATLAS-CONF-2012-132
September 16, 2012
Measurement of t-Channel Single Top-Quark Production in pp Collisions at √
s = 8 TeV with the ATLAS detector
The ATLAS Collaboration
Abstract
We present a measurement of the
t-channel single-top quark production cross-sectionin the lepton+jets channel with 5.8 fb
−1of
√s =
8 TeV
ppcollision data, taken with the ATLAS detector in 2012, using a neural network based discriminant. Selected events con- tain one lepton, missing transverse momentum, and two or three jets, including one which is
b-tagged. The background model includes multijets,W+jets and top quark pair events,with smaller contributions from
Z+jets and diboson events. We show data-background com-parisons for kinematic distributions and measure the
t-channel production cross-section byperforming a combined binned maximum likelihood fit to the neural network output distri- bution for the observed data with two and three jets. The measured
t-channel cross-sectionis
σt =95
±2 (stat.)
±18 (syst.) pb
=95
±18 pb, which is in good agreement with the Standard Model prediction. Using the ratio of the measured to the theoretically predicted cross section and assuming that the top-quark-related CKM matrix elements obey the re- lation
|Vtb| ≫ |Vts|,|Vtd|, the coupling strength at the
W-t-bvertex is determined to be
|Vtb| =
1.04
+0.10−0.11. If it is assumed that
|Vtb| ≤1, a lower limit of
|Vtb| >0.80 is obtained at the 95% CL.
c Copyright 2012 CERN for the benefit of the ATLAS Collaboration.
Reproduction of this article or parts of it is allowed as specified in the CC-BY-3.0 license.
1 Introduction
At the Large Hadron Collider (LHC), top quarks can be produced singly via electroweak, charged-current interactions. The cross-section at
√s
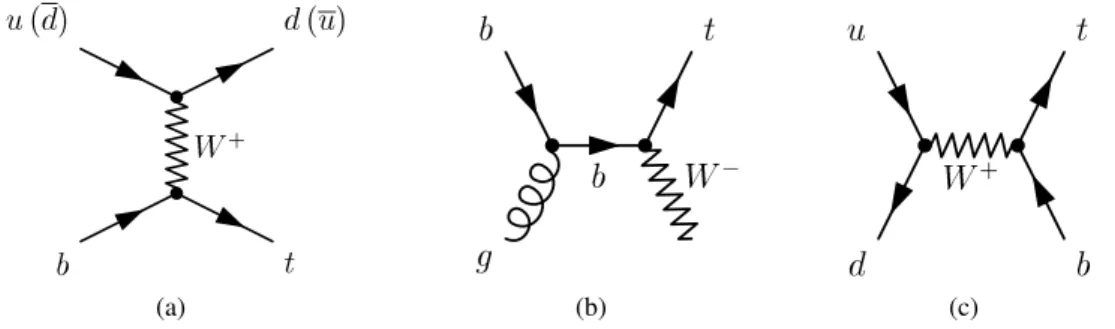
=8 TeV is about half of that for t t ¯ pair production mediated via the strong interaction. There are three relevant single top-quark subprocesses that are distinguished by the virtuality of the exchanged W boson. The dominant process is the t-channel exchange of a virtual W boson, depicted in Figure 1(a). This mode was measured by ATLAS and CMS at
√s
=7 TeV [1–3].
The other two processes are Wt production, shown in Figure 1(b), measured for the first time at the LHC with
√s
=7 TeV [4, 5], and s-channel production, presented in Figure 1(c).
W +
b u(d)
t d(u)
(a)
b W
g
b t
(b)
W +
d u
b t
(c)
Figure 1: Feynman diagrams of single top-quark production processes: (a) t-channel production, (b) associated Wt production, and (c) s-channel production.
The single top-quark final state provides a direct probe of the W-t-b coupling and is sensitive to many models of new physics [6]. The measurement of the production cross-section constrains the absolute value of the quark-mixing matrix element V
tb[7, 8] without assumptions about the number of quark generations. Determining the cross-section also allows the b-quark parton distribution function (PDF) to be measured.
At the LHC, colliding protons at
√s
=8 TeV, the sum of the t and ¯ t cross-sections is predicted at approximate next-to-next-to-leading order (NNLO) to be
σt =87.8
+3.4−1.9
pb [9] for the leading t-channel process,
σWt =22.4
±1.5 pb [10] for Wt associated production, and
σs =5.6
±0.2 pb [11] for the s-channel. The analysis presented in this note considers only the t-channel process as signal, while the other two single top-quark processes are treated as backgrounds, assuming the Standard Model (SM) theoretical cross-sections for these processes.
Events are selected using the semileptonic decay mode of the top quark, where the lepton can be either an electron or a muon originating from the W-boson decay. Fully-hadronic final states are not considered because of the overwhelming multijet background. The analysis also has acceptance for signal events involving W
→τνdecays if the
τlepton subsequently decays to either eν
eντor
µνµντ. The experimental signature of candidate events is thus given by one charged lepton (electron or muon), large missing transverse momentum E
missT, and two or three hadronic jets with high transverse momentum p
T. One of the jets is required to originate from a b-quark which usually comes from the top quark decay.
The acceptance for t-channel events is dominated by the two-jet signature, where one jet is a b-quark jet, while the second jet is a light quark produced together with the top quark, see Fig. 1(a). A significant fraction of single top-quark events are also present in the three-jet bin, where the third jet is produced by initial- or final-state radiation, for example gluon radiation from the initial-state b-quark in Fig. 1(a).
The t t ¯ background becomes dominant in the four-jet bin, thus the analysis only considers the two-jet and three-jet bins.
The most important background for single top-quark processes in the lepton+jets channel is W+jets production. If one of the jets contains heavy-flavour hadrons, these events have the same signature as signal events. Due to possible misidentification of a light jet as a b-quark jet, W+light jets production
1
also contributes to the background. Another important background comes from t t ¯ events, which are difficult to separate from single top-quark events because they contain real top quarks. The next-largest background comes from QCD-multijet production, where a hadronic jet is misidentified as an electron, or a real high- p
Tlepton is produced in the semileptonic decay of a heavy-flavour hadron and passes the lepton isolation criteria. Other smaller backgrounds come from diboson production (WW , WZ, and ZZ) and Z+jets events.
This note is organised as follows. In Section 2 we give an overview of the data samples used and samples of simulated events. The definition of physics objects and the event selection are summarised in Section 3, while Section 4 is dedicated to the background model and the estimation of the background rates. Signal and background discrimination using neural networks (NN) is presented in Section 5.
Section 6 describes the systematic uncertainties considered in the analysis. The measurement of the t- channel single top-quark cross-section and the estimation of the sensitivity and the uncertainties on the measured signal cross-section are discussed in Section 7. The results are summarised in Section 8.
2 Data samples and samples of simulated events
The analysis described in this note uses pp LHC collision data at a centre-of-mass energy of 8 TeV collected with the ATLAS detector [12] between April and June 2012. The ATLAS detector is built from a set of cylindrical subdetectors, which cover almost the full solid angle
1around the interaction point. It is composed of an inner tracking system close to the interaction point, surrounded by a super- conducting solenoid, electromagnetic and hadronic calorimeters, and a muon spectrometer with three superconducting toroidal magnetic systems.
The selected events were recorded based on single electron and single muon triggers. Electron chan- nel events are triggered by requiring a high-p
Telectron. The trigger calorimeter cluster is matched to a track and the trigger electron object is required to have E
T >60 GeV or E
T >24 GeV plus an isola- tion requirement. Muon channel events are collected with a single muon trigger. The triggered events require a muon trigger chamber track, which needs to be matched to a reconstructed muon satisfying p
T>36 GeV, or 24 GeV with an isolation criteria. Stringent detector and data quality requirements are applied, resulting in a dataset corresponding to an integrated luminosity of 5.8
±0.2 fb
−1.
Samples of simulated events for t-channel single top-quark production are produced with the A
c-
erMC program [13] linked to PYTHIA [14] for showering and hadronisation. The CTEQ6L1 [15] set of PDFs is used and the factorisation and renormalisation scales are set to
µR = µF = √ˆ
s, the centre- of-mass energy of the partonic system. Samples for the s-channel and Wt single top-quark production and the t¯ t process are generated using MC@NLO [16]. All processes involving top quarks have the top- quark mass set to 172.5 GeV. Vector boson (W/Z) production in association with jets is simulated using the leading order generator ALPGEN [17], coupled with the CTEQ6L1 set of PDFs [15]. The diboson processes WW , WZ and ZZ are generated using HERWIG [18]. For all background processes the hadro- nisation is performed by HERWIG in connection with the JIMMY [19] underlying event model. After the event generation step, all samples are passed through the full simulation of the ATLAS detector [20]
based on GEANT4 [21] and are then reconstructed using the same procedure as for collision data. The simulation includes the effect of multiple pp collisions per bunch crossing (pile-up) at a variable rate and is weighted to the same number of collisions per bunch crossing as the data. In the dataset used for this analysis the average number of collisions per bunch crossing is 19.3.
1In the right-handed ATLAS coordinate system, the pseudorapidityηis defined asη=−ln[tan(θ/2)], where the polar angle θis measured with respect to the LHC beamline. The azimuthal angleφis measured with respect to thex-axis, which points towards the center of the LHC ring. Thez-axis is parallel to the anti-clockwise beam viewed from above. Transverse momentum and energy are defined aspT=psinθandET=Esinθ, respectively. The∆Rdistance is defined as∆R= p
∆η2+ ∆φ2.
2
3 Object definition and event selection
In this section, we describe the definition of physics objects and the selection criteria for candidate events. Electron candidates are reconstructed using a cluster-based algorithm and are required to have E
T >25 GeV and
|ηcl| <2.47, where
ηcldenotes the pseudorapidity of the calorimeter cluster. Clusters falling in the calorimeter barrel-endcap transition-region, corresponding to 1.37
< |ηcl| <1.52, are ignored. High-quality electron candidates are selected using a set of cuts [22,23] which include stringent requirements on the matching between the track and the calorimeter cluster. Electrons must also be well isolated: the sum of the calorimeter transverse energy within a cone of radius
∆R= p∆η2+ ∆φ2 =
0.2 (excluding the cells associated with the electron) is required to be below a certain threshold that depends on the electron E
T, the electron
ηand the number of reconstructed primary vertices and is chosen such that the efficiency for electrons from W boson decays to pass this isolation requirement is 90%.
In addition, the p
Tof all tracks within a cone of radius
∆R =0.3 around the electron direction, again excluding the track belonging to the electron, is restricted to fall below an E
T-dependent threshold. The efficiency for this track-based isolation requirement is also 90% for electrons from W boson decays. The inefficiencies for the track-based and the calorimetry-based isolation are correlated.
Muon candidates are reconstructed by combining track segments found in the inner detector and in the muon spectrometer. Only candidates which have p
T>25 GeV and
|η|<2.5 are considered. Selected muons must additionally satisfy a series of cuts on the number of track hits present in the various tracking sub-detectors. Muon candidates are also required to be isolated. The sum of the calorimeter transverse energy within a cone of radius
∆R=0.2 and removing the energy deposition of the muon is required to be below 4 GeV, while the p
Tof all tracks within a cone of radius
∆R =0.3 must be below 2.5 GeV.
The efficiency for this combined isolation requirement is between 95% and 97%.
Particle jets are reconstructed using the anti-k
talgorithm [24] with a width parameter of 0.4. The response of the calorimeter is corrected through a p
T- and
η-dependent factor, which is derived fromsimulated events and validated with data. It is applied to each jet to provide an average energy scale correction [25]. Jets overlapping with selected electron candidates within
∆R<0.2 are removed, as in these cases the jet and the electron are very likely to correspond to the same physics object. Only jets having p
T >30 GeV and
|η| <4.5 are considered. To reject jets from pile-up events, a quantity called jet-vertex fraction
ǫjvfis defined as the ratio of
Pp
Tfor all tracks within the jet that originate from the primary vertex associated to the hard-scattering collision to the
Pp
Tof all tracks matched to the jet; it is required that
ǫjvf >0.5 for those jets which have associated tracks.
Jets containing b-quarks are tagged in the region
|η| <2.5 by reconstructing secondary and tertiary vertices from the tracks associated with each jet and combining lifetime related information with a neural network (NN) [26]. The NN combines the outputs of a Kalman filter to find the position of the b- and the c-vertices on a common line giving an approximate flight path for the heavy flavour hadron, a likelihood ratio technique using impact parameter significances and variables describing the topology of the hadron decay chain. The chosen working point, when selecting on the NN discriminant, corresponds to a b- tagging efficiency of about 50%, a light-quark jet rejection rate (reciprocal of the efficiency to b-tag light quarks) of about 350 and a mis-tag efficiency for c-quark jets of 32%, as derived from simulated t t ¯ events.
The value of E
missTis calculated using topological calorimeter clusters and corrected for the presence of electrons, muons, and jets [27].
Candidate events are selected if they contain at least one good primary vertex candidate with at least five associated tracks. Events containing jets with uncalibrated transverse momentum p
T >10 GeV failing reconstruction quality criteria [28] are rejected.
The event selection requires exactly one charged lepton, e or
µ, exactly two or three jets, andE
missT >30 GeV. A trigger matching requirement is applied where the lepton must lie within
∆R<0.15 of its trigger-level object. Since the multijet background is difficult to model precisely, we reduce its con-
3
tribution by computing the transverse mass of the lepton-E
Tmisssystem which resembles the transverse mass of the W boson for W+ jets events:
m
T(W)
= q2 p
T(ℓ)E
missT h1
−cos
∆φℓ,
E
missT iand requiring m
T(W)
>50 GeV.
The “signal region” is defined as events containing one lepton and two or three jets, exactly one of which is b-tagged by the NN b
−tagger. Additionally a “control region” is defined, which has similar kinematics but contains less t-channel signal. Events in the control region pass the signal selection cuts except that all of the jets are required to fail the NN b-tag requirement. In order to keep the flavour composition similar to the signal region, a looser b-tag requirement is made using a b-tag algorithm which has an efficiency of about 85% in t t ¯ simulation samples resulting in an overall tagging efficiency of about 28%.
4 Background estimation
The main backgrounds to the single top-quark final state arise from W boson production in association with jets, top quark pair production and QCD multijet events. Smaller backgrounds originate from Z+jets, Wt-channel and s-channel single top-quark production, and diboson production. These smaller backgrounds and the top quark pair background are modeled using Monte Carlo (MC) simulation and normalised to the corresponding theory predictions.
4.1 Estimation of the multijet background
The multijet background normalisation is obtained using a binned maximum likelihood fit to the E
missTdis- tribution in the data, before applying the E
missTrequirement. A dijet sample simulated with PYTHIA is used for the multijet background, together with templates derived from MC simulation for all other pro- cesses (top, W/Z+jets, dibosons). The multijet template consists of events where the electron requirement in the selection is replaced by a jet requirement (jet-electron model). This jet must have p
T >25 GeV, satisfy the same
|η|cuts as the signal electrons, have
ǫjvf >0.5, and 80-95% of its energy must be de- posited in the electromagnetic section of the calorimeter. The jet must also contain at least four tracks to reduce the contribution from converted photons. To avoid a contamination of the jet-electron sample by W+jets, events are vetoed if they contain one or more leptons that are identified according to high- efficiency but low-purity identification criteria. The same model is also used in the muon channel, as all QCD sensitive distributions are well-described by the model in this channel as well. The electron distri- butions are fitted in two channels, separately for electrons in the endcap (
|η|>1.5) and central (
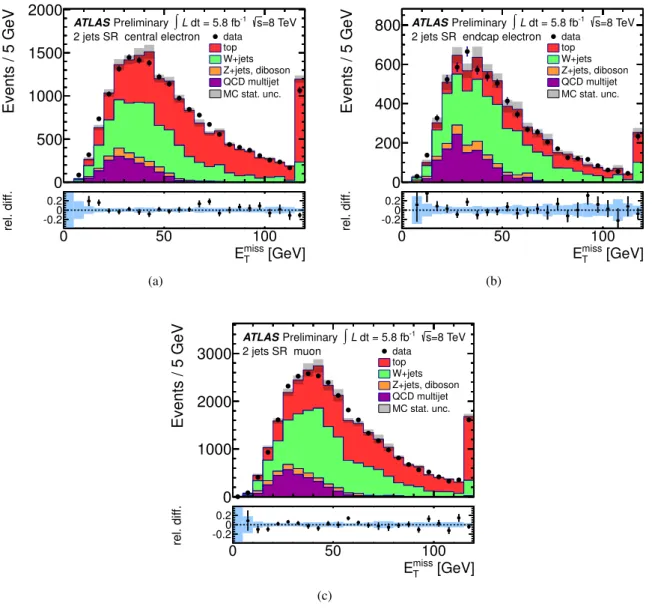
|η|<1.5) region of the electromagnetic calorimeter. The resulting estimates, performed separately for each lepton channel, of the rates and fractions of the multijet background in the tagged datasets are given in Table 1.
The fitted E
missTdistributions in the W
+2 jets signal region leading to these results are shown in Fig. 2.
Based on studies done for
√s
=7 TeV analyses [1, 2] we assign a systematic uncertainty of 50% on the multijet rate. Additionally a comparison in the muon channel with an alternative method, the so-called matrix method, yields good compatibility within the quoted uncertainty. The jet-electron sample is also used to model the multijet kinematics and in the NN fit. All selection cuts are applied, including the requirement of one b-tagged jet.
4.2 Estimation of the W+ jets background
For the backgrounds other than QCD-mulitjet, the expected number of events passing the selection cri- teria is based on the cross-section from a theoretical calculation or the prediction of the MC generator.
4
In the case of the ALPGEN samples, the prediction based on the ALPGEN LO calculation is multiplied with a scale factor of 1.2 for the W
+b b, ¯ W
+c c ¯ and W+light jets samples to correct the prediction to the inclusive NNLO theory calculation with FEWZ [29]. The ALPGEN prediction for the W
+c jets process is then scaled by a factor of 1.52 that is obtained by a study based on NLO calculations using MCFM. The normalisation uncertainties are estimated from the uncertainty in the cross-section of the W/Z
+0 jet process and the uncertainty in the cross-section ratio of W/Z
+(n
+1) jet to W
/Z+n jet.
A cross-section uncertainty of 4% is assigned for the W/Z inclusive process, while ALPGEN parameter variations of the factorisation and renormalisation scale and the matching parameter consistent with ex- perimental data yield an uncertainty on the cross-section ratio of 24% per additional jet [30]. Background contributions from the heavy-quark processes Wb b, ¯ Wc¯ c and Wc have additional relative uncertainties of 50%, estimated using a tag counting method in control regions [1]. For the purpose of plots and the binned likelihood fit the W
+b b, ¯ W
+c c, and ¯ W
+c jets processes are combined and labeled as W+heavy flavour.
4.3 Event yield
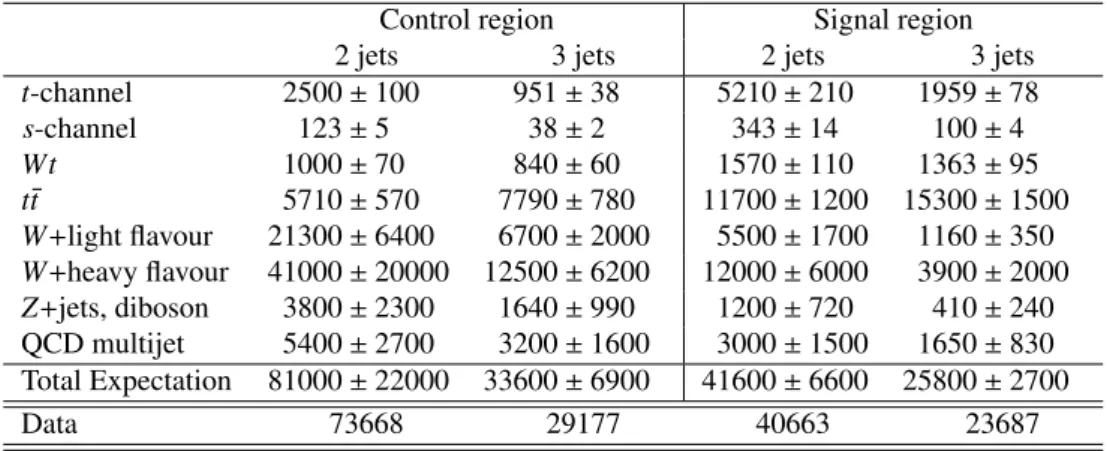
Table 2 lists the event yields after event selection for the signal and control datasets. The observed event yield in data agrees well with the prediction within the systematic uncertainties on the background pre- diction of about 20%. The largest background in the 2-jet dataset is W+jets production which contributes about 60% to the total prediction. For the 3-jet selection the t t ¯ background is the largest component, con- tributing about 50% of the total predicted yield.
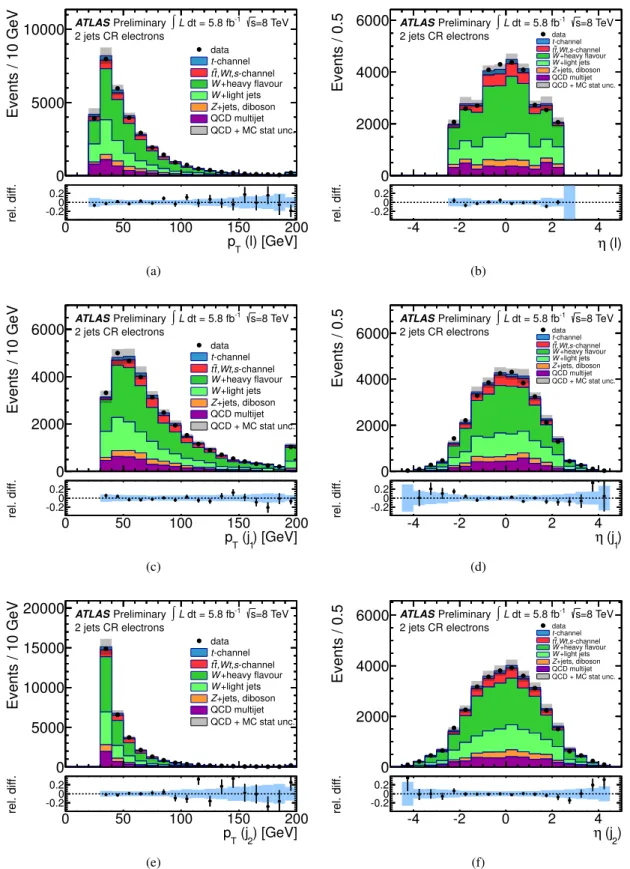
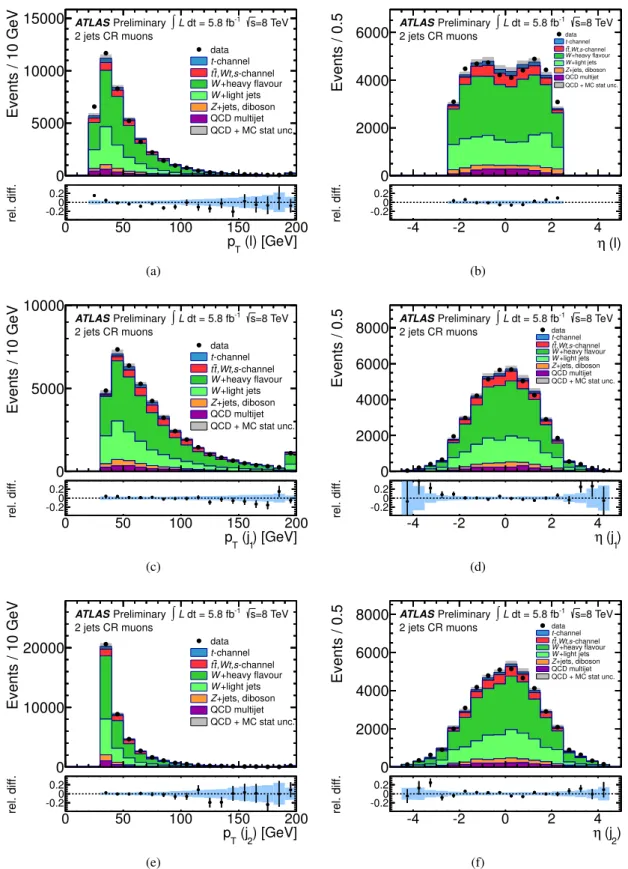
The modelling of basic kinematics is investigated using variables such as the p
Tand
ηof the charged lepton and the jets. As an example we show these distributions in the electron+2 jets control region in Figure 3 and in the muon+2 jets control region in Figure 4, where the MC predictions are normalized to the data (from the jet-electron fit described in Section 4.1). The background models the data well in all studied kinematic variables.
5 Signal and background discrimination
To separate t-channel single top-quark signal events from the expected background we combine several kinematic variables into one discriminant by employing a neural network. A large number of potential input variables have been studied, including kinematic variables of the identified physics objects, but also variables obtained from the reconstruction of the W-boson and the top-quark. In this calculation the transverse momentum of the neutrino is given by the the x- and
y-components of theE
missTvector, while the unmeasured z-component of the neutrino momentum p
z(ν) is inferred by imposing a W-boson mass constraint on the lepton-neutrino system. Since the constraint leads to a quadratic equation for p
z(ν), a two-fold ambiguity arises. In the case of two real solutions, the one with the lower
|p
z|is chosen. In
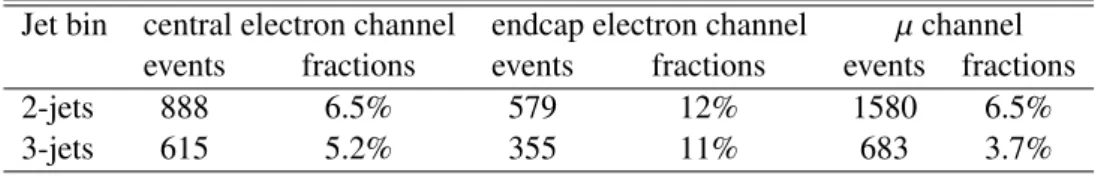
Table 1: Estimated number of events and fractions of the multijet background in different jet bins for events in the central electron+jets, endcap electron+jets and muon+jets datasets in the signal region. An overall uncertainty of 50 % is assigned on these rates.
Jet bin central electron channel endcap electron channel
µchannel events fractions events fractions events fractions
2-jets 888 6.5% 579 12% 1580 6.5%
3-jets 615 5.2% 355 11% 683 3.7%
5
the case of complex solutions which can occur due to the limited E
missTresolution, a fit is performed that rescales the neutrino p
xand p
ysuch that the imaginary radical vanishes and at the same time keeps the transverse components of the neutrino as close as possible to the x- and
y-components ofE
Tmiss.
As a compromise between discrimination power and the need for a manageable number of variables, the 11 highest-ranking variables are chosen in the two-jet and three-jet sample. The variables for the two-jet sample ordered by their discriminating power are:
•
the invariant mass of the b-tagged (b) and untagged ( j) jet in the event m ( jb);
•
the top-quark mass reconstructed from the lepton, the neutrino and the b-tagged jet m (ℓνb);
[GeV]
miss
ET
Events / 5 GeV
0 500 1000 1500 2000
[GeV]
miss
ET
0 50 100
rel. diff.
-0.20.20
2 jets SR central electron Preliminary
ATLAS ∫L dt = 5.8 fb-1 s=8 TeV data
top W+jets Z+jets, diboson QCD multijet MC stat. unc.
(a)
[GeV]
miss
ET
Events / 5 GeV
0 200 400 600 800
[GeV]
miss
ET
0 50 100
rel. diff.
-0.20.20
2 jets SR endcap electron Preliminary
ATLAS ∫L dt = 5.8 fb-1 s=8 TeV data
top W+jets Z+jets, diboson QCD multijet MC stat. unc.
(b)
[GeV]
miss
ET
Events / 5 GeV
0 1000 2000 3000
[GeV]
miss
ET
0 50 100
rel. diff.
-0.20.20
2 jets SR muon Preliminary
ATLAS ∫L dt = 5.8 fb-1 s=8 TeV data
top W+jets Z+jets, diboson QCD multijet MC stat. unc.
(c)
Figure 2: E
Tmissdistributions in the W
+2 jets signal region: (a) central electron channel, (b) endcap electron channel, (c)
µchannel. All processes are normalised to the result of the binned likelihood fit used to determine the fraction of multijet events. The process labelled “top” includes all three single top-quark production modes and t t ¯ production. The bottom panels show the relative difference between observed data and expectation defined as (data-expectation)
/expectation. The blue shaded band reflects the uncertainty from the limited MC statistics.
6
(l) [GeV]
pT
Events / 10 GeV
0 5000 10000
(l) [GeV]
pT
0 50 100 150 200
rel. diff.
-0.20.20
2 jets CR electrons Preliminary
ATLAS ∫L dt = 5.8 fb-1 s=8 TeV
data -channel t
-channel ,Wt,s t t
+heavy flavour W
+light jets W
+jets, diboson Z
QCD multijet QCD + MC stat unc.
(a)
η (l)
Events / 0.5
0 2000 4000 6000
η (l)
-4 -2 0 2 4
rel. diff.
-0.20.20
2 jets CR electrons Preliminary
ATLAS ∫L dt = 5.8 fb-1 s=8 TeV
data -channel t
-channel ,Wt,s t t
+heavy flavour W
+light jets W
+jets, diboson Z QCD multijet QCD + MC stat unc.
(b)
) [GeV]
(j1
pT
Events / 10 GeV
0 2000 4000 6000
) [GeV]
(j1
pT
0 50 100 150 200
rel. diff.
-0.20.20
2 jets CR electrons Preliminary
ATLAS ∫L dt = 5.8 fb-1 s=8 TeV
data -channel t
-channel ,Wt,s t t
+heavy flavour W
+light jets W
+jets, diboson Z
QCD multijet QCD + MC stat unc.
(c)
1) η (j
Events / 0.5
0 2000 4000 6000
1) η (j
-4 -2 0 2 4
rel. diff.
-0.20.20
2 jets CR electrons Preliminary
ATLAS ∫L dt = 5.8 fb-1 s=8 TeV
data -channel t
-channel ,Wt,s t t
+heavy flavour W
+light jets W
+jets, diboson Z QCD multijet QCD + MC stat unc.
(d)
) [GeV]
(j2
pT
Events / 10 GeV
0 5000 10000 15000 20000
) [GeV]
(j2
pT
0 50 100 150 200
rel. diff.
-0.20.20
2 jets CR electrons Preliminary
ATLAS ∫L dt = 5.8 fb-1 s=8 TeV
data -channel t
-channel ,Wt,s t t
+heavy flavour W
+light jets W
+jets, diboson Z
QCD multijet QCD + MC stat unc.
(e)
2) η (j
Events / 0.5
0 2000 4000 6000
2) η (j
-4 -2 0 2 4
rel. diff.
-0.20.20
2 jets CR electrons Preliminary
ATLAS ∫L dt = 5.8 fb-1 s=8 TeV
data -channel t
-channel ,Wt,s t t
+heavy flavour W
+light jets W
+jets, diboson Z QCD multijet QCD + MC stat unc.
(f)
Figure 3: Distributions of basic kinematic quantities in the electron+2 jets control region. The observed data are compared to the compound model consisting of simulated events and the jet-electron sample to model the multijet background. The uncertainty band represents the rate uncertainty of the QCD multijet estimation of 50%. The panels show the (a) p
Tand (b)
ηof the electron, (c) p
Tand (d)
ηof the leading jet and, (e) p
Tand (f)
ηof the sub-leading jet. All processes are normalised to the result of the binned maximum likelihood fit used to determine the fraction of QCD multijet events. The bottom panels show the relative difference between observed data and expectation. The blue shaded band reflects the uncertainty from the limited MC statistics and the uncertainty on the QCD multijet normalisation.
7
(l) [GeV]
pT
Events / 10 GeV
0 5000 10000 15000
(l) [GeV]
pT
0 50 100 150 200
rel. diff.
-0.20.20
2 jets CR muons Preliminary
ATLAS ∫L dt = 5.8 fb-1 s=8 TeV
data -channel t
-channel ,Wt,s t t
+heavy flavour W
+light jets W
+jets, diboson Z
QCD multijet QCD + MC stat unc.
(a)
η (l)
Events / 0.5
0 2000 4000 6000
η (l)
-4 -2 0 2 4
rel. diff.
-0.20.20
2 jets CR muons Preliminary
ATLAS ∫L dt = 5.8 fb-1 s=8 TeV
data -channel t
-channel ,Wt,s t t
+heavy flavour W
+light jets W
+jets, diboson Z QCD multijet QCD + MC stat unc.
(b)
) [GeV]
(j1
pT
Events / 10 GeV
0 5000 10000
) [GeV]
(j1
pT
0 50 100 150 200
rel. diff.
-0.20.20
2 jets CR muons Preliminary
ATLAS ∫L dt = 5.8 fb-1 s=8 TeV
data -channel t
-channel ,Wt,s t t
+heavy flavour W
+light jets W
+jets, diboson Z
QCD multijet QCD + MC stat unc.
(c)
1) η (j
Events / 0.5
0 2000 4000 6000 8000
1) η (j
-4 -2 0 2 4
rel. diff.
-0.20.20
2 jets CR muons Preliminary
ATLAS ∫L dt = 5.8 fb-1 s=8 TeV
data -channel t
-channel ,Wt,s t t
+heavy flavour W
+light jets W
+jets, diboson Z QCD multijet QCD + MC stat unc.
(d)
) [GeV]
(j2
pT
Events / 10 GeV
0 10000 20000
) [GeV]
(j2
pT
0 50 100 150 200
rel. diff.
-0.20.20
2 jets CR muons Preliminary
ATLAS ∫L dt = 5.8 fb-1 s=8 TeV
data -channel t
-channel ,Wt,s t t
+heavy flavour W
+light jets W
+jets, diboson Z
QCD multijet QCD + MC stat unc.
(e)
2) η (j
Events / 0.5
0 2000 4000 6000 8000
2) η (j
-4 -2 0 2 4
rel. diff.
-0.20.20
2 jets CR muons Preliminary
ATLAS ∫L dt = 5.8 fb-1 s=8 TeV
data -channel t
-channel ,Wt,s t t
+heavy flavour W
+light jets W
+jets, diboson Z QCD multijet QCD + MC stat unc.
(f)
Figure 4: Distributions of basic kinematic quantities in the muon+2 jets control region. The observed data are compared to the compound model consisting of simulated events and the jet-electron sample to model the QCD multijet background. The uncertainty band represents the rate uncertainty of the multijet estimation of 50%. The panels show (a) p
Tand (b)
ηof the muon, (c) p
Tand (d)
ηof the leading jet and, (e) p
Tand (f)
ηof the sub-leading jet. All processes are normalised to the result of the binned maximum likelihood fit used to determine the fraction of QCD multijet events. The bottom panels show the relative difference between observed data and expectation. The blue shaded band reflects the uncertainty from the limited MC statistics and the uncertainty on the QCD multijet normalisation.
8
Table 2: Predicted and observed event yield for the control and signal regions with 2 and 3 jets. For all processes the cross section predicted by the SM is used. The multijet estimation and its uncertainty is derived from the jet-electron model. All other expectations and their uncertainties are derived using theoretical cross-sections. Additional scale factors to match the heavy flavour jets content in collision data are not applied.
Control region Signal region
2 jets 3 jets 2 jets 3 jets
t-channel 2500±100 951±38 5210±210 1959±78
s-channel 123±5 38±2 343±14 100±4
Wt 1000±70 840±60 1570±110 1363±95
tt¯ 5710±570 7790±780 11700±1200 15300±1500 W+light flavour 21300±6400 6700±2000 5500±1700 1160±350 W+heavy flavour 41000±20000 12500±6200 12000±6000 3900±2000 Z+jets, diboson 3800±2300 1640±990 1200±720 410±240 QCD multijet 5400±2700 3200±1600 3000±1500 1650±830 Total Expectation 81000±22000 33600±6900 41600±6600 25800±2700
Data 73668 29177 40663 23687
•
the absolute value of
ηof the light (untagged) jet
|η( j)
|;
•
the transverse mass of the W-boson reconstructed from the charged lepton and missing transverse momentum m
T(ℓν);
•
the pseudorapidity of the W-boson reconstructed from the charged lepton and missing transverse momentum
η(ℓν);
•
the invariant mass of the lepton (ℓ) and the b-tagged jet m (ℓb);
•
the scalar sum of the transverse momenta of the jets, the lepton and the missing transverse mo- mentum H
T(ℓ, jets, E
missT);
•
the
∆Rof the untagged ( j) jet and the W-boson reconstructed from the charged lepton and missing transverse momentum
|∆R( j, ℓν)
|;
•
the absolute value of
ηof the tagged jet (b) in the event
|η(b)
|;
•
the pseudorapidity of the top-quark, which is reconstructed from the charged lepton, b-quark jet and missing transverse momentum
η(ℓνb).
•
the invariant mass of the four-vector of the b-tagged jet m (b);
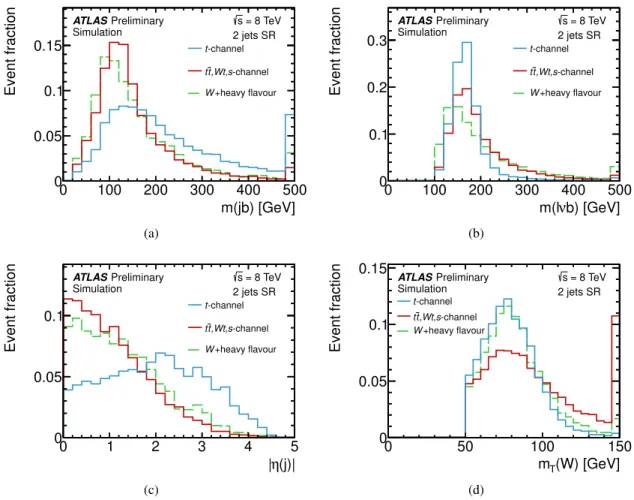
Figure 5 compares the shapes of the four most important variables between the signal and different background contributions for the two-jet sample. The 11 variables for the three-jet sample, ordered by their discriminating power, are:
•
the invariant mass of the two leading jets m ( j
1j
2);
•
the scalar sum of the transverse momenta of the jets, the lepton and the missing transverse mo- mentum H
T(ℓ, jets, E
missT);
9
m(jb) [GeV]
0 100 200 300 400 500
Event fraction
0 0.05 0.1
0.15 t-channel
-channel ,Wt,s t t
+heavy flavour W
2 jets SR Preliminary
ATLAS Simulation
= 8 TeV s
(a)
b) [GeV]
ν m(l
0 100 200 300 400 500
Event fraction
0 0.1 0.2
0.3 t-channel
-channel ,Wt,s t t
+heavy flavour W
2 jets SR Preliminary
ATLAS Simulation
= 8 TeV s
(b)
η(j)|
|
0 1 2 3 4 5
Event fraction
0 0.05
0.1 t-channel
-channel ,Wt,s t t
+heavy flavour W
2 jets SR Preliminary
ATLAS Simulation
= 8 TeV s
(c)
(W) [GeV]
mT
0 50 100 150
Event fraction
0 0.05 0.1 0.15
-channel t
-channel ,Wt,s t t
+heavy flavour W
2 jets SR Preliminary
ATLAS Simulation
= 8 TeV s
(d)
Figure 5: Distributions of the four most important discriminating variables for the two-jet sample: (a) invariant mass of the jet pair, (b) reconstructed top-quark mass, (c) the absolute value of
ηof the untagged jet, and (d) the transverse mass of the W-boson. The signal shape is shown together with the shape of the two largest backgrounds. Each shape is normalized to unit area.
•
the invariant mass of the leading jet j
1and the jet j
3with the lowest p
Tpresent in the event m ( j
1j
3);
•
the absolute value of the difference in
ηof the second j
2and third j
3leading jet
|∆η( j
2,j
3)
|;
•
the invariant mass of the lepton (ℓ) and the b-tagged jet m (ℓb);
•
the sum of
ηof all jets present in the event
P3 i=1η(j
i);
•
the absolute value of the difference in
ηof the lepton (ℓ) and the b-tagged jet
|∆η(ℓ, b)
|;
•
the
ηof the untagged jet with the lowest p
Tin the event
|η( j
u2)
|;
•
the
ηof the untagged jet with the highest p
Tin the event
|η( j
u1)
|;
•
the pseudorapidity of the top-quark, which is reconstructed from the charged lepton, b-quark jet and missing transverse momentum
η(ℓνb).
•
the
∆Rof the untagged ( j
u2) jet with the lowest p
Tand the b-tagged jet
∆R( j
u2,b);
10
) [GeV]
j2
m(j1
0 100 200 300 400 500
Event fraction
0 0.05 0.1 0.15
-channel t
-channel ,Wt,s t t
+heavy flavour W
3 jets SR Preliminary
ATLAS Simulation
= 8 TeV s
(a)
) [GeV]
miss
(l,jets,ET
HT
0 200 400 600 800
Event fraction
0 0.05 0.1 0.15 0.2
-channel t
-channel ,Wt,s t t
+heavy flavour W
3 jets SR Preliminary
ATLAS Simulation
= 8 TeV s
(b)
) [GeV]
j3
m(j1
0 100 200 300 400 500
Event fraction
0 0.05 0.1
0.15 t-channel
-channel ,Wt,s t t
+heavy flavour W
3 jets SR Preliminary
ATLAS Simulation
= 8 TeV s
(c)
3)|
2,j η(j
∆
|
0 2 4 6
Event fraction
0 0.05 0.1
0.15 t-channel
-channel ,Wt,s t t
+heavy flavour W
3 jets SR Preliminary
ATLAS Simulation
= 8 TeV s
(d)
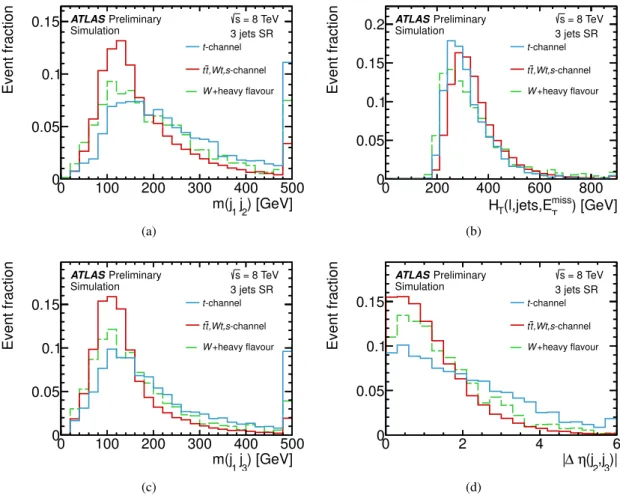
Figure 6: Distributions of the four most important discriminating variables in the three jet bin: (a) invariant mass of the two leading jets, (b) the scalar sum of the transverse momenta of the jets, the lepton and the missing transverse momentum, (c) the invariant mass of the leading jet j
1and the jet j
3with the lowest p
Tpresent in the event and (b) the absolute value of the difference in
ηof the second j
2and third j
3leading jet. The signal shape is shown together with the shape of the two largest backgrounds. Each shape is normalised to unit area.
Figure 6 compares the shapes of the four most important variables between the signal and different background contributions for the three-jet sample.
5.1 Neural network training
This analysis uses the NeuroBayes [31, 32] tool which combines a three-layer feed-forward NN with complex preprocessing of the input variables. NeuroBayes uses Bayesian regularisation techniques for the training process. The network infrastructure consists of one input node for each input variable plus one bias node, an arbitrary, user-defined number of hidden nodes, and one output node which gives a continuous output in the interval [0, 1]. In this specific case we use 15 nodes in the hidden layer and the ratio of signal to background events in the training was chosen to be 50:50, where the different background processes are weighted according to their number of expected events. For the training of the NN only the MC simulated events are used. Background events from the multijet model are not used in the network training.
The training of the NNs is done independently in the two-jet and three-jet samples. The shape of the
11
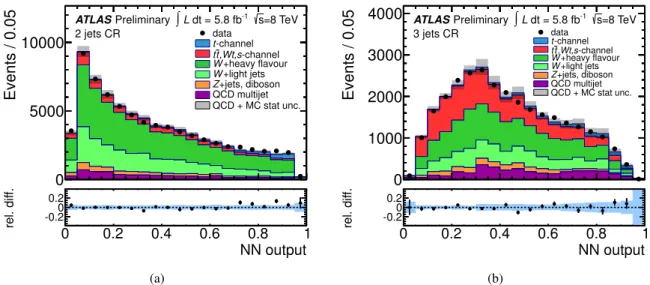
resulting NN output distributions for the signal and the two largest backgrounds are shown in Figures 7(a) and (b). The data distributions are compared to the prediction in the control regions in Figures 8(a) and (b).
NN output
0 0.2 0.4 0.6 0.8 1
Event fraction
0 0.05 0.1 0.15 0.2
-channel t
-channel ,Wt,s t t
+heavy flavour W
2 jets SR Preliminary
ATLAS Simulation
= 8 TeV s
(a)
NN output
0 0.2 0.4 0.6 0.8 1
Event fraction
0 0.05 0.1 0.15
-channel t
-channel ,Wt,s t t
+heavy flavour W
3 jets SR Preliminary
ATLAS Simulation
= 8 TeV s
(b)
Figure 7: Distributions of the NN output in the two-jet and three-jet samples. The distributions for signal and the two most important backgrounds normalised to unit area are shown in (a) for the two-jet samples and (b) for the three-jet samples.
NN output
Events / 0.05
0 5000 10000
NN output
0 0.2 0.4 0.6 0.8 1
rel. diff.
-0.20.20
2 jets CR Preliminary
ATLAS ∫L dt = 5.8 fb-1 s=8 TeV data
-channel t
-channel ,Wt,s t t
+heavy flavour W
+light jets W
+jets, diboson Z
QCD multijet QCD + MC stat unc.
(a)
NN output
Events / 0.05
0 1000 2000 3000 4000
NN output
0 0.2 0.4 0.6 0.8 1
rel. diff.
-0.20.20
3 jets CR Preliminary
ATLAS ∫L dt = 5.8 fb-1 s=8 TeV data-channel t
-channel ,Wt,s t
t +heavy flavour W
+light jets W
+jets, diboson Z
QCD multijet QCD + MC stat unc.
(b)
Figure 8: Distributions of the neural network output. The result of the application of the NNs to the control region is shown in (a) for the two-jet sample and in (b) for the three-jet samples. Here the overall MC model expectation is scaled to the number of observed data events, respecting the relative normalisation between the different processes. The bottom panels show the relative difference between observed data and expectation. The blue shaded band reflects the uncertainty from the limited MC statistics and the uncertainty on the QCD multijet normalisation.
12
6 Systematic uncertainties
Systematic uncertainties on the normalisation of the individual backgrounds and on the signal acceptance as well as uncertainties on the shape of the individual predictions affect the measured single top-quark t- channel cross-section. Both rate and shape uncertainties are taken into account by generating correlated pseudo-experiments. The impact of the systematic uncertainties on the t-channel cross-section mea- surement is estimated from these pseudo-experiments. The uncertainties can be split into the following categories:
Object modelling
Systematic uncertainties for the reconstruction and energy calibration of jets, elec- trons and muons are propagated through the analysis. The main source of object modelling uncertainty comes from the jet energy scale, including the modelling of pile-up, as well as b-jet identification. Other components include lepton energy scale and lepton and jet identification efficiencies. The jet energy scale (JES) uncertainty has been evaluated using 2010 ATLAS data [25]. Additional contributions to this uncertainty due to the larger pile-up effects in 2012 data are included and range from less than 2% to 7%
as a function of jet p
Tand
η. Forb-quark induced jets, an additional flavour-specific jet energy scale un- certainty of 0.8% to 2.5%, depending on the jet p
T, is added in quadrature to the JES uncertainty. Scale factors, determined from collision data, are applied to correct the b-tagging performance in simulated events to match the data. Both b-jets and c-jets in simulation use the same tagging scale factors with uncertainties that depend on the p
Tand
ηof the jet. The uncertainties on the scale factors vary from 10%
to 20% for b- and c-quark jets [26, 33], while for light jets the mis-tagging uncertainty ranges from 20%
to 40% as a function of jet p
Tand
η[34]. Additionally scale factors are applied to each jet to correct the jet vertex fraction to match the data. Other minor uncertainties are assigned to the reconstruction of E
missTand to account for the impact of pile-up collisions on E
missT.
Monte Carlo generators
Systematic uncertainties arising from the modelling of the single top signal and the t t ¯ background are taken into account. The largest contributions come from the amount of initial- state and final-state radiation, estimated using dedicated A
cerMC samples interfaced to PYTHIA where parameters controlling the ISR/FSR emission are varied up and down in accordance with data [35]. Un- certainties arising from differences in the modeling of the parton shower and hadronization, are estimated by changing the models between PYTHIA and HERWIG in t t ¯ events.
The uncertainty due to the choice of the single top t-channel signal generator is estimated from the difference between A
cerMC and MCFM [36] based on a parton-level study. For the W+jets background a shape uncertainty is assigned based on the variation of the choices of the matching scale and of the functional form of the factorisation scale in ALPGEN. The impact of using simulation samples of limited size is also taken into account.
The systematic uncertainties related to the parton distribution functions are taken into account for all single top-quark processes and for t¯ t production. The events are reweighted according to each of the PDF uncertainty eigenvectors. The uncertainties are calculated using the formula given in Equa- tion 43 of Ref. [37]. We take the envelope of the estimated uncertainties for the CT10 PDF set, the MSTW2008nlo [38] PDF set and the NNPDF2.0 [39] as final PDF uncertainty. The rate uncertainties are between 3% and 6%.
Background normalisation
The t t, single top ¯ Wt- and s-channel backgrounds are normalised to their theory predictions, to which we assign uncertainties of 10% [40], 7% [10] and 4% [11], respectively. The uncertainty on the combined Z+jets and diboson background is 10% with an additional heavy flavour uncertainty for Z+jets of 50%, while the uncertainties of the W+jets backgrounds are 34% for W+light jets and 60% for W
+heavy flavour jets, as detailed in Section 4.2. Additionally an uncertainty on the
13
relative fraction of two to three jet events of 24% is applied. The multijet background estimate has an uncertainty of 50%.
Luminosity
The uncertainty on the integrated luminosity is 3.6%. It was estimated using the tech- niques described in Reference [41].
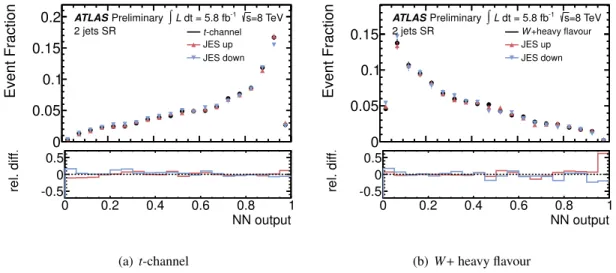
The systematic uncertainties discussed above cause variations in the signal acceptance, the back- ground rates and the shape of the neural network output distribution. As an example, Figure 9 shows the shape variation for the t-channel signal and W+heavy flavour process due to the variation of the jet energy scale.
Event Fraction
0 0.05 0.1 0.15 0.2
2 jets SR Preliminary
ATLAS ∫L dt = 5.8 fb-1 s=8 TeV -channel t JES up JES down
NN output
0 0.2 0.4 0.6 0.8 1
rel. diff.
-0.5 0 0.5
(a)t-channel
Event Fraction
0 0.05 0.1
0.15 2 jets SR
Preliminary
ATLAS ∫L dt = 5.8 fb-1 s=8 TeV +heavy flavour W
JES up JES down
NN output
0 0.2 0.4 0.6 0.8 1
rel. diff.
-0.5 0 0.5
(b)W+heavy flavour
Figure 9: Shape variation of the NN discriminant for the JES uncertainty in the two-jet signal region, (a) for the t-channel and (b) the W+heavy flavour sample. The bottom panel shows the relative difference between the distribution of the systematic variation and the central sample.
7 Cross-section measurement
A binned maximum-likelihood fit to the NN output distribution is performed simultaneously for the two-jet and three-jet samples to extract the t-channel single top-quark cross-secion. The rates of the background processes are also fitted within their uncertainties. The fit parameters of the likelihood function are scale factors
βjthat multiply the expected value for each process j, except for the multijet process whose rate is fixed to the value estimated from data. The background normalisation constraints are 60% for W+heavy flavour production, 34% for W+light jets, 10% for the combined contribution of Z+jets and diboson production, 10% for top backgrounds (t t, ¯ Wt and s-channel). The background rates are determined by the background-dominated region close to zero in the NN output distributions.
The fit finds the minimum of the negative log likelihood function for the parameter values shown in Table 3. Figure 10 compares the observed NN output distributions to the compound model of signal and background with each contribution normalised to the fit results from Table 3. The model agrees with the data very well, with residual differences covered by the various rate and shape uncertainties. Sep- arate fits in the two-jet and three-jet sample yield compatible fit parameters within the large systematic uncertainties of the measurement in the three-jet sample due to the dominating t t ¯ contribution.
14
Table 3: Estimators ˆ
βof the parameters of the likelihood function as obtained from the maximum like- lihood fit to data. The ˆ
βare scale factors that multiply the expected rate for each process. The quoted uncertainties are statistical only.
Process
βˆ
t channel 1.08
±0.03 W+ heavy flavour 1.04
±0.03 W+ light jets 0.93
±0.04 Z+ jets, diboson 0.94
±0.10 t¯ t, Wt, s channel 0.88
±0.01
NN output
Events / 0.05
0 2000 4000 6000
NN output
0 0.2 0.4 0.6 0.8 1
rel. diff.
-0.20.20
2 jets SR Preliminary
ATLAS ∫L dt = 5.8 fb-1 s=8 TeV data
-channel t
-channel ,Wt,s t t
+heavy flavour W
+light jets W
+jets, diboson Z
QCD multijet QCD + MC stat unc.
(a)
NN output
Events / 0.05
0 1000 2000 3000
NN output
0 0.2 0.4 0.6 0.8 1
rel. diff.
-0.20.20
3 jets SR Preliminary
ATLAS ∫L dt = 5.8 fb-1 s=8 TeV data
-channel t
-channel ,Wt,s t t
+heavy flavour W
+light jets W
+jets, diboson Z
QCD multijet QCD + MC stat unc.
(b)
Figure 10: Neural network output distributions (a) for the two-jet sample and (b) for the three-jet sam- ple. The signal and backgrounds are normalised to the fit result. The bottom panels show the relative difference between observed data and expectation. The blue shaded band reflects the uncertainty from the limited MC statistics and the uncertainty on the QCD multijet normalisation.
7.1 Estimation of the systematic uncertainties
The systematic uncertainties on the cross-section measurement are determined using a frequentist method based on pseudo-experiments that accounts for variations of the signal acceptance, the background rates and the shape of the NN output. The correlations between the different analysis channels are fully accounted for by applying correlated systematic shifts across all channels. The RMS of the distribution of fit results for the pseudo-datasets is an estimator for the expected uncertainty. The systematic uncertainty on the measured parameters is similarly estimated using the measured
βvalues for the single top-quark t-channel signal and the backgrounds.
Table 4 shows the contributions to the total uncertainty on the cross-section measurement. The table provides the uncertainties evaluated for the observed signal and background rates as obtained from the maximum likelihood fit to the observed collision data. The total relative uncertainty on the measured cross-section
σtis
±19%.
15
Table 4: Detailed breakdown of the contribution of each source of uncertainty to the total uncertainty on the signal cross-section
σt.
Source
∆σt/σt[%]
Data statistics
±2.4
MC statistics
±2.9
Background normalisation
±1.5 QCD multijet normalisation
±3.1
Jet energy scale
±7.7
Jet energy resolution
±3.0
Jet reconstruction
±0.5
Jet vertex fraction
±1.6
Mistag modeling
±0.3
c-tagging efficiency
±0.4 b-tagging efficiency
±8.5
E
missT ±2.3
Lepton efficiencies
±4.1 Lepton energy resolution
±2.2 Lepton energy scale
±2.1
2.8
W+jets shape variation
±0.3 W+jets extrapolation
±0.6 t-channel generator
±7.1
t t ¯ generator
±3.3
ISR
/FSR
±9.1
Parton shower
±0.8
Luminosity
±3.6
Total systematic
±18.8
Total
±19.0
7.2 Cross-section results and V
tbmeasurement
After performing the binned maximum likelihood fit and estimating the total uncertainty we derive the results for this analysis. The cross-section of t-channel single top-quark production is measured to be
σt(t)
=95.1
±2.4 (stat.)
±18.0 (syst.) pb
=95.1
±18.1 pb.
Single top-quark production in the t-channel proceeds via a W-t-b vertex and the measured cross- section is proportional to
|V
tb·f
|2, where V
tbis the relevant CKM matrix element and f is the coupling.
In the Standard Model f is one and
|V
tb|is close to one, but new physics contributions could alter its value significantly. The
|V
tb|measurement is independent of assumptions about the number of quark generations or about the unitarity of the CKM matrix. The only assumptions required are that
|V
tb| ≫|