ATLAS-CONF-2013-097 15September2013
ATLAS NOTE
ATLAS-CONF-2013-097
September 13, 2013
Measurement of the t t ¯ production cross-section in pp collisions at
√ s = 8 TeV using eµ events with b-tagged jets
The ATLAS Collaboration
Abstract
This note describes a measurement of the inclusive top-pair production cross-section (σ
t¯t) with the full 2012 ATLAS data sample of 20.3 fb
−1of proton-proton collision data at a centre-of-mass energy of
√s=
8 TeV, using
t¯tevents with an opposite-sign
eµpair in the final state. Jets containing
bquarks were tagged using an algorithm based on track impact parameters and reconstructed secondary vertices. The numbers of events with exactly one and exactly two
b-tagged jets were counted and used to simultaneously determineσt¯tand the efficiency to reconstruct and
b-tag a jet from a top quark decay, thereby minimising theassociated systematic uncertainties. The cross-section was measured to be:
σtt¯=
237.7
±1.7 (stat)
±7.4 (syst)
±7.4 (lumi)
±4.0 (beam energy) pb,
where the four uncertainties arise from data statistics, experimental and theoretical system- atic effects, the integrated luminosity, and the LHC beam energy, giving a total relative uncertainty of 4.8 %. The result is consistent with recent theoretical QCD calculations at next-to-next-to-leading order.
c
Copyright 2013 CERN for the benefit of the ATLAS Collaboration.
Reproduction of this article or parts of it is allowed as specified in the CC-BY-3.0 license.
1 Introduction
The top quark is the heaviest known fundamental particle, with a mass (m
top) that is much larger than any of the other quarks, and close to the scale of electroweak symmetry breaking. The study of its production and decay properties forms a core part of the ATLAS physics programme at the CERN Large Hadron Collider (LHC). At the LHC, top quarks are primarily produced in quark-antiquark pairs (t¯ t), and the precise prediction of the corresponding inclusive cross-section (σ
t¯t) is a substantial challenge for QCD calculational techniques, as well as being sensitive to the gluon parton density function (PDF), the top quark mass, and potential enhancements due to physics beyond the Standard Model.
Calculations of
σt¯tat hadron colliders are now available at full next-to-next-to-leading order (NNLO) accuracy, including the resummation of next-to-next-to-leading logarithmic (NNLL) soft gluon terms [1].
At a centre-of-mass energy of
√s
=8 TeV and assuming m
top =172.5 GeV, these calculations give a prediction of 252.9
±11.7
+−8.66.4pb, where the first uncertainty is due to PDF and
αsuncertainties, and the second to QCD scale uncertainties. This value has been calculated using the
top++ 2.0program [2].
The PDF and
αsuncertainties were calculated using the PDF4LHC prescription [3] with the MSTW2008 68 % CL NNLO [4], CT10 NNLO [5, 6] and NNPDF2.3 5f FFN [7] PDF sets, and added in quadrature to the scale uncertainty to give a final value of 252.9
+13.3−14.5pb. The NNLO+NNLL cross-section value is about 3 % larger than the exact NNLO prediction, as implemented in
Hathor1.5 [8].
Within the Standard Model, the top quark decays almost exclusively to a W boson and a b quark, so the final-state topologies in t¯ t production are governed by the decay modes of the two W bosons. This document describes a measurement in the dileptonic eµ channel, t¯ t
→WbWb
→e
+µ−ννbb, selecting ¯ events with an opposite-sign eµ pair,
1and one or two hadronic jets from the b quarks. Jets originating from b quarks were identified (‘tagged’) using a b-tagging algorithm exploiting the long lifetime, high decay multiplicity, hard fragmentation and high mass of B hadrons. The rates of events with an eµ pair and one or two tagged b-jets were used to measure simultaneously the t¯ t production cross-section and the combined probability to reconstruct and b-tag a b-jet from a top-quark decay. Events with electrons or muons produced via leptonically decaying taus, t
→Wb
→τνb→e/µνννb, were included as part of the t¯ t signal. The main background is Wt, the associated production of a W boson and a single top quark.
Other background contributions arise from Z
→ττ→eµ
+jets production, diboson+jets production andevents where one reconstructed lepton does not arise from a W or Z decay.
The data and Monte Carlo simulation samples are described in Section 2, followed by the object and event selection in Section 3, and the extraction of the t¯ t cross-section in Section 4. Systematic uncertainties are discussed in Section 5, followed by additional studies and checks in Section 6, and a summary and conclusion are given in Section 7.
2 Data and simulation samples
The ATLAS detector [9] at the LHC covers nearly the entire solid angle around the collision point, and consists of an inner tracking detector surrounded by a thin superconducting solenoid magnet producing a 2 T axial magnetic field, electromagnetic and hadronic calorimeters, and an external muon spectrometer incorporating three large toroid magnet assemblies. The inner detector consists of a high-granularity silicon pixel detector and a silicon microstrip tracker, together providing precision tracking in the range
|η|<
2.5,
2complemented by a transition radiation tracker providing tracking and electron identification
1Charge-conjugate modes are implied throughout.
2ATLAS uses a right-handed coordinate system with its origin at the nominal interaction point in the centre of the detector, and thezaxis along the beam line. Pseudorapidity is defined in terms of the polar angleθasη=−ln tanθ/2, and transverse momentum and energy are defined relative to the beamline aspT =psinθandET =Esinθ. The azimuthal angle around the beam line is denoted byφ, and distances in (η, φ) space by∆R= p
∆η2+ ∆φ2.
information for
|η| <2.0. A lead liquid-argon (LAr) electromagnetic calorimeter covers the region
|η| <
3.2, and hadronic calorimetry is provided by steel
/scintillating tile calorimeters for
|η| <1.7 and copper/LAr hadronic endcap calorimeters. The forward region is covered by additional LAr calorimeters with copper and tungsten absorbers. The muon spectrometer consists of precision tracking chambers covering the region
|η| <2.7, and separate trigger chambers covering
|η| <2.4. A three-level trigger system, using custom hardware followed by two software-based levels, is used to reduce the event rate to about 400 Hz for offline storage.
The analysis was performed on the complete ATLAS 2012
√s
=8 TeV proton-proton collision data sample, corresponding to an integrated luminosity of 20.3 fb
−1after the application of detector status and data quality requirements. Events were required to pass either a single electron or single muon trigger, with thresholds set to be fully e
fficient for leptons with p
T >25 GeV passing o
ffline selections. Due to the high instantaneous luminosities achieved by the LHC in 2012, each triggered event also includes the signals from typically 10–30 additional inelastic pp collisions in the same bunch crossing (pileup).
Monte Carlo simulated event samples were used to develop the analysis, to compare to the data and to evaluate signal and background e
fficiencies and uncertainties. Samples were processed either through the full ATLAS detector simulation [10] based on GEANT4 [11], or through a faster simulation making use of parameterised showers in the calorimeters [12]. Additional simulated pp collisions generated with P
8 [13] were overlaid to simulate the e
ffects of both in- and out-of-time pileup, from additional pp collisions in the same and nearby bunch crossings. All simulated events were then processed using the same reconstruction algorithms and analysis chain as the data, and small corrections were applied to lepton trigger and reconstruction e
fficiencies to better model the response seen in data.
The baseline t¯ t full simulation sample was produced using the next-to-leading-order (NLO) matrix element generator P
[14] interfaced to P
6 [15] with the Perugia 2011C tune (P2011C) [16], and CT10 PDFs [5], including all t¯ t final states involving at least one lepton. The Standard Model expectation of 0.1082 was assumed for the W
→`νbranching ratio [17], and m
topwas set to 172.5 GeV.
Alternative t¯ t samples were produced with MC@NLO [18] interfaced to H
[19] with J
[20]
for the underlying event modelling, with the ATLAS AUET2 [21] tune and CT10 PDFs, and with the leading-order multileg generatorA [22] interfaced to H and J, with the CTEQ6L1 PDFs [23] and including t¯ t final states with up to three additional partons.
Backgrounds were classified into two types: those with two real prompt leptons from W or Z decays (including those produced via leptonic tau decays), and those where at least one of the reconstructed lep- ton candidates is misidentified or ‘fake’, i.e. a non-prompt lepton from the decay of a bottom or charm hadron, an electron from a photon conversion in a jet, hadronic jet activity misidentified as an electron, or a muon produced from an in-flight decay of a pion or kaon. The first category with two prompt leptons in- cludes Wt single top production, modelled using P
+P
6 with the CT10 PDFs and the P2011C tune, Z
→ ττ+jets modelled using A
+P
6 with CTEQ6L1 PDFs and P2011C, and diboson (WW, WZ, ZZ) production in association with jets, modelled using A+H. Backgrounds with one real and one fake lepton include t¯ t events where one W boson decays hadronically, W
+jets produc-tion, modelled as for Z
+jets, and t-channel single top production, modelled using A
MC [24] inter- faced to P6 with CTEQ6L1 PDFs. Other backgrounds, including processes with two fake leptons, are negligible for the event selections used in this analysis.
3 Object and event selection
This analysis makes use of reconstructed electrons, muons and b-tagged jets. Electron candidates were reconstructed from an isolated electromagnetic calorimeter energy deposit matched to an inner detec- tor track and passing tight identification requirements [25], with transverse energy E
T >25 GeV and pseudorapidity
|η| <2.47. Candidates within the transition region between the barrel and endcap elec-
2
tromagnetic calorimeters, 1.37
< |η| <1.52, were removed. Isolation requirements were used to reduce background from non-prompt electrons. The calorimeter transverse energy within a cone of
∆R
<0.2 and the scalar sum of track p
Twithin
∆R
<0.3 were each required to be smaller than E
Tand
η-dependentthresholds calibrated to separately give nominal selection efficiencies of 98 % for prompt electrons from Z
→ee decays.
Muon candidates were reconstructed by combining matching tracks reconstructed in both the inner detector and muon spectrometer, and required to satisfy p
T >25 GeV and
|η| <2.5. They were also required to satisfy the isolation requirement I
<0.05, where I is the ratio of the sum of track p
Tin a variable-sized cone of radius
∆R
=10 GeV/ p
µTto the transverse momentum p
µTof the muon [26]. This isolation requirement has a 97 % selection efficiency for prompt muons from Z
→µµdecays.
Jets were reconstructed using the anti-k
talgorithm [27] with radius parameter R
=0.4, starting from calorimeter energy clusters calibrated using the local cluster weighting method [28], and corrected for the effects of pileup as described in Ref. [29]. Jets were calibrated using an energy- and
η-dependentsimulation-based calibration scheme, with in-situ corrections based on data [30], and required to satisfy p
T >25 GeV and
|η| <2.5. To suppress the contribution from low-p
Tjets originating from pileup interactions, the jet vertex fraction requirement described in Ref. [29] was applied: jets with p
T <50 GeV and
|η|<2.4 were required to have at least half of the scalar sum of p
Tof tracks associated to the jet coming from tracks associated to the event primary vertex. The latter was defined as the reconstructed vertex with the highest sum of associated track p
2T. Finally, to remove non-isolated leptons likely to have come from heavy-flavour decays inside jets, electrons and muons within
∆R
<0.4 of selected jets were also discarded.
Jets were b-tagged as likely to have originated from b quarks using the MV1 algorithm, a multivariate discriminant making use of track impact parameters and reconstructed secondary vertices [31, 32]. Jets were defined to be b-tagged if the MV1 discriminant value was larger than a threshold corresponding approximately to a 70 % efficiency for tagging b-quark jets from top decays in t¯ t events, with a rejection factor of about 140 against light quark and gluon jets, and about five against jets originating from charm quarks.
Events were required to have at least one reconstructed primary vertex with at least five associated tracks, and no jets failing jet quality and timing requirements. Events with muons compatible with cosmic ray interactions and muons undergoing catastrophic bremsstrahlung in the detector material were also removed. A preselection requiring exactly one electron and one muon selected as described above was then applied, with at least one of the leptons being matched to an electron or muon object triggering the event. Events with an opposite-sign eµ pair constituted the main analysis sample, whilst events with a same-sign eµ pair were used in the estimation of the background from misidentified leptons.
4 Extraction of the t t ¯ cross-section
The t¯ t production cross-section
σt¯twas determined by counting the numbers of opposite-sign eµ events with exactly one (N
1) and exactly two (N
2) b-tagged jets, ignoring any untagged jets which may be present, due e.g. to light-quark or gluon jets from QCD radiation or b-jets from top decays which were not tagged. The two event counts can be expressed as:
N
1 =Lσ
t¯t eµ2
b(1
−C
bb)
+N
1bkgN
2 =Lσ
t¯t eµC
bb2+N
2bkg(1)
where L is the integrated luminosity of the sample and
eµthe e
fficiency for a t¯ t event to pass the opposite-
sign eµ preselection. The combined probability for a jet from the quark q in the t
→Wq decay to fall
within the acceptance of the detector, be reconstructed as a jet with transverse momentum above the
Event counts N
1N
2Data 21559 11682
Wt single top 2070
±220 360
±120
Dibosons 120
±90 3
+6−3Z(→
ττ→eµ)+jets 210
±10 8
±1 Misidentified leptons 240
±70 110
±60 Total background 2640
±250 480
±140
Table 1: Observed numbers of opposite-sign eµ events with one and two b-tagged jets (N
1and N
2), to- gether with the estimates of non-t¯ t backgrounds and associated total uncertainties described in Section 5.
selection threshold, and be tagged as a b-jet, is denoted by
b. Although this quark is almost always a b quark,
bthus also accounts for the approximately 0.2 % of top quarks that decay to W s or Wd rather than Wb, slightly reducing the effective tagging efficiency. If the decays of the two top quarks and the subsequent reconstruction of the two b-tagged jets are completely independent, the probability to tag both b-jets
bbis given by
bb =b2. In practice, small correlations are present for both kinematic and instrumental reasons, and these are taken into account via the tagging correlation C
b, defined as C
b = bb/b2, or equivalently C
b =4N
eµtt¯N
2tt¯/(N1t¯t+2N
2t¯t)
2, where N
eµt¯tis the number of preselected eµ t¯ t events and N
1t¯tand N
2t¯tare the numbers of events with one and two b-tagged jets. This correlation term also accounts for the effect on N
1and N
2of the small number of mistagged light quark or gluon jets from radiation in the t¯ t events. Background from sources other than t¯ t
→eµννb b ¯ also contributes to the event counts N
1and N
2, and is given by the background terms N
1bkgand N
2bkg. The preselection e
fficiency
eµand tagging correlation C
bwere taken from t¯ t event simulation, and the background contributions N
1bkgand N
2bkgwere estimated using a combination of simulation and data-based methods, allowing the two equations (1) to be solved yielding
σt¯tand
b.
A total of 66119 events passed the eµ opposite-sign preselection in data. Table 1 shows the number of events with one and two b-tagged jets, together with the estimates of non-t¯ t background and their systematic uncertainties discussed in detail below. The sample with one b-tagged jet is expected to be about 89 % pure in t¯ t events, with the dominant background coming from Wt single top production, and smaller contributions from events with misidentified leptons, Z
+jets and dibosons. The sample with two b-tagged jets is expected to be about 96% pure in t¯ t events, with Wt production again being the dominant background.
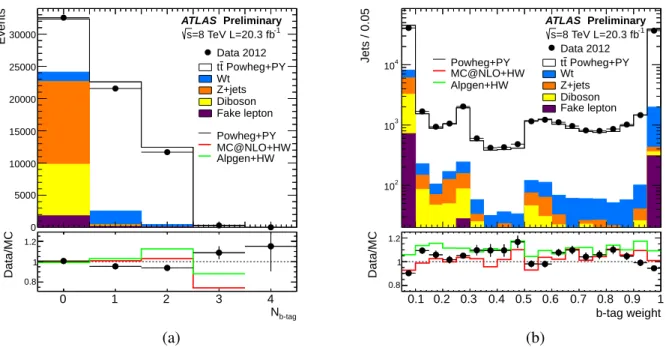
The distributions of the number of b-tagged jets and the b-tagging weight in opposite-sign eµ events are shown in Figure 1, and compared to the expectations with several t¯ t simulation samples, normalised using the theoretical prediction of 252.9 pb for the t¯ t cross-section at
√s
=8 TeV. Distributions of the number of jets, the jet p
T, and the electron and muon
|η|and p
Tare shown for opposite-sign eµ events with at least one b-tagged jet in Figure 2, with the simulation normalised to the same number of events as the data. In general, the agreement between data and simulation is good, within the modelling and instrumental uncertainties of the analysis.
The value of
σtt¯extracted from equation (1) is directly sensitive to the assumed value of
eµ, with (dσ
t¯t/deµ)/(σ
tt¯/eµ)
=−1. The value of
eµwas determined from simulation to be about 0.8 %, including the t¯ t
→eµννb b ¯ branching ratio, and uncertainties on
eµtranslate directly into uncertainties on
σt¯t. Similarly,
σtt¯is directly sensitive to the value of C
b, also determined from simulation, but with the opposite sign, (dσ
t¯t/dCb)/(σ
t¯t/Cb)
=1. The systematic uncertainties on these quantities are discussed in Section 5.
With the kinematic cuts and b-tagging working point chosen for this analysis, the sensitivities of
σt¯tto the knowledge of the backgrounds N
1bkgand N
2bkgare given by (dσ
t¯t/dN1bkg)/(σ
t¯t/N1bkg)
=−0.13 and
4
b-tag
N
-0.5 0 0.5 1 1.5 2 2.5 3 3.5 4 4.5
Events
0 5000 10000 15000 20000 25000 30000
ATLAS Preliminary
=8 TeV L=20.3 fb-1
s
Data 2012 Powheg+PY t
t Wt Z+jets Diboson Fake lepton Powheg+PY MC@NLO+HW Alpgen+HW
b-tag
N
0 1 2 3 4
Data/MC
0.8 1 1.2
(a)
b-tag weight
0.1 0.2 0.3 0.4 0.5 0.6 0.7 0.8 0.9 1
Jets / 0.05
102
103
104
ATLAS Preliminary
=8 TeV L=20.3 fb-1
s
Data 2012 Powheg+PY t
t Wt Z+jets Diboson Fake lepton Powheg+PY
MC@NLO+HW Alpgen+HW
b-tag weight 0.1 0.2 0.3 0.4 0.5 0.6 0.7 0.8 0.9 1
Data/MC
0.8 1 1.2
(b)
Figure 1: Distributions of (a) the number of b-tagged jets, and (b) the b-tag weight (also requiring the event to have at least two jets), in preselected opposite-sign eµ events. The data are shown compared to the expectation from simulation, broken down into contributions from t¯ t, Wt single top, Z
+jets, dibosons,and events with fake electrons or muons, normalised to the same integrated luminosity as the data. The lower parts of the figure show the ratios of data to the baseline prediction using P
+P
(PY) for the t¯ t signal, and the ratios of the predictions with the other t¯ t samples using MC@NLO+H (HW) and A
+H
to the baseline prediction.
(dσ
t¯t/dN2bkg)/(σ
tt¯/N2bkg)
=−0.004. The fitted cross-section is therefore most sensitive to the systematicuncertainties on N
1bkg, whilst for the b-tagging working point chosen for the analysis, the measurement of N
2serves mainly to constrain the combined jet reconstruction and b-tagging e
fficiency
b. As discussed in Section 6, consistent results were also obtained at di
fferent b-tagging e
fficiency working points, that induce greater sensitivity to the background estimate in the two b-tag sample.
The Wt single top background was estimated from simulation using P
+P
with the P2011C tune, normalised to the approximate NNLO cross-section of 22.37
±1.52 pb determined as in Ref. [33].
The diboson background was similarly estimated using A+H, normalised to the NLO QCD inclusive cross-section predictions calculated with MCFM [34].
The Z
+jets background (with Z
→ττ→eµ) was estimated from simulation using A
+P
, scaled by the ratios of Z
→µµ+jets measured in data and simulation. The ratio was evaluated separatelyin the one and two b-tag event bins. This scaling eliminates uncertainties due to the simulation modelling of jets (especially heavy-flavour jets) produced in association with the Z bosons. The data
/simulation ratios were measured in events with exactly two opposite-sign muons passing the selections given in Section 3 and one or two b-tagged jets, by fitting the dimuon invariant mass distributions in the range 60–120 GeV and accounting for the backgrounds from t¯ t production and fake leptons. The resulting scale factors were determined to be 1.43
±0.07 and 1.21
±0.09 for the one and two b-tag backgrounds, where the systematic uncertainties were derived from a comparison of the Z
→µµresults with those obtained using the same fit technique in Z
→ee events, which have di
fferent backgrounds.
The background from events with one real and one fake lepton was estimated using a combination
of data and simulation. Simulation studies show that the samples with a same-sign eµ pair and one
Njet
0 1 2 3 4 5 6
Events
0 2000 4000 6000 8000 10000 12000
14000 ATLAS Preliminary
=8 TeV L=20.3 fb-1
s
Data 2012 Powheg+PY t
t Wt Z+jets Diboson Fake lepton Powheg+PY MC@NLO+HW Alpgen+HW
Njet
0 1 2 3 4 5 6
Data/MC
0.70.8 0.91 1.1 1.2 1.3
(a)
[GeV]
Jet pT
0 50 100 150 200 250
Jets / 10 GeV
0 2000 4000 6000 8000 10000 12000
ATLAS Preliminary
=8 TeV L=20.3 fb-1
s
Data 2012 Powheg+PY t
t Wt Z+jets Diboson Fake lepton Powheg+PY MC@NLO+HW Alpgen+HW
[GeV]
Jet pT
0 50 100 150 200 250
Data/MC
0.8 1 1.2
(b)
η| Electron |
0 0.5 1 1.5 2 2.5
Events / 0.25
0 1000 2000 3000 4000 5000 6000
ATLAS Preliminary
=8 TeV L=20.3 fb-1
s
Data 2012 Powheg+PY t
t Wt Z+jets Diboson Fake lepton Powheg+PY MC@NLO+HW Alpgen+HW
η| Electron |
0 0.5 1 1.5 2 2.5
Data/MC
0.9 1 1.1
(c)
[GeV]
Electron pT
0 20 40 60 80 100 120 140 160 180 200
Events / 10 GeV
0 1000 2000 3000 4000 5000 6000 7000
ATLAS Preliminary
=8 TeV L=20.3 fb-1
s
Data 2012 Powheg+PY t
t Wt Z+jets Diboson Fake lepton Powheg+PY MC@NLO+HW Alpgen+HW
[GeV]
Electron pT
0 20 40 60 80 100 120 140 160 180 200
Data/MC
0.8 1 1.2
(d)
η| Muon |
0 0.5 1 1.5 2 2.5
Events / 0.25
0 1000 2000 3000 4000 5000
ATLAS Preliminary
=8 TeV L=20.3 fb-1
s
Data 2012 Powheg+PY t
t Wt Z+jets Diboson Fake lepton Powheg+PY MC@NLO+HW Alpgen+HW
η| Muon |
0 0.5 1 1.5 2 2.5
Data/MC
0.9 1 1.1
(e)
[GeV]
Muon pT
0 20 40 60 80 100 120 140 160 180 200
Events / 10 GeV
0 1000 2000 3000 4000 5000 6000
7000 ATLAS Preliminary
=8 TeV L=20.3 fb-1
s
Data 2012 Powheg+PY t
t Wt Z+jets Diboson Fake lepton Powheg+PY MC@NLO+HW Alpgen+HW
[GeV]
Muon pT
0 20 40 60 80 100 120 140 160 180 200
Data/MC
0.8 1 1.2
(f)
Figure 2: Distributions of (a) the number of jets, (b) the transverse momentum p
Tof the jets, (c) the
|η|of the electron, (d) the p
Tof the electron, (e) the
|η|of the muon and (f) the p
Tof the muon, in events with an opposite-sign eµ pair and at least one b-tagged jet. The data are compared to the expectation from simulation, broken down into contributions from t¯ t, single top, Z
+jets, dibosons, and events with fake electrons or muons, normalised to the same number of entries as the data. The lower parts of the figures show the ratios of data to the baseline prediction with P
+P
, and the ratios of the predictions with the other t¯ t generators to the baseline prediction. The last histogram bin includes the overflow.
6
Component OS 1b SS 1b (OS
/SS) 1b OS 2b SS 2b (OS
/SS) 2b Heavy-flavour e 32
±3 24
±3 1.35
±0.23 5
±1 2
±1 2.15
±0.85 Conversion e 139
±9 127
±10 1.09
±0.11 79
±5 55
±4 1.43
±0.13
Other e 17.4
±7.3 0.4
±0.3 - 4.8
±1.1 0.2
±0.2 -
Heavy-flavour
µ25
±5 18
±3 1.38
±0.37 2
±1 3
±1 0.95
±0.45
Other
µ2.3
±1.1 0.7
±0.4 - 0.8
±0.4 0.0
±0.0 -
Total fake 215
±14 170
±11 1.26
±0.09 92
±5 60
±4 1.52
±0.09
Wrong-sign prompt - 32
±3 - - 11
±2 -
Right-sign prompt - 19
±2 - - 0
±0 -
Total - 221
±12 - - 71
±4 -
Data - 240 - - 83 -
Table 2: Breakdown of expected fake-lepton event contributions to the one (1b) and two (2b) b-tag opposite and same-sign (OS and SS) eµ event samples, together with the opposite- to same-sign ratios for contributions from heavy flavour and photon conversions, and for all fake lepton categories combined.
For the same-sign samples, the contributions from wrong- and right-sign prompt lepton contributions are also shown, and the total expectations are compared to the data. The uncertainties shown are due to limited simulation statistics.
or two b-tagged jets are dominated by events with fake leptons, with rates comparable to those in the opposite-sign sample. The contributions of fake-lepton events were therefore estimated using the same- sign event counts in data after subtraction of the estimated non-fake same-sign contributions, multiplied by the opposite- to same-sign fake-lepton ratios predicted from simulation. This procedure is illustrated in Table 2, which shows the expected numbers of fake-lepton events in opposite- and same-sign samples.
The contributions where the electron is fake, coming from the decay of a heavy-flavour hadron, a photon conversion or other sources (such as a misidentified hadron within a jet), and where the muon is fake, coming either from heavy-flavour decay or other sources (e.g. decay in flight of a pion or kaon) are shown separately. In all samples, the dominant fake lepton contribution comes from photon conversions giving electron candidates. The opposite- to same-sign ratios R
j =N
fake,OSj /Nfake,SSjfor events with j
=1 and 2 b-tagged jets were evaluated from simulation to be R
1=1.26 and R
2=1.52, with systematic uncertainties of 25 % and 50 %. These uncertainties were derived considering the different R
jvalues observed in simulation for individual components of the fake-lepton background, and possible variations in the background composition. Table 2 also shows the contributions to the same-sign samples of events with two prompt leptons, divided into ‘wrong-sign’ events where the charge of the electron has been misreconstructed, dominated by genuine t¯ t
→eµννb b, and ‘right-sign’ events, dominated by diboson ¯ production with two like-sign W bosons. A 50 % uncertainty was conservatively assigned to the prompt lepton contribution, based on studies of the simulation modelling of the electron charge-misidentification probability in data [25] and uncertainties in the rates of contributing physics processes.
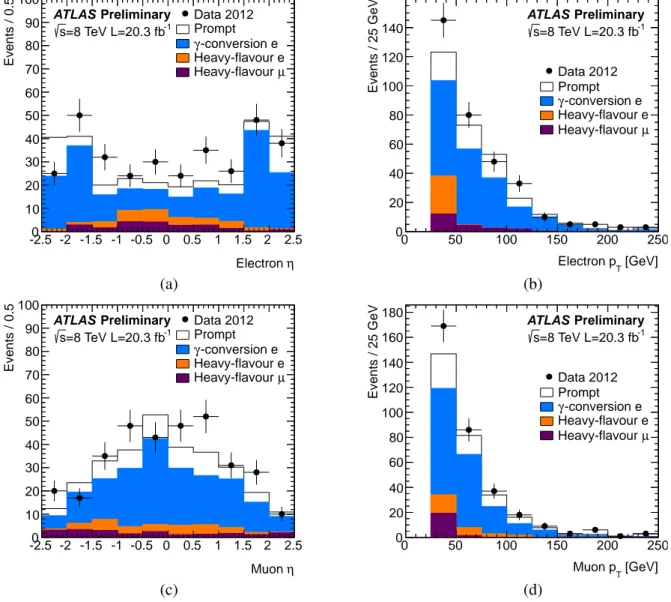
The simulation modelling of the different components of the fake-lepton background was checked by studying kinematic distributions of same-sign events, as illustrated for the
ηand p
Tdistributions of the leptons in Figure 3. The simulation generally models the shapes of distributions well in both one and two b-tag events, and agrees with the overall same-sign rates in data within about 20 %. The simulation modelling was further tested in control samples with relaxed electron or muon isolation requirements to enhance the relative contributions of electrons or muons from heavy-flavour decays, and similar levels of agreement were seen.
Combining the estimates of
eµand C
bfrom the baseline P+P simulation, the estimates
of the background N
1bkgand N
2bkgshown in Table 1 and the data integrated luminosity of 20.3 fb
−1, the t¯ t
η Electron -2.5 -2 -1.5 -1 -0.5 0 0.5 1 1.5 2 2.5
Events / 0.5
0 10 20 30 40 50 60 70 80 90 100
ATLAS Preliminary
=8 TeV L=20.3 fb-1
s
Data 2012 Prompt
-conversion e γ
Heavy-flavour e µ Heavy-flavour
(a)
[GeV]
Electron pT
0 50 100 150 200 250
Events / 25 GeV
0 20 40 60 80 100 120 140
ATLAS Preliminary
=8 TeV L=20.3 fb-1
s
Data 2012 Prompt
-conversion e γ
Heavy-flavour e µ Heavy-flavour
(b)
η Muon -2.5 -2 -1.5 -1 -0.5 0 0.5 1 1.5 2 2.5
Events / 0.5
0 10 20 30 40 50 60 70 80 90 100
ATLAS Preliminary
=8 TeV L=20.3 fb-1
s
Data 2012 Prompt
-conversion e γ
Heavy-flavour e µ Heavy-flavour
(c)
[GeV]
Muon pT
0 50 100 150 200 250
Events / 25 GeV
0 20 40 60 80 100 120 140 160
180 ATLAS Preliminary
=8 TeV L=20.3 fb-1
s
Data 2012 Prompt
-conversion e γ
Heavy-flavour e µ Heavy-flavour
(d)
Figure 3: Distributions of electron and muon
ηand p
Tin same-sign eµ events with at least one b-tagged jet. The simulation prediction is normalised to the same integrated luminosity as the data, and broken down into contributions where both leptons are prompt, or one is a fake lepton from a photon conversion or heavy-flavour decay. In the p
Tdistributions, the last histogram bin includes the overflows.
cross-section was determined by solving equation (1) numerically to be:
σtt¯=
237.7
±1.7 pb,
where the uncertainty quoted is due to data statistics only. The product of jet reconstruction and b-tagging e
fficiencies
bwas measured to be 0.540
±0.003, compared to 0.543
±0.001 in simulation.
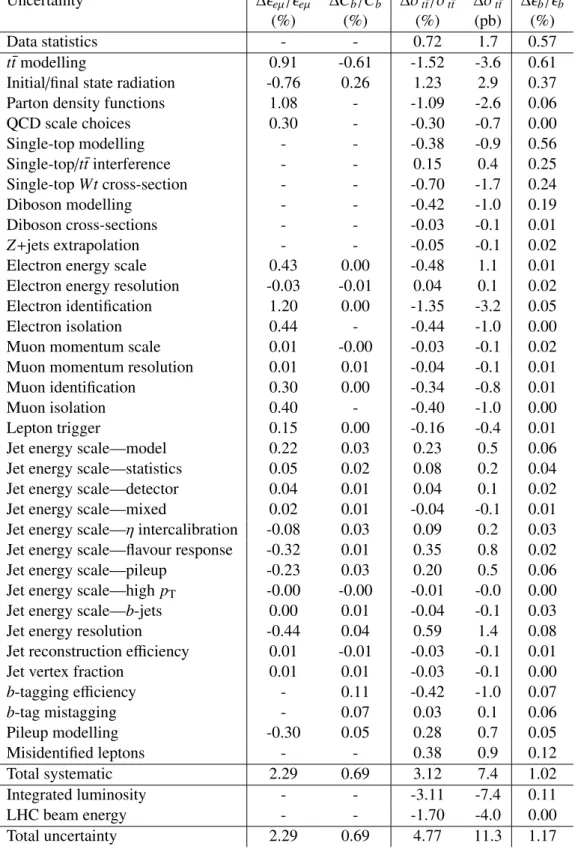
5 Systematic uncertainties
The systematic uncertainties on the extracted cross-section
σt¯tand
bare shown in Table 3, together with their e
ffects (where relevant) on the t¯ t preselection e
fficiency
eµand tagging correlation C
b. Each source of uncertainty was evaluated by repeating the fit with all relevant input parameters simultane- ously changed by
±1 standard deviation. Systematic correlations between input parameters (in particular8
Uncertainty
∆eµ/eµ ∆C
b/Cb ∆σt¯t/σt¯t ∆σt¯t ∆b/b(%) (%) (%) (pb) (%)
Data statistics - - 0.72 1.7 0.57
t¯ t modelling 0.91 -0.61 1.52 3.6 0.61
Initial/final state radiation -0.76 0.26 1.23 2.9 0.37
Parton density functions 1.08 - 1.09 2.6 0.06
QCD scale choices 0.30 - 0.30 0.7 0.00
Single-top modelling - - 0.38 0.9 0.56
Single-top
/t¯ t interference - - 0.15 0.4 0.25
Single-top Wt cross-section - - 0.70 1.7 0.24
Diboson modelling - - 0.42 1.0 0.19
Diboson cross-sections - - 0.03 0.1 0.01
Z
+jets extrapolation - - 0.05 0.1 0.02
Electron energy scale/resolution 0.43 0.01 0.48 1.1 0.03 Electron identification
/isolation 1.28 0.00 1.42 3.4 0.05 Muon momentum scale
/resolution 0.01 0.01 0.05 0.1 0.02 Muon identification/isolation 0.50 0.00 0.52 1.2 0.01
Lepton trigger 0.15 0.00 0.16 0.4 0.01
Jet energy scale 0.46 0.07 0.49 1.2 0.11
Jet energy resolution -0.44 0.04 0.59 1.4 0.08
Jet reconstruction
/vertex fraction 0.02 0.01 0.04 0.1 0.01
b-tagging - 0.13 0.42 1.0 0.09
Pileup modelling -0.30 0.05 0.28 0.7 0.05
Misidentified leptons - - 0.38 0.9 0.12
Total systematic 2.29 0.69 3.12 7.4 1.02
Integrated luminosity - - 3.11 7.4 0.11
LHC beam energy - - 1.70 4.0 0.00
Total uncertainty 2.29 0.69 4.77 11.3 1.17
Table 3: Summary of the statistical, systematic and total uncertainties on the t¯ t production cross-section
σtt¯and the combined jet reconstruction and b-tagging e
fficiency
b. The systematic uncertainties on the eµ preselection efficiency
eµand the tagging correlation C
bare also shown, with relative signs given where relevant. The sign definitions are given in the text.
significant anti-correlations between
eµand C
bwhich contribute with opposite signs to
σtt¯) were thus taken into account. The total uncertainties on
σt¯tand
bwere calculated by adding the e
ffects of all the individual systematic components in quadrature, assuming them to be independent. The sources of systematic uncertainty are discussed in more detail below.
t¯ t
modelling:Uncertainties on
eµand C
bdue to the simulation of t¯ t events were assessed as the dif-
ferences between the predictions of the baseline P
+P
sample and one generated using
MC@NLO+H, thus varying both the hard-scattering event generator and the fragmentation
and hadronisation model. The MC@NLO
+H
sample gave a larger value of
eµbut a smaller
value of C
b, as shown in Table 3. Additional comparisons of P
+P
samples with the
AUET2 rather than P2011C tune and with P+H, i.e. changing only the fragmenta-
tion/hadronisation model, gave smaller uncertainties. The A
+H
sample gave a value of
eµ1.9 % higher than that of P
+P
, due largely to a more central predicted
ηdistribu-
tion for the leptons. However, this sample uses a leading-order generator and PDFs, and gives an
inferior description of the electron and muon
ηdistributions (see Figures 2(c) and (e)), so was not
used to set the systematic uncertainty on
eµ. The A
+H
prediction for C
bis close to that from P
+P
, within the uncertainty set by the comparison to MC@NLO
+H
.
Initial/final state radiation:The estimates of
eµand C
bare sensitive to the amount of extra radiation
in t¯ t events through the lepton isolation and lepton-jet separation cuts, and changes in kinematic distributions. The effects were evaluated by taking half the difference between the predictions of two simulation samples generated with A
MC
+P
, with two tunes whose parameters span the variations compatible with ATLAS studies of additional jet activity in t¯ t events [35]. The tune with more jet activity gives a smaller
eµand larger C
b. These variations also account for uncertainties on the modelling of the p
Tof the t¯ t system. The same generator combinations were used to assess the corresponding background uncertainties for Wt single top events.
Parton density functions:
The uncertainties on
eµand the Wt single top background due to uncertain- ties on the proton PDFs were evaluated using the error sets of the CT10 [5], MSTW 2008 68 % CL NLO [4] and NNPDF 2.3 PDF [7] sets. The final uncertainty was calculated as half the envelope encompassing the predictions of all three PDF sets along with their associated uncertainties, fol- lowing the PDF4LHC recommendations [3]. The value quoted in Table 3 also includes the much smaller effects of PDF variations on C
b, and the effects of correlations between the changes in
band C
b.
QCD scale choices:
The lepton p
Tand
ηdistributions, and hence
eµ, are sensitive to the choices of QCD renormalisation and factorisation scales. This e
ffect was investigated using generator-level P
+P
t¯ t samples where the two scales were separately varied up and down by a factor of two from their default values of Q
2 =m
top2+p
2T,top. The systematic uncertainty for each scale was taken as half the di
fference in
eµvalues between the samples with increased and decreased QCD scale, and the uncertainties for renormalisation and factorisation scales then added linearly to give a total scale uncertainty of 0.30 % on
eµ.
Single top modelling:
Uncertainties related to Wt single top modelling were assessed by comparing the predictions from P
+P
and MC@NLO+Herwig, and P
interfaced to either P
or H
, in all cases normalising the total production rate to the approximate NNLO cross-section prediction. The resulting uncertainties are 4.9 % and 23 % on the one and two b-tag background contributions. The background in the two b-tag sample is sensitive to the production of Wt with an additional b-jet, a NLO contribution to Wt which can interfere with the t¯ t final state. The sensitivity to this interference was studied by comparing the predictions of P
with the diagram removal and diagram subtraction schemes [36], giving additional single-top/ t¯ t interference uncertainties of 1.0 % and 20 % for the one and two b-tag samples. Production of single top quarks via the t- and s-channels gives rise to final states with only one prompt lepton, and is accounted for as part of the fake-lepton background.
Background cross-sections:
The uncertainties on the Wt single top and diboson cross-sections were taken to be 6.8 % [33] and 5 % [34], based on the corresponding theoretical predictions.
Diboson modelling:
Significant uncertainties exist in the modelling of diboson production with extra jets, in particular those with heavy flavour. The uncertainties in the backgrounds from dibosons with one or two additional b-tagged jets were assessed by comparing the baseline prediction from A+H with that of S 1.41 [37]. The relative uncertainties are large (70 % and 200 % for one and two b-tagged events), but have a limited effect on the cross-section measurement due to the small absolute level of the diboson background.
10
Z
+jets extrapolation:The uncertainties on the extrapolation of the Z
+jets background fromZ
→µµto Z
→ττevents were assessed by comparing to the results from using Z
→ee events, which have a different background composition.
Lepton-related uncertainties:
The modelling of the electron and muon identification e
fficiencies, en- ergy scales and resolutions were studied using Z
→ee and Z
→µµdecays in data and simulation, using the techniques described in Refs. [25, 38]. Small corrections were applied to the simula- tion to better model the performance seen in data. These corrections have associated systematic uncertainties that were propagated to the cross-section measurement. The effect of the calorime- ter and track isolation cuts applied to electrons and the track isolation cut applied to muons were also studied in detail using Z decays and found to be generally well-modelled, with systematic uncertainties again being propagated to the cross-section measurement.
Jet-related uncertainties:
Although the e
fficiency to reconstruct and b-tag jets from t¯ t events is ex- tracted from the data, uncertainties in the jet energy scale, energy resolution and reconstruction e
fficiency a
ffect the backgrounds estimated from simulation and the estimate of the tagging cor- relation C
b. They also have a small e
ffect on
eµvia the lepton-jet
∆R separation cuts. The jet energy scale was varied in simulation according to the uncertainties derived from simulation and an in-situ calibration measurement [30], using a model with 22 separate orthogonal uncertainty components which were then added in quadrature. The jet energy resolution has been found to be well-modelled in simulation, and remaining uncertainties were assessed by applying additional smearing [39], which reduces
eµ. The calorimeter jet reconstruction efficiency was measured in data using track-based jets, and is also well-described by the simulation; the impact of residual uncertainties was assessed by randomly discarding jets. The uncertainty associated with the jet vertex fraction requirement made on jets with p
T <50 GeV was assessed by changing the cut value based on studies of Z
→ee
+jets events [29].
b-tagging uncertainties: The e
fficiency for b-tagging b-jets from t¯ t events was extracted from the data via equation (1), but simulation was used to predict the number of b-tagged jets and mistagged light quark, gluon and charm jets in the Wt single top and diboson backgrounds. The tagging correlation C
bis also slightly sensitive to the e
fficiencies for tagging both heavy- and light-flavour jets. The uncertainties in the simulation modelling of the b-tagging performance were assessed using studies of b-jets containing muons [32, 40], jets containing D
∗+mesons [41] and inclusive jet events [42].
Pileup modelling:
The simulated events were generated at a variety of instantaneous luminosities, span- ning the range of conditions seen in the data. Events were reweighted based on
µ, the averagenumber of pileup events superimposed on each primary physics event, to reproduce the
µdistribu- tion seen in the data. The uncertainties were assessed by varying the correspondence between the simulated
µvalues and those estimated for data, reflecting uncertainties in the inelastic pp cross- section and the modelling of pileup events, with more simulated pileup leading to a reduction in
eµ.
Misidentified leptons:
The uncertainties on the number of fake lepton events in the one and two b- tagged samples were derived from the statistical uncertainties on the numbers of same-sign lepton events, the systematic uncertainties on the opposite- to same-sign ratios R
j, and the uncertainties on the numbers of prompt same-sign events shown in Table 2, as discussed in detail in Section 4.
The overall uncertainties on the numbers of misidentified leptons are 30 % and 52 % for the one
and two b-tagged samples, dominated by the uncertainties on the ratios R
j.
Integrated luminosity:
The uncertainty on the data integrated luminosity was evaluated to be 2.8 %, using techniques similar to those described in Ref. [43]. The relative e
ffect on the cross-section measurement is slightly larger because the Wt single top and diboson backgrounds are evaluated from simulation, so are also sensitive to the assumed integrated luminosity.
LHC beam energy:
The LHC beam energy during the 2012 pp run was recently calibrated to be 0.30
±0.66 % smaller than the nominal value of 4 TeV per beam, using the revolution frequency di
fference of protons and lead ions during p
+Pb runs in early 2013 [44]. Since this calibration is compatible with the nominal
√s of 8 TeV, no correction was applied to the measured
σt¯tvalue. However, an uncertainty of 1.7 %, corresponding to the expected change in
σt¯tfor an 0.66 % change in
√s [45]
is quoted separately on the final result.
Top-quark mass:
The simulation samples used in this analysis were generated with m
top =172.5 GeV, but the acceptance for t¯ t and Wt events, and the Wt background cross-section itself, depend on the assumed m
topvalue. Alternative samples generated with m
top =170 and 175 GeV were used to quantify these e
ffects. The acceptance and background e
ffects partially cancel, and the final depen- dence of the result on the assumed m
topvalue was determined to be dσ
t¯t/dmtop = −0.26 %/GeV.The result of the analysis is reported assuming a fixed top mass of 172.5 GeV, and the small de- pendence of the the cross-section on the assumed mass is not included as a systematic uncertainty.
The total systematic uncertainties on
eµ, C
b, and the fitted values of
σt¯tand
bare shown in Table 3, and the systematic uncertainties on the individual background components are shown in Table 1. A more detailed breakdown is given in Table 4 in the Appendix. The dominant uncertainties on the cross-section result come from t¯ t modelling, initial
/final state radiation, PDFs and electron identification uncertainties.
The uncertainties on the integrated luminosity and LHC beam energy also contribute significantly, and are quoted separately in the final result.
6 Additional correlation studies
The baseline P
+P
simulation sample predicts a small positive tagging correlation, C
b =1.007
±0.002, where the uncertainty is due to simulation statistics. Although the systematic uncertainty on C
bwas set by the comparison with MC@NLO
+H
(which gives C
b =1.001
±0.002), additional studies were carried out to probe the modelling of possible sources of correlation. One possible source is the production of additional b b ¯ or c¯ c pairs in t¯ t production, which tends to increase C
b, and the number of events with three or more b-tagged jets, which are not used in the measurement of
σtt¯. The ratio R
32of events with at least three b-tagged jets to events with at least two b-tagged jets was used to quantify this extra heavy-flavour production in data. It was measured to be R
32 =2.7
±0.2 %, close to the P
+P
prediction of 2.4
±0.1 % (where the uncertainties in both cases are purely statistical), and well within the spread of R
32values seen in the alternative simulation samples.
Kinematic correlations between the two b-jets produced in the t¯ t decay could also produce a positive tagging correlation, as the e
fficiency to reconstruct and tag b-jets is not uniform as a function of p
Tand
η.For example, t¯ t pairs produced with high invariant mass tend to give rise to two back-to-back collimated top-quark decay systems where both b-jets have higher than average p
T, and longitudinal boosts of the t¯ t system along the beamline give rise to
ηcorrelations between the two jets. These e
ffects were probed by increasing the jet p
Tcut in steps from the default of 25 GeV up to 75 GeV; above about 50 GeV, the simulation predicts strong positive correlations of up to e.g. C
b ≈1.2 for a 75 GeV p
Tcut. The cross- section fitted in data after taking these correlations into account remains stable across the full p
Trange, suggesting that any such kinematic correlations are well-modelled by the simulation. The results were also found to be stable within the uncorrelated components of the statistical and systematic uncertainties
12
when tightening the jet and lepton
ηcuts, raising the lepton p
Tcut up to 55 GeV and changing the b- tagging working point between e
fficiencies of 60 % and 80 %. No additional uncertainties were assigned as a result of these studies.
7 Summary and conclusion
The inclusive t¯ t production cross-section has been measured using the full ATLAS 2012 pp collision data sample of 20.3 fb
−1at
√s
=8 TeV, in the dilepton t¯ t
→eµννb b ¯ decay channel. The numbers of opposite- sign eµ events with one and two b-tagged jets were counted, allowing a simultaneous determination of the t¯ t cross-section
σt¯tand the probability to reconstruct and b-tag a jet from a t¯ t decay. Assuming a top quark mass of m
top =172.5 GeV, the result is:
σtt¯=
237.7
±1.7 (stat)
±7.4 (syst)
±7.4 (lumi)
±4.0 (beam energy) pb,
where the four uncertainties are due to data statistics, experimental and theoretical systematic e
ffects, the integrated luminosity, and the LHC beam energy, giving a total relative uncertainty of 4.8 %. The dependence of the result on the assumed value of m
topis dσ
t¯t/dmtop=−0.26 %/GeV, and the associateduncertainty is not included in the totals given above.
The measurement is consistent with and more precise than a previous result from ATLAS in the lepton+jets channel [46], and also with the theoretical prediction based on recent NNLO+NNLL calcu- lations of 252.9
+−14.513.3pb at m
top=172.5 GeV.
References
[1] M. Cacciari et al., Top-pair production at hadron colliders with next-to-next-to-leading logarithmic soft-gluon resummation, Phys. Lett. B710 (2012) 612, arXiv:1111.5869;
P. B¨arnreuther et al., Percent Level Precision Physics at the Tevatron: First Genuine NNLO QCD Corrections to q¯ q
→t¯ t, Phys. Rev. Lett. 109 (2012) 132001, arXiv:1204.5201;
M. Czakon and A. Mitov, NNLO corrections to top-pair production at hadron colliders: the all- fermionic scattering channels, JHEP 1212 (2012) 054, arXiv:1207.0236;
M. Czakon and A. Mitov, NNLO corrections to top pair production at hadron colliders: the quark- gluon reaction, JHEP 1301 (2013) 080, arXiv:1210.6832;
M. Czakon, P. Fiedler and A. Mitov, The total top quark pair production cross-section at hadron colliders through
O(α4S), Phys. Rev. Lett. 110 (2013) 252004, arXiv:1303.6254.
[2] M. Czakon and A. Mitov, Top
++: a program for the calculation of the top-pair cross-section at hadron colliders, arXiv:1112.5675.
[3] M. Botje et al., The PDF4LHC Working Group Interim Recommendations, arXiv:1101.0538.
[4] A.D. Martin et al., Parton distributions for the LHC, Eur. Phys. J. C63 (2009) 189, arXiv:0901.0002;
A.D Martin et al., Uncertainties on
αsin global PDF analyses and implications for predicted hadronic cross sections, Eur. Phys. J. C64 (2009) 653, arXiv:0905.3531.
[5] H.H. Lai et al., New parton distributions for collider physics, Phys. Rev. D82 (2010) 074024, arXiv:1007.2241.
[6] J. Gao et al., The CT10 NNLO Global Analysis of QCD, arXiv:1302.6246.
[7] R. D. Ball et al., Parton distributions with LHC data, Nucl. Phys. B867 (2013) 244, arXiv:1207.1303.
[8] M. Aliev et al., HATHOR—Hadronic top and heavy quarks cross-section calculator, Comp. Phys.
Comm. A182 (2011) 1034, arXiv:1007:1327.
[9] ATLAS Collaboration, The ATLAS Experiment at the CERN Large Hadron Collider, JINST 3 (2008) S08003.
[10] ATLAS Collaboration, The ATLAS Simulation Infrastructure, Eur. Phys. J. C70 (2010) 823, arXiv:1005.4568.
[11] S. Agostinelli et al., GEANT4: A simulation toolkit , Nucl. Instr. Meth. A506 (2003) 250.
[12] ATLAS Collaboration, The simulation principle and performance of the ATLAS fast calorime- ter simulation FastCaloSim, ATLAS-PHYS-PUB-2010-13,
http://cdsweb.cern.ch/record/1300517.
[13] T. Sj¨ostrand, S. Mrenna, P. Skands, A brief introduction to PYTHIA 8.1, Comp. Phys. Comm. A178 (2008) 852, arXiv:0710.3820.
[14] P. Nason, A new method for combining NLO QCD with shower Monte Carlo algorithms, JHEP 0411 (2004) 040, arXiv:hep-ph/0409146;
S. Frixione, P. Nason, C. Oleari, Matching NLO QCD computations with Parton Shower simula- tions: the POWHEG method, JHEP 0711 (2007) 070, arXiv:0709.2092.
[15] S. Mrenna, T. Sj¨ostrand, P. Skands, PYTHIA 6.4 physics and manual, JHEP 05 (2006) 0265, arXiv:hep-ph/0603175.
[16] P.Z. Skands, Tuning Monte Carlo Generators: The Perugia Tunes, Phys. Rev. D82 (2010) 074018, arXiv:1005.3457.
[17] J. Erler and P. Langacker, Electroweak model and constraints on new physics in Particle Data Group, J. Beringer et al., The Review of Particle Physics, Phys. Rev. D86 (2012) 010001.
[18] S. Frixione and B. Webber, Matching NLO QCD computations and parton shower simulations, JHEP 06 (2002) 029, arXiv:hep-ph
/0204244.
[19] G. Corcella et al., HERWIG 6: An event generator for hadron emission reactions with interfering gluons (including supersymmetric processes), JHEP 101 (2011) 010, arXiv:hep-ph/0011363.
[20] J.M. Butterworth, J.R. Forshaw and M.H. Seymour, Multiparton interactions in photoproduction at HERA, Z. Phys. C72 (1996) 637, arXiv:hep-ph
/9601371.
[21] ATLAS Collaboration, New ATLAS event generator tunes to 2010 data, ATLAS-PHYS-PUB-2011- 008,
http://cdsweb.cern.ch/record/1345343.[22] M.L. Mangano et al., ALPGEN, a generator for hard multiparton processes in hadronic collisions, JHEP 0307 (2003) 001, arXiv:hep-ex
/0206293.
[23] J. Pumplin et al., New generation of parton distributions with uncertainties from global QCD anal- ysis, JHEP 07 (2002) 012, arXiv:hep-ph
/0201195.
[24] B.P. Kersevan and E. Richter-Wa¸s, The Monte Carlo event generator AcerMC version 2.0 with interfaces to PYTHIA 6.2 and HERWIG 6.5, arXiv:hep-ph/0405247.
14
[25] ATLAS Collaboration, Electron performance measurements with the ATLAS detector using the 2010 LHC proton-proton collision data, Eur. Phys. J. C72 (2012) 1909, arXiv:1110.3174.
[26] K. Rethermann and B. Tweedie, E
fficient identification of boosted semileptonic top quarks at the LHC, JHEP 1103 (2011) 059, arXiv:1007.2221
[27] M. Cacciari, G.P. Salam, Dispelling the N
3myth for the k
tjet-finder, Phys. Lett. B641 (2006) 57, arXiv:hep-ph/0512210;
M. Cacciari, G.P. Salam and G. Soyez, The anti-k
tjet clustering algorithm, JHEP 04 (2008) 063, arXiv:0802.1189.
[28] ATLAS Collaboration, Jet energy measurement with the ATLAS detector in proton-proton collisions at
√s
=7 TeV, Eur. Phys. J. C73 (2013) 2304, arXiv:1112.6426.
[29] ATLAS Collaboration, Pileup subtraction and suppression for jets in ATLAS, ATLAS-CONF-2013- 083,
http://cdsweb.cern.ch/record/1570994.[30] ATLAS Collaboration, Jet energy scale and its systematic uncertainty in proton-proton collisions at
√s
=7 TeV with ATLAS 2011 data, ATLAS-CONF-2013-004,
http://cdsweb.cern.ch/record/1509552.
[31] ATLAS Collaboration, Commissioning of the ATLAS high-performance b-tagging algorithms in the 7 TeV collision data, ATLAS-CONF-2011-102,
http://cdsweb.cern.ch/record/1369219.[32] ATLAS Collaboration, Measurement of the b-tag e
fficiency in a sample of jets containing muons with 5 fb
−1of data from the ATLAS detector, ATLAS-CONF-2012-043,
http://cdsweb.cern.ch/record/1435197.
[33] N. Kidonakis, Two-loop anomalous dimensions for single top quark associated production with a W
−or H
−, Phys. Rev. D82 (2010) 054018, arXiv:1005.4451.
[34] J.M. Campbell and R.K. Ellis, MCFM for the Tevatron and the LHC, Nucl. Phys. Proc. Suppl. 205 (2010) 10, arXiv:1007.3492.
[35] ATLAS Collaboration, Measurement of t¯ t production with a veto on additional central jet activ- ity in pp collisions at
√s
=7 TeV using the ATLAS detector, Eur. Phys. J. C72 (2013) 2043, arXiv:1203.5015.
[36] C. White, S. Frixione, E. Laenen and F. Maltoni, Isolating Wt production at the LHC, JHEP 11 (2009) 074, arXiv:0908.0631;
E. Re, Single-top Wt-channel production matched with parton showers using the POWHEG method, Eur. Phys. J. C71 (2011) 1547, arXiv:1009.2450.
[37] T. Gleisberg et al., Event generation with Sherpa 1.1, JHEP 02 (2009) 007, arXiv:0811.4622.
[38] ATLAS Collaboration, Preliminary results on the muon reconstruction e
fficiency, momentum res- olution and momentum scale in ATLAS 2012 pp collision data, ATLAS-CONF-2013-088,
http://cdsweb.cern.ch/record/1580207.