ATLAS-CONF-2013-008 03March2013
ATLAS NOTE
ATLAS-CONF-2013-008
March 2, 2013
Measurement of the di ff erential cross section of B
+meson production in pp collisions at √
s = 7 TeV at ATLAS
The ATLAS Collaboration
Abstract
The production cross section of B
+mesons is measured as a function of transverse mo- mentum p
Tand rapidity
yin proton-proton collisions at
√s
=7 TeV, using 2.4 fb
−1of data recorded with the ATLAS detector at the Large Hadron Collider. The differential cross section is measured in eight intervals of p
Tand four intervals of
|y|, covering the range 9 GeV
<p
T <120 GeV and
|y| <2.25. The differential production cross sections are compared to next-to-leading order theoretical predictions.
c Copyright 2013 CERN for the benefit of the ATLAS Collaboration.
Reproduction of this article or parts of it is allowed as specified in the CC-BY-3.0 license.
1 Introduction
The production of heavy quarks at hadron colliders provides a challenging opportunity to test the valid- ity of quantum chromodynamics (QCD) predictions. The b-hadron production cross section has been known with next-to-leading-order (NLO) accuracy for more than twenty years [1, 2] and more recently it has been predicted with fixed order calculations matched to next-to-leading logarithm approximation (FONLL) [3, 4].
Several measurements were performed with proton-antiproton collisions by the UA1 experiment at the Sp ¯pS collider (CERN) at a centre-of-mass energy of
√s
=630 GeV [5, 6] and by the CDF and D0 experiments at the Tevatron collider (Fermilab) at
√s
=630 GeV, 1.8 TeV and 1.96 TeV [7–16].
These measurements made a significant contribution to the understanding of heavy quark production in hadronic collisions, but the theoretical predictions still suffer from uncertainties, mainly due to the dependence on the factorisation and renormalisation scales, and to uncertainties on the b-quark mass m
b[2]. It is of theoretical interest to measure cross sections at higher
√s [17]. The FONLL approximations are expected to be valid for p
T≫m
b, as in these approximations the pertubative expansion has terms of ln(p
T/m
b), where p
Tis the transverse momentum of the b-hadron.
Measurements of the b-hadron production cross section in proton-proton collisions at the Large Hadron Collider (LHC) provide further tests of QCD calculations for heavy-quark production at higher centre-of-mass energies and in wider transverse momentum (p
T) and rapidity (y) ranges, thanks to the extended coverage and excellent performance of the LHC detectors. Recently the LHCb experiment measured the b¯b and B
±production cross sections in the forward region at
√s
=7 TeV [18, 19]. The CMS experiment measured the production cross sections for B
+, B
0, B
smesons, inclusive b-hadrons and b¯b decays with muons at
√s
=7 TeV [20–24]. ATLAS has measured b and b¯b production using b-hadron jets [25] and inclusive b-hadron production using D
∗µX [26] and J/ψX [27] final states.
This note presents a measurement of the B
+production cross section
1using the decay channel B
+ →J/ψK
+ →µ
+µ
−K
+in pp collisions at
√s
=7 TeV, as a function of B
+transverse momen- tum and rapidity. ATLAS and CMS are sensitive in the central rapidity region, so their measurements are complementary to the measurement of LHCb. Using 2.4 fb
−1of data collected by the ATLAS detec- tor, this analysis extends the measurement of the B
+cross section up to p
Tof about 100 GeV, allowing comparisons with NLO predictions in four rapidity regions in the range
|y
|< 2.25.
2 The ATLAS Detector
The ATLAS experiment [28] uses a general purpose detector
2consisting of an inner tracker, a calorimeter and a muon spectrometer. The inner detector (ID) directly surrounds the interaction point; it includes a silicon pixel detector (Pixel), a silicon strip detector (SCT) and a transition radiation tracker (TRT), and is embedded in an axial 2 T magnetic field. The ID covers the range
|η
|< 2.5 and is enclosed by a calorimeter system containing electromagnetic and hadronic sections. The calorimeter is surrounded by a large muon spectrometer (MS) inside an air-core toroidal magnet system that contains a combination of monitored drift tubes (MDT) and cathode strip chambers (CSC), designed to provide precise position measurements in the bending plane in the range 0 <
|η
|< 2.7. In addition, resistive plate chambers
1The measurements presented in this note asσ(pp→B+X) refer to either of the two charged states, under the assumption that in the available phase space the two production cross sections are equal. In the phase space accessible by this measurement, the MC generators predict equal production cross sections for B+and B−mesons. This prediction is valid within the precision of the measurement.
2ATLAS uses a right-handed coordinate system with its origin at the nominal interaction point. The z-axis is along the beam pipe, the x-axis points to the centre of the LHC ring and the y-axis points upward. Cylindrical coordinates (r,φ) are used in the transverse plane,φbeing the azimuthal angle around the beam pipe. The pseudorapidityηis defined asη=−ln[tan(θ/2)], whereθis the polar angle.
(RPC) and thin gap chambers (TGC) with a coarse position resolution but a fast response time are used primarily to trigger muons in the rapidity ranges
|η
|< 1.05 and 1.05 <
|η
|< 2.4, respectively. Momentum measurements in the MS are based on track segments in at least two of the three stations of the MDT and the CSC. The RPC and TGC are used to improve the pattern recognition and track reconstruction in the non-bending plane.
The ATLAS trigger system [29] has three levels: the hardware-based Level-1 trigger and the two- stage High Level Trigger (HLT), comprising the Level-2 trigger and Event Filter (EF). At Level-1, the muon trigger searches for patterns of hits corresponding to different p
Tthresholds using the RPCs and TGCs. Regions of Interest (RoI) around these Level-1 hit patterns then serve as seeds for the HLT muon reconstruction, in which dedicated highly selective algorithms are used to incorporate information from both the MS and the ID, achieving a position and momentum resolution close to that provided by the offline muon reconstruction.
3 Cross section determination
The differential cross section for B
+meson production in pp collisions is given by d
2σ(pp
→B
+X)
dp
Tdy
=N
B+L · B ·∆pT·∆y
, (1)
where N
B+is the number of B
+→J/ψK
+signal decays produced,
Lis the integrated luminosity of the data sample,
Bis the total branching ratio of the signal decay, which is (6.03
±0.21)
×10
−5, obtained by combining the world averaged values of the branching ratios for B
+→J/ψK
+and J/ψ
→µ
+µ
−[30]
and
∆pT,
∆yare the widths of p
Tand
|y
|intervals. Assuming that B
+and B
−mesons are produced in equal amounts, N
B+is derived from the average yield of the two reconstructed charged states in a p
T−y interval, after correcting for detector effects and acceptance:
N
B+ =1 A
N
recoB+ε
B+ =1
A N
recoB−ε
B− =1 A
N
recoB±ε
B++ε
B−, (2)
where N
recoB±is the number of reconstructed signal events, obtained from data with a fit to the invariant mass distribution of B
±candidates, A is the acceptance of the kinematic cuts imposed on the final state particles of the signal decay and ε
B+(−)are efficiency factors for the reconstructed B
+(−)signal decays.
The acceptance correction is extracted in each p
T−y interval using a sample of signal decays generated with P
ythia(see Section 4), in which no kinematic cuts are applied to the final state particles. Regarding the efficiency factors ε
B+(−), separate corrections are needed for B
+and B
−signal decays, because the dif- ferent interaction cross section of K
+and K
−with the detector material results in different reconstruction efficiencies for the two charged mesons. The efficiency factors for B
+and B
−are obtained from Monte Carlo (MC) simulation in the same manner. In the following, ε
B−is implicitly referred to, together with ε
B+. The efficiency for B
+events is defined as the product of trigger, muon reconstruction (ID and MS), kaon reconstruction and vertexing efficiencies:
ε
B+=ε
triggerJ/ψ ·ε
µ+·ε
µ−·ε
KID+·ε
µµKvertex =ε
J/ψtrigger·ε
µMS+ ·ε
µMS− ·(ε
µID)
2·ε
IDK+·ε
µµKvertex. (3) In the above equation, ε
µMS+and ε
µMS−are the efficiencies for reconstructing µ
+and µ
−in the MS, which differ for muons of low p
Tdue to the toroidal magnetic field bending muons with positive (negative) charge towards higher (lower) pseudorapidity. The efficiency ε
B+for a given p
T−y interval is obtained from MC simulated signal events from the fraction
ε
B+=N
mc, recoB+N
mc, genB+, (4)
where the denominator is the number of signal events generated in the given p
T −y interval and the numerator is the number of signal events reconstructed in the same p
T−y interval that pass all the offline selection requirements. Bin-to-bin migration effects are included in the efficiency definition of Equa- tion (4). The trigger and muon reconstruction efficiencies have been measured with a tag-and-probe method [31] and the simulation is corrected with per-event weights to reproduce the data-driven efficien- cies. The derived weights w
µMS+, w
µMS−, w
J/ψtriggerare applied in each event, so that N
mc, recoB+in Equation (4) is now defined as
N
mc, recoB+ =NXmcevents
i=1
(w
µMS+)
i·(w
µMS−)
i·(w
triggerJ/ψ)
i. (5) The efficiency for reconstructing muons in the ID, ε
µID, and the vertexing efficiency, ε
µµKvertexis found to be 99% in both cases and well reproduced by simulated events, thus no scale factor is applied. The reconstruction efficiency of hadrons in the ID was verified in Ref. [32] for data and simulation; for the kaons used in this analysis, it is obtained from simulation.
4 Data and Monte Carlo samples
Data for this analysis were collected during the 2011 LHC proton-proton running period using a di- muon trigger, which requires the presence of at least two muon candidates of p
T> 4 GeV. Because of the increasing luminosity of the collider during this period, trigger thresholds changed in the middle of 2011 LHC operation and triggers were also prescaled. Thus, the data sample considered for this analysis is restricted to the first half of the full 2011 data sample, where this di-muon trigger was operational.
Selected events are required to be taken during stable LHC beam conditions and the ID, as well as the MS, must have been fully operational. The collected data correspond to an integrated luminosity of 2.4 fb
−1with an uncertainty of 1.8% [33].
In this analysis two MC samples have been used. The first MC sample simulates the signal decay process B
±→J/ψK
±→µ
+µ
−K
±while the second simulates the inclusive b¯b
→J/ψX
→µ
+µ
−X decay process, which also includes the signal. Both samples were generated with P
ythia6 [34] using the 2011 ATLAS tune [35]. The ATLAS detector and its response were simulated using G
eant4 [36]. Additional
pp interactions in the same and nearby bunch crossings (pile-up) were included in the simulation.
The MC samples are used at several points in the analysis. The first is in the extraction of the fit models for signal and background. The second is in the construction of efficiency maps for muon recon- struction and trigger selection, in order to obtain scale factors by comparison to data-driven efficiency maps. The third is in the estimation of the signal reconstruction efficiency in each p
Tand rapidity interval used in this analysis. In addition, the P
ythiaMC generator was used to estimate the acceptance of the kinematic cuts we apply on the final state particles. In the MC samples generated with Pythia, events are weighted according to the decay angles of J/ψ
→µ
+µ
−in order to take into account the zero helicity state of the J/ψ in the B
±rest frame.
To compare the measurements with theoretical predictions, NLO QCD calculations, matched with a leading-logarithmic parton shower MC simulation, are used. Predictions for b¯b production are evaluated with two packages: P
owheg-
hvq(P
owheg-
box1.0) [37, 38] and MC@NLO 4.01 [39, 40]. Predictions use the CT10 [41] parameterisation for the parton distribution function of the proton and a b-quark mass of 4.75 GeV. For the hadronisation process, Powheg is matched with Pythia, which uses the Lund string model [42] with the Bowler modification [43] of the Lund symmetric fragmentation function [44].
MC@NLO is matched with Herwig [45], which uses a cluster model [46]. Predictions from FONLL [47]
with the CTEQ 6.6 [41] parton distribution function are also used, assuming a hadronisation fraction
f
b→B+of (40.1
±1.3)% [30] to fix the overall scale.
5 Event selection
5.1 Trigger, muon reconstruction, track selection
Events are required to have at least one reconstructed primary vertex with at least three associated ID tracks, and to satisfy a di-muon trigger which requires the presence of at least two oppositely charged muon candidates of p
T> 4 GeV and
|η
|< 2.4. The trigger selection includes a fit constraining each di- muon candidate to a common vertex. Very loose selections on the quality of the vertex fit (χ
2/N
dof< 10) and the di-muon invariant mass (2.5 GeV < m
µµ< 4.3 GeV) are imposed, which are fully efficient for signal candidates.
Muons are required to have a track reconstructed in the MS matched with a track reconstructed in the ID. The kinematic properties of the muons are solely determined from the parameters of the ID tracks associated with the muons, as multiple scattering in the calorimeters and toroids degrades the
p
Tresolution for the low momentum muons.
Muon tracks are required to have a sufficient number of hits in pixel, SCT and TRT detectors to ensure accurate ID measurements. The same selection criteria are applied to tracks selected as kaon candidates.
5.2 Reconstruction of J/ψ candidates
Events are required to contain at least one pair of reconstructed muons, and each pair is fitted using a vertexing algorithm [49]. The momenta of muons and the vertex invariant mass are calculated from the refitted track parameters returned by the vertexing algorithm.
Muon pairs with a common vertex are considered as J/ψ
→µ
+µ
−candidates if their invariant mass lies in the mass range 2.7
−3.5 GeV. Selecting di-muons in this mass range is 100% efficient for selecting signal events.
Because of the trigger requirements on muons, the reconstructed J/ψ must have rapidity
|y
|< 2.25 and the reconstructed muons p
T> 4 GeV and
|η
|< 2.3. To ensure that the di-muons that form the J/ψ candidate are the ones which triggered the event, an η
−φ match between the trigger muons and the ones of the J/ψ candidate is required. If multiple J/ψ candidates are found in the event, all are considered in the formation of B
±candidates.
5.3 Reconstruction of B
±candidates
The muon tracks of the selected J/ψ candidates are again fitted to a common vertex with an additional
third track of p
Tgreater than 1 GeV. The three-track vertex fit is performed by constraining the muon
tracks to the J/ψ mass [30]. The K
±mass is assigned to the third track. The quality of the resulting
fit is characterised by the χ
2per-degree of freedom ( χ
2/N
d.o.f.), where a global χ
2involving all three
tracks is used. Selected candidates are required to fulfill the requirement χ
2/N
d.o.f.< 6, which is found
to be
∼99% efficient in accepting signal events while strongly rejecting background events. We retain
B
+and B
−candidates with p
T> 9 GeV and
|y
|< 2.3 in the mass range 5.040
−5.800 GeV. After this
selection, the candidate multiplicity per event is 1.3, dominated by random combinations of tracks with
the selected J/ψ mesons, produced promptly or in b-hadron decays. Such combinations result in non-
resonant background which does not affect the estimation of the signal yield. The probability to have a
second signal decay in the same event is small due to the small branching fraction.
6 Extracting the number of reconstructed B
±mesons
The number of reconstructed B
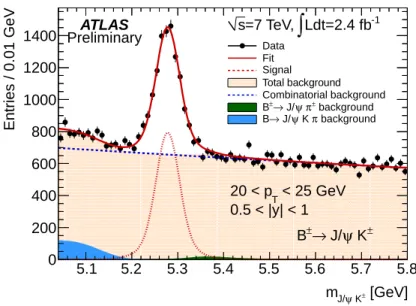
±mesons is obtained using a binned maximum likelihood fit to the invari- ant mass of the selected candidates. The probability density function (pdf) for the signal is defined as the sum of two Gaussians of relative fraction f
1and corresponding widths σ
1, σ
2, both centered at the reconstructed mass of B
±candidates. The pdf for the background consists of three components to model the following three sources of background:
•
B
± →J/ψπ
±, where the kaon mass is wrongly assigned to the pion; this decay is Cabbibo sup- pressed with a relative fraction of 4.9% [30] with respect to the signal decay; it is modeled with a Crystal Ball function [48].
•
B
±/0→J/ψK
∗±/0 →J/ψKπ and B
±/0→J/ψK
±π
0/∓, where the final state pion is not associated to the decay vertex, creating a resonant structure approximately one pion mass away from the B
±mass; these partially reconstructed B-decays are modeled with a complementary error function.
•
Combinatorial background from random combinations of J/ψ (produced promptly in pp collisions or in feed-down from B-decays) with a track; it is modeled with an exponential function. The background from muon pairs not originating from J/ψ decays is verified to be negligible after the full B
±candidate selection.
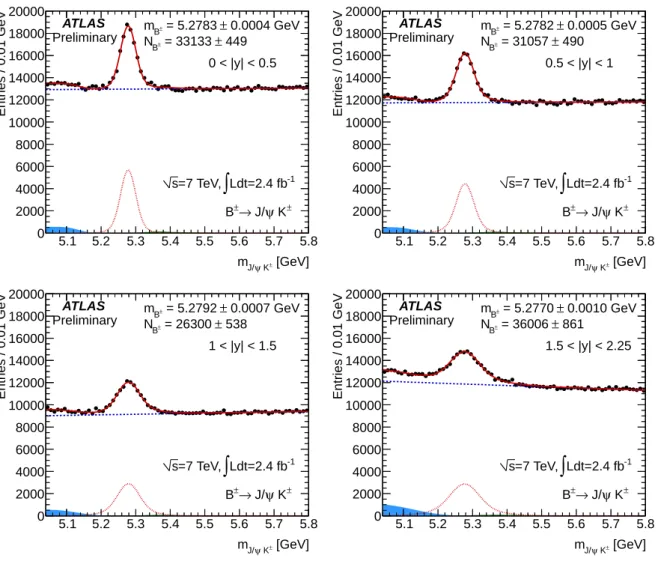
The extraction of the signal yield is done in two steps. First, the shapes of the signal and background pdf’s, which depend on p
Tand y of the B
±meson candidate, are obtained from fits to MC for each p
T−y interval. Then the data are fitted in the same p
T−y interval. The parameters for the shape of the signal pdf (σ
1, σ
2and f
1) and the resonant background are fixed to the results of the fits to MC. The relative normalisation of the B
±→J/ψπ
±decay to the signal is fixed to the fraction of the world averaged values for their branching ratios, and is corrected for the difference in acceptance of the two decay modes. The reconstructed mass m
B±is obtained from data for the full p
Trange in a rapidity interval by fitting the invariant mass of the selected candidates, and is fixed throughout the fits in p
Tintervals. Therefore, when fitting the data in each p
T−y interval, the free parameters are the normalisation of the signal and the partially reconstructed B-decays, and the slope of the combinatorial background. The results of the fits to the invariant mass of the selected B
±candidates from data are exemplified in Figure 1 for a region of intermediate p
Tand of central rapidity.
The total number of signal B
±events observed in data in the full p
Tand y range before acceptance and efficiency corrections is 125600
±1201, where the quoted uncertainty is statistical. These events are split in four intervals of
|y
|and eight intervals of p
Tfor the differential cross section measurement. The acceptance correction varies from 4%-85% from low to high p
Tintervals, and the efficiency correction varies from 25%-40%.
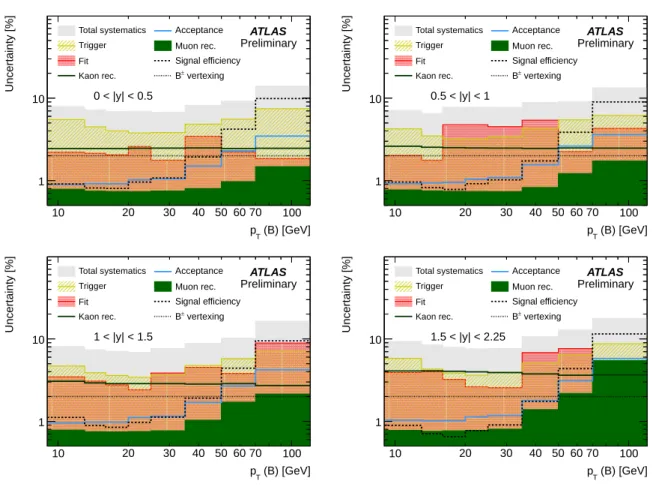
7 Systematic uncertainties
All the relevant sources of systematic uncertainty on the measurement of the B
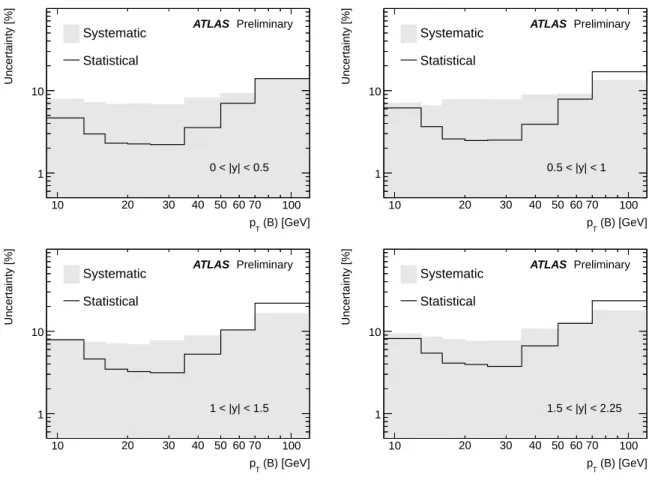
+production cross section are considered and discussed below. The range of these uncertainties is summarised in Table 7. Their breakdown in p
T−y intervals is given in Figure 2. The total systematic uncertainty, including the uncer- tainties from luminosity and branching ratio, is compared to the statistical precision of the measurement in Figure 3.
1. Trigger: The trigger efficiency is obtained from data in bins of p
Tand q
·η of the muon, where
q is the muon charge, using a tag and probe method [31]. As the statistical components of the
uncertainty associated with the weights for the trigger efficiency are dominant, the uncertainties
[GeV]
K±
ψ
mJ/
5.1 5.2 5.3 5.4 5.5 5.6 5.7 5.8
Entries / 0.01 GeV
0 200 400 600 800 1000 1200
1400 Data
Fit Signal Total background Combinatorial background
background π±
ψ
→ J/
B±
background π
ψ K
→ J/
B
ATLAS Preliminary
Ldt=2.4 fb-1
∫
=7 TeV, s
0.5 < |y| < 1 < 25 GeV 20 < pT
K±
ψ
→ J/
B±
Figure 1: Fit to invariant mass of B
±candidates in an intermediate p
Tinterval in a central rapidity region.
The points with error bars are data and the solid line is the result of the binned maximum likelihood fit.
The various components of the fit for the signal and the background are also shown.
on the cross section are derived from a series of pseudo-experiments by allowing the weights to fluctuate randomly under a Gaussian assumption, according to their assigned uncertainty.
2. Fit: For the fit method, three sources of systematic uncertainty are identified and considered to be uncorrelated. These are the shape of the signal pdf, the reconstructed B
±mass and the shape of the background pdf. Below, the procedure to estimate the systematic uncertainty from each source is described, and the resulting uncertainties are added quadratically to obtain the total systematic uncertainty from the fit method in each p
T−y region.
•
Uncertainty from shape of the signal pdf. This uncertainty is estimated with variations of the fit model, where the values of the signal pdf parameters σ
1, σ
2, f
1are varying independently within their uncertainties derived from the fit to signal events from MC. From these variations of the fit model, the largest absolute value of the signal yield variation is taken as systematic uncertainty from the signal pdf shape, in order to account for the large correlations of these parameters. Different pdf’s were considered (three Gaussians, two Crystal Ball+Gaussian) and no significant differences in the signal yield were observed. The shape of the signal pdf is the dominant source of uncertainty among the various sources considered in the study of the fit systematics and varies from a minimum of 1% to a maximum of 8%.
•
Uncertainty on the B
±mass value. The reconstructed mass m
B±is obtained from data by fitting the invariant mass of all candidates with p
T> 9 GeV in each of the four rapidity regions. The resulting values are used to fix this parameter when performing the fits in the various p
T −y regions and their statistical uncertainty is used to estimate the systematic uncertainty on the signal yield. The fits in the various p
T−y regions are repeated varying the value of m
B±. The observed difference in the signal yield is smaller than 1%.
•
Uncertainty from the shape of the background pdf. The fit comprises three components, with each of them contributing as a possible source of uncertainty in the modeling of background.
In order to account for the large correlations between the three components, the systematic
(B) [GeV]
pT
10 20 30 40 50 60 70 100
Uncertainty [%]
1 10
ATLAS Preliminary
Total systematics Trigger Fit Kaon rec.
Acceptance Muon rec.
Signal efficiency vertexing B±
0 < |y| < 0.5
(B) [GeV]
pT
10 20 30 40 50 60 70 100
Uncertainty [%]
1 10
ATLAS Preliminary
Total systematics Trigger Fit Kaon rec.
Acceptance Muon rec.
Signal efficiency vertexing B±
0.5 < |y| < 1
(B) [GeV]
pT
10 20 30 40 50 60 70 100
Uncertainty [%]
1 10
ATLAS Preliminary
Total systematics Trigger Fit Kaon rec.
Acceptance Muon rec.
Signal efficiency vertexing B±
1 < |y| < 1.5
(B) [GeV]
pT
10 20 30 40 50 60 70 100
Uncertainty [%]
1 10
ATLAS Preliminary
Total systematics Trigger Fit Kaon rec.
Acceptance Muon rec.
Signal efficiency vertexing B±
1.5 < |y| < 2.25
Figure 2: Sources of systematic uncertainty affecting the cross section for different rapidity ranges. The total systematic uncertainty includes uncertainties from luminosity (1.8%) and branching ratio (3.4%).
uncertainty from the background modeling assigned to each p
T −y region is the largest observed difference in the signal yield.
– Combinatorial background: Fits are performed making different choices for the shape of
the combinatorial background (polynomial instead of exponential); the observed differ- ence in the signal yield is considered as systematic uncertainty from the combinatorial background modeling.
– B±→
J/ψπ
±: For the resonant background from B
±→J/ψπ
±, the dominant uncertainty comes from the relative branching fractions of this decay to the signal, which has an uncertainty of 10% [30]. Varying this fraction in the fit within its uncertainty was found to have a small effect on the signal yield (
∼1%).
– Partially reconstructed B-decays: The resonant background from partially reconstructed
B-decays is modeled with a complementary error function. Varying its parameters within their uncertainties from the fits to background events from MC, the observed difference in the signal yield is smaller than 1%.
3. Kaon track reconstruction: The efficiency of hadron reconstruction is determined from MC, with the uncertainty dominated by the material description, and validated by data driven methods [32].
The uncertainty ranges with rapidity from 2% to 4% for the kaons used in this analysis.
4. Acceptance: There are two sources of uncertainty affecting the signal acceptance calculation:
(B) [GeV]
pT
10 20 30 40 50 60 70 100
Uncertainty [%]
1 10
0 < |y| < 0.5 ATLAS Preliminary Systematic
Statistical
(B) [GeV]
pT
10 20 30 40 50 60 70 100
Uncertainty [%]
1 10
0.5 < |y| < 1 ATLAS Preliminary Systematic
Statistical
(B) [GeV]
pT
10 20 30 40 50 60 70 100
Uncertainty [%]
1 10
1 < |y| < 1.5 ATLAS Preliminary Systematic
Statistical
(B) [GeV]
pT
10 20 30 40 50 60 70 100
Uncertainty [%]
1 10
1.5 < |y| < 2.25 ATLAS Preliminary Systematic
Statistical
Figure 3: Statistical uncertainty of the fit in the determination of signal yield affecting the cross section, compared to the total systematic uncertainty. The total systematic uncertainty includes uncertainties from luminosity (1.8%) and branching ratio (3.4%).
•
Uncertainty from MC statistics. The acceptance in each p
T−y region has a relative uncer- tainty ranging from 1% to 4%, due to MC statistics.
•
Uncertainty from model-dependent kinematics. Differences in the underlying kinematic dis- tributions modeled by the Pythia and NLO generators were considered. The impact on the acceptance was estimated by reweighting the kinematic distributions of P
ythiato those of P
owhegand MC@NLO. The largest effect is seen in the high rapidity intervals, where the maximum relative difference observed is 1%, while in the remaining p
T −y intervals the effect is very small (
∼0.1%).
5. Muon reconstruction: The muon reconstruction efficiency is obtained from data in bins of p
Tand q
·η of the muon, using a tag-and-probe method [31]. The uncertainties associated with the determination of ε
µMSare mainly statistical, so the same procedure as for the trigger efficiency is used to estimate the systematic uncertainty on the cross section. In addition to this, there is also an uncertainty coming from the efficiency of reconstructing a muon in the ID with the selection cuts used in this analysis. This efficiency is found to be
∼99% with a systematic uncertainty of 0.5%
for each muon.
6. B
± vertex-finding efficiency. The vertex quality requirement has an efficiency of∼99% and is
fairly independent of p
Tand y. It was estimated with data by comparing the signal yields in
four rapidity regions before and after applying this requirement and is found to be consistent with the expectation from MC. A systematic uncertainty of 2% is assigned to this efficiency, as the maximum difference observed between the data-driven estimation and the expectation from MC.
7. Branching ratio: The total branching ratio of the selected decay, obtained combining the ratios of the decays B
±→J/ψK
±and J/ψ
→µ
+µ
−, has an uncertainty of 3.4% [30].
8. Luminosity: The luminosity scales determined by the ATLAS Collaboration for 2011 have been calibrated based on van der Meer scan data and have an uncertainty of 1.8% [33].
9. Signal e
fficiency: The efficiency correction factor for B±signal events is obtained from MC (Equa- tion 4). The systematic uncertainty assigned to this factor has two components:
•
Uncertainty from MC statistics. The sample used for the estimation of the efficiency cor- rection factor corresponds to a luminosity similar to that of the data sample. Due to the available statistics of this sample, the efficiency estimation has an uncertainty which is small (
∼1%) in most intervals and becomes significant in the high p
Tintervals (
∼10%). It is added quadratically to the rest of the sources of uncertainty.
•
Uncertainty from K
+/K
−efficiency asymmetry. Because of the different interaction of K
+and K
−mesons with the detector material, the efficiency of the kaons used in this analysis is different by
∼3.5%. This difference is obtained from simulation and verified with data.
The statistical uncertainty of the data-driven estimation of this efficiency difference is used to assign a systematic uncertainty of 1%, which propagates to the cross section through the sum of efficiencies (ε
B++ε
B−) in Equation 2.
10. Other: Bin-to-bin migration of signal events due to finite detector resolution is studied with MC.
It is found to be a small effect (<0.5%), which is included in the definition of signal efficiency (Equation 4) and no systematic uncertainty is assigned to it. Potential effects in the calculation of the signal efficiency due to the difference of the momentum scale in data and MC are expected to be larger in the lower p
Tintervals used in this analysis, where they were estimated to be smaller than 0.5%, and no systematic uncertainty is assigned for this source.
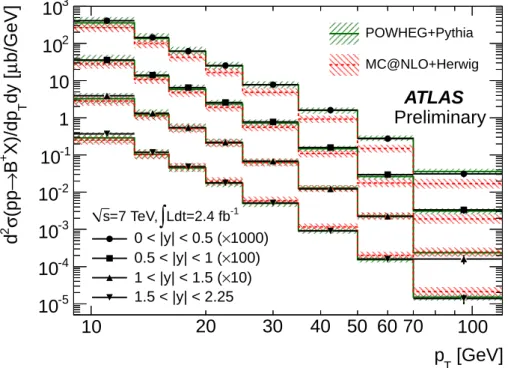
8 Cross section results
Using Equation 1, the differential cross section for B
+production is obtained, and is shown in Figure 4 as a function of p
Tof the B
+meson in four rapidity regions. Each point includes the combined statisti- cal and systematic uncertainty. Tables 2 and 3 contain the measured values of production cross section times branching ratio to the final states, in the same intervals in y and p
T. The results are compared to NLO predictions obtained with P
owheg(+P
ythia) and MC@NLO(+H
erwig). The NLO predictions are assigned an uncertainty due to renormalisation and factorisation scale and the b-quark mass, shown with a hatched area. Uncertainties from factorisation and renormalisation scales are estimated by varying the scales independently up and down by a factor of two, and the uncertainty from the b-quark mass is esti- mated by varying its value by
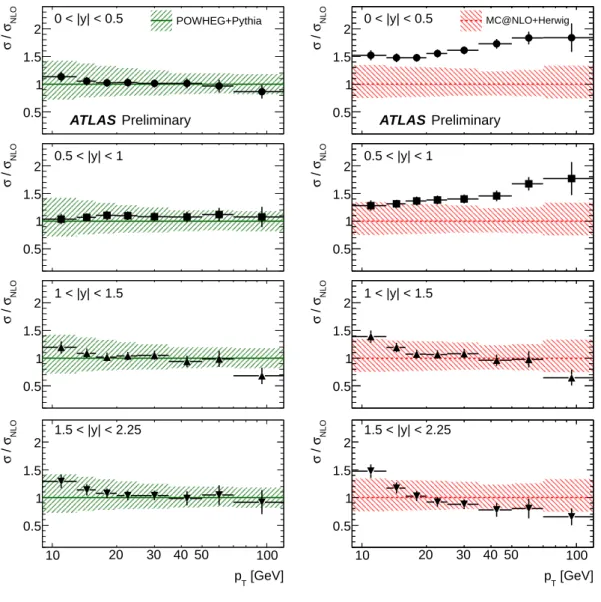
±0.25 GeV [50]. To allow for a better comparison between the measured cross section and the NLO predictions, Figure 5 shows its ratio for each rapidity region separately for P
owhegand MC@NLO.
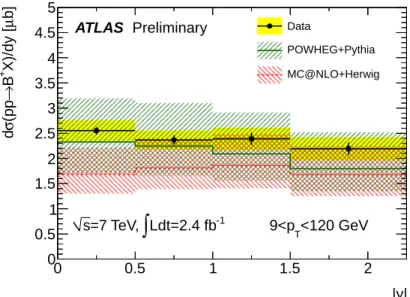
The double differential cross section is summed over the p
Tintervals, or over the rapidity ranges,
in order to obtain the differential cross section dσ/dy and dσ/dp
T, shown in Figures 6 and 7. The
systematic errors related to luminosity, branching ratio, trigger efficiency, kaon reconstruction, muon
reconstruction, vertex finding, and signal description in the mass fit are correlated, and the contributions
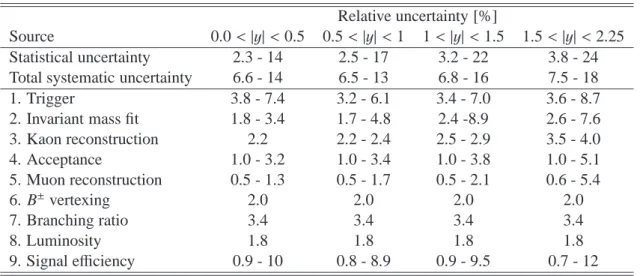
Table 1: The statistical and total systematic uncertainties on the cross section measurement. The contri- butions from the various sources of systematic uncertainty are also given. The quoted numbers are the lower and upper values over the used p
Tintervals for the four rapidity regions.
Relative uncertainty [%]
Source 0.0 <
|y
|< 0.5 0.5 <
|y
|< 1 1 <
|y
|< 1.5 1.5 <
|y
|< 2.25 Statistical uncertainty 2.3 - 14 2.5 - 17 3.2 - 22 3.8 - 24 Total systematic uncertainty 6.6 - 14 6.5 - 13 6.8 - 16 7.5 - 18
1. Trigger 3.8 - 7.4 3.2 - 6.1 3.4 - 7.0 3.6 - 8.7
2. Invariant mass fit 1.8 - 3.4 1.7 - 4.8 2.4 -8.9 2.6 - 7.6
3. Kaon reconstruction 2.2 2.2 - 2.4 2.5 - 2.9 3.5 - 4.0
4. Acceptance 1.0 - 3.2 1.0 - 3.4 1.0 - 3.8 1.0 - 5.1
5. Muon reconstruction 0.5 - 1.3 0.5 - 1.7 0.5 - 2.1 0.6 - 5.4
6. B
±vertexing 2.0 2.0 2.0 2.0
7. Branching ratio 3.4 3.4 3.4 3.4
8. Luminosity 1.8 1.8 1.8 1.8
9. Signal efficiency 0.9 - 10 0.8 - 8.9 0.9 - 9.5 0.7 - 12
from each of them are added linearly when summing over the intervals in p
Tor rapidity. The remaining
systematic errors are uncorrelated, and are combined in quadrature over the different intervals. The total
systematic error is the quadratic combination of the two components. In Figure 6, the measurement
is compared to the P
owhegand MC@NLO predictions. In Figure 7, the measurement is compared to
FONLL calculations and, for p
T< 30 GeV, to results from CMS in the rapidity range
|y
|< 2.4 [20]. The
uncertainty of the FONLL computation includes the uncertainties on the b-quark mass, renormalisation
and factorisation scales.
[GeV]
p
T10 20 30 40 50 60 70 100
b/GeV] µ dy [
TX)/dp
+B → (pp σ
2d
10
-510
-410
-310
-210
-11 10 10
210
3POWHEG+Pythia MC@NLO+Herwig
Ldt=2.4 fb-1
∫
=7 TeV, s
1000)
× 0 < |y| < 0.5 (
×100) 0.5 < |y| < 1 (
×10) 1 < |y| < 1.5 ( 1.5 < |y| < 2.25
ATLAS Preliminary
Figure 4: Double-differential cross section of B
+production as a function of p
Tfor different rapidity
ranges. The points with error bars correspond to data with their associated uncertainty, which is the com-
bination of the statistical and systematic uncertainty. The data points are compared to NLO predictions
from Powheg and MC@NLO. The shaded areas around the theoretical predictions reflect the uncertainty
from renormalisation and factorisation scales and the b-quark mass.
NLOσ / σ
0.5 1 1.5 2
NLOσ / σ
0.5 1 1.5 2
NLOσ / σ
0.5 1 1.5 2
[GeV]
pT
10 20 30 40 50 100
NLOσ / σ
0.5 1 1.5 2
POWHEG+Pythia
0 < |y| < 0.5
0.5 < |y| < 1
1 < |y| < 1.5
1.5 < |y| < 2.25 ATLAS Preliminary
NLOσ / σ
0.5 1 1.5 2
NLOσ / σ
0.5 1 1.5 2
NLOσ / σ
0.5 1 1.5 2
[GeV]
pT
10 20 30 40 50 100
NLOσ / σ
0.5 1 1.5 2
0 < |y| < 0.5
0.5 < |y| < 1
1 < |y| < 1.5
1.5 < |y| < 2.25 ATLAS Preliminary
MC@NLO+Herwig
Figure 5: Ratio of the measured cross section to the theory predictions of Powheg (left) and
MC@NLO (right) in four rapidity regions. The points with error bars correspond to data with their as-
sociated uncertainty, which is the combination of the statistical and systematic uncertainty. The shaded
areas around the theoretical predictions reflect the uncertainty from renormalisation and factorisation
scales and the b-quark mass.
|y|
0 0.5 1 1.5 2
b]µX)/dy [+ B→(ppσd
0 0.5 1 1.5 2 2.5 3 3.5 4 4.5 5
Ldt=2.4 fb-1
∫
=7 TeV, s
Data
POWHEG+Pythia MC@NLO+Herwig
<120 GeV 9<pT
ATLAS Preliminary
Figure 6: Differential cross section of B
+production as a function of rapidity. Points with error bars correspond to data with statistical uncertainty, with the yellow rectangles showing the combined statisti- cal and systematic uncertainty. Predictions from P
owhegand MC@NLO are also given for comparison.
The shaded areas around the theoretical predictions reflect the uncertainty from renormalisation and factorisation scales and the b-quark mass.
[GeV]
pT
6 7 8 910 20 30 40 50 100
b/GeV]µ [ TX)/dp+ B→(ppσd
10-5
10-4
10-3
10-2
10-1
1 10
, |y|<2.25 ATLAS, 2.4 fb-1
, |y|<2.4 CMS, 5.8 pb-1
|<2.25 FONLL, |yb
=7 TeV s
ATLAS Preliminary
Figure 7: Differential cross section of B
+production as a function of p
T. The solid circle points with
error bars correspond to the measurement of ATLAS with its statistical uncertainty, with the yellow
rectangles showing the combined statistical and systematic uncertainty. For comparison, data points
from CMS are also shown, for a measurement covering p
T< 30 GeV and
|y
|< 2.4 [20]. Predictions of
FONLL calculation [47] for B
+production are also given, assuming a hadronisation fraction of f
b→B+of
(40.1
±1.3)% [30] to fix the overall scale. The upper and lower uncertainty limits on the prediction were
obtained considering scale and b-quark mass variations.
Table 2: Differential cross section measurement for B
+production multiplied by the branching ratio to the final state in p
Tintervals in the rapidity regions
|y
|< 0.5 and 0.5 <
|y
|< 1. The first quoted uncertainty is statistical, the second uncertainty is systematic.
d2σ
dpTdy· B
(B
+→J/ψK
+)
· B(J/ψ
→µ
+µ
−) [pb/GeV]
p
T[GeV] 0 <
|y
|< 0.5 0.5 <
|y
|< 1
9 - 13 25
±1
±2 22
±1
±1
13 - 16 8.7
±0.3
±0.5 8.5
±0.3
±0.5 16 - 20 3.7
±0.1
±0.2 3.9
±0.1
±0.3 20 - 25 1.54
±0.04
±0.09 1.57
±0.04
±0.11 25 - 35 0.47
±0.01
±0.03 0.47
±0.01
±0.03 35 - 50 0.097
±0.003
±0.007 0.095
±0.004
±0.008 50 - 70 0.017
±0.001
±0.001 0.018
±0.001
±0.002 70 - 120 0.0019
±0.0002
±0.0003 0.0020
±0.0003
±0.0003
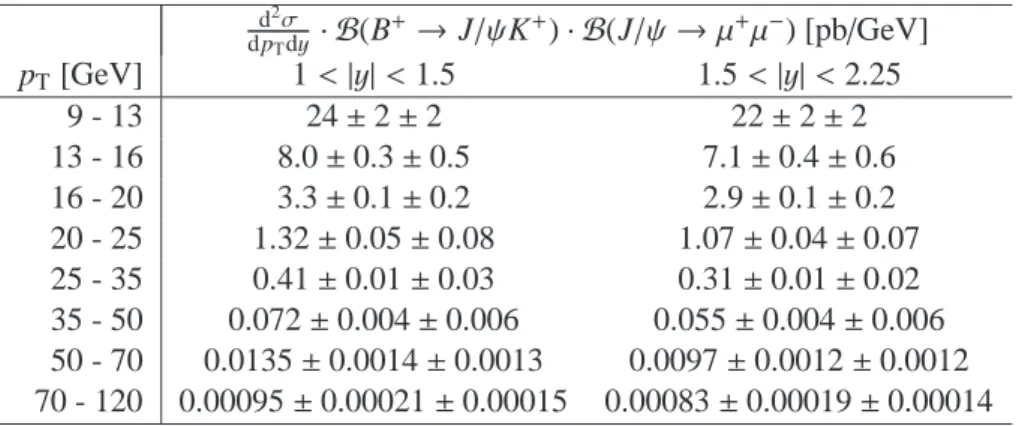
Table 3: Differential cross section measurements for B
+production multiplied by the branching ratio to the final state in p
Tintervals in the rapidity regions 1 <
|y
|< 1.5 and 1.5 <
|y
|< 2.25. The first quoted uncertainty is statistical, the second uncertainty is systematic.
d2σ
dpTdy· B
(B
+→J/ψK
+)
· B(J/ψ
→µ
+µ
−) [pb/GeV]
p
T[GeV] 1 <
|y
|< 1.5 1.5 <
|y
|< 2.25
9 - 13 24
±2
±2 22
±2
±2
13 - 16 8.0
±0.3
±0.5 7.1
±0.4
±0.6
16 - 20 3.3
±0.1
±0.2 2.9
±0.1
±0.2
20 - 25 1.32
±0.05
±0.08 1.07
±0.04
±0.07
25 - 35 0.41
±0.01
±0.03 0.31
±0.01
±0.02
35 - 50 0.072
±0.004
±0.006 0.055
±0.004
±0.006
50 - 70 0.0135
±0.0014
±0.0013 0.0097
±0.0012
±0.0012
70 - 120 0.00095
±0.00021
±0.00015 0.00083
±0.00019
±0.00014
9 Conclusions
The differential cross section for B
+meson production has been studied in pp collisions at 7 TeV with 2.4 fb
−1of integrated luminosity. The B
+meson differential cross section is measured in four rapidity and eight transverse momentum intervals, covering the range
|y
|< 2.25 and 9 GeV < p
T< 120 GeV.
The measured differential cross section is compared with the predictions of next-to-leading order QCD
computations. The predictions are obtained using Powheg+Pythia and MC@NLO+Herwig and are
quoted with an uncertainty from renormalisation and factorisation scales and b-quark mass of the order of
20%-40%. Within these uncertainties, Powheg+Pythia is altogether in agreement with the measurement
in absolute scale and in the dependences on p
Tand y. At low
|y
|, MC@NLO+H
erwigpredicts lower
production cross section and a softer p
Tspectrum than the one observed in data, which becomes harder
for
|y
|> 1. An FONLL calculation, assuming a hadronisation fraction of f
b→B+of (40.1
±1.3)% [30] to fix
the overall scale, is in good agreement with the measurement of dσ/d p
T, in particular for p
T< 30 GeV.
References
[1] P. Nason, S. Dawson and R.K. Ellis, “The total cross section for the production of heavy quarks in hadronic collisions”, Nucl. Phys. B 303 (1988) 607.
[2] P. Nason, S. Dawson and R.K. Ellis, “The one particle inclusive differential cross section for heavy quark production in hadronic collisions”, Nucl. Phys. B 327 (1989) 49.
[3] M. Cacciari, M. Greco, and P. Nason, “The p
Tspectrum in heavy flavor hadroproduction”, JHEP 05 (1998) 007, arXiv:hep-ph/9803400,
M. Cacciari, S. Frixione and P. Nason, “The p
Tspectrum in heavy-flavor photoproduction”, JHEP 0103 (2001) 006, arXiv:hep-ph/0102134.
[4] M. Cacciari, S. Frixione, M. Mangano et al., “QCD analysis of first b cross-section data at 1.96TeV”, JHEP 0407 (2004) 033, arXiv:hep-ph/0312132.
[5] UA1 Collaboration, C. Albajar et al., “Beauty Production at the CERN Proton- anti-Proton Collider”, Phys. Lett. B 186 (1987) 237.
[6] UA1 Collaboration, C. Albajar et al., “Measurement of the Bottom Quark Production Cross Section in Proton-anti-Proton Collisions at
√s
=0.63 TeV”, Phys. Lett. B 213 (1988) 405.
[7] CDF Collaboration, F. Abe et al., “Measurement of the Ratio of the b Quark Production Cross Sections in p ¯p Collisions at
√s
=630 GeV and
√s
=1800 GeV”, Phys. Rev. D 66 (2002) 032002.
[8] CDF Collaboration, F. Abe et al., “Measurement of the bottom quark production cross-section using semileptonic decay electron in p ¯p collisions at
√s
=1.8 TeV”, Phys. Rev. Lett. 71 (1993) 500.
[9] CDF Collaboration, F. Abe et al., “Measurement of the B meson differential cross-section, dσ/d p
T, in p ¯p collisions at
√s
=1.8 TeV”, Phys. Rev. Lett. 75 (1995) 1451.
[10] CDF Collaboration, F. Abe et al., “Measurement of the B
+total cross section and B
+differential cross section dσ/d p
Tin p ¯p collisions at
√s
=1.8 TeV”, Phys. Rev. D 65 (2002) 052005.
[11] D0 Collaboration, B. Abbott et al., “Inclusive µ and B quark production cross-sections in p ¯p collisions at
√s
=1.8 TeV”, Phys. Rev. Lett. 74 (1995) 3548.
[12] D0 Collaboration, B. Abbott et al., “Small angle muon and bottom quark production in p ¯p collisions at
√s
=1.8 TeV”, Phys. Rev. Lett. 84 (2000) 5478.
[13] D0 Collaboration, B. Abbott et al., “Cross section for b jet production in p ¯p collisions at
√
s
=1.8 TeV”, Phys. Rev. Lett. 85 (2000) 5068.
[14] CDF Collaboration, F. Abe et al., “Measurement of the J/ψ meson and b-hadron production cross sections in p ¯p collisions at
√s
=1960 GeV”, Phys. Rev. D 71 (2005) 032001.
[15] CDF Collaboration, F. Abe et al., “Measurement of the B
+production cross section in p ¯p collisions at
√s
=1960 GeV”, Phys. Rev. D 75 (2007) 012010.
[16] CDF Collaboration, F. Abe et al., “Measurement of the b-hadron production cross section using decays to µ
−D
0X final states in p ¯p collisions at
√s
=1960 GeV”, Phys. Rev. D 79 (2009) 092003.
[17] J. C. Collins, R. K. Ellis, “Heavy quark production in very high-energy hadron collisions”, Nucl. Phys. B360 (1991) 330.
[18] LHCb Collaboration, “Measurement of σ(b¯b) at
√s
=7 TeV in the forward region”, Phys.Lett.B694 (2010) 209, arXiv:1009.2731 [hep-ex].
[19] LHCb Collaboration, “Measurement of the B
±production cross-section in pp collisions at
√
s
=7 TeV”, JHEP 04 (2012) 93 arXiv:1202.4812 [hep-ex].
[20] CMS Collaboration, “Measurement of the B
+Production Cross Section in pp Collisions at
√
s
=7 TeV”, Phys. Rev. Lett. 106 (2011) 112001, arXiv:1101.0131 [hep-ex].
[21] CMS Collaboration, “Measurement of the B
0Production Cross Section in pp Collisions at
√
s
=7 TeV”, Phys. Rev. Lett. 106 (2011) 252001, arXiv:1104.2892 [hep-ex].
[22] CMS Collaboration, “Measurement of the B
0sProduction Cross Section with B
0s→J/Ψφ Decays in pp Collisions at
√s
=7 TeV”, Phys. Rev. D 84 (2011) 052008, arXiv:1106.4048 [hep-ex].
[23] CMS Collaboration, “Inclusive b-hadron production cross section with muons in pp collisions at
√
s
=7 TeV”, JHEP 03 (2011) 090, arXiv:1101.3512 [hep-ex].
[24] CMS Collaboration, “Measurement of the cross section for production of b¯bX, decaying to muons in pp collisions at
√s
=7 TeV”, JHEP 6 (2012) 110, arXiv:1203.3458 [hep-ex].
[25] ATLAS Collaboration, “Measurement of the inclusive and dijet cross-sections of b-jets in pp collisions at
√s
=7 TeV with the ATLAS detector” Eur.Phys.J. C71 (2011) 1846, arXiv:1109.6833 [hep-ex].
[26] ATLAS Collaboration, “Measurement of the b-hadron production cross section using decays to D
∗µX final states in pp collisions at
√s
=7 TeV with the ATLAS detector”, Nucl.Phys. B864 (2012) 341-381, arXiv:1206.3122 [hep-ex].
[27] ATLAS Collaboration, “Measurement of the differential cross-sections of inclusive, prompt and non-prompt J/ψ production in proton-proton collisions at
√s
=7 TeV”, Nucl. Phys. B 850 (2011) 387, arXiv:1104.3038 [hep-ex]
[28] ATLAS Collaboration, “The ATLAS Experiment at the CERN Large Hadron Collider”, JINST 3 (2008) S08003.
[29] ATLAS Collaboration, “Performance of the ATLAS Trigger System in 2010”, Eur. Phys. J. C72 (2012) 1849, arXiv:1110.1530 [hep-ex]
[30] J. Beringer et al. (Particle Data Group), Phys. Rev. D86, 010001 (2012)
[31] ATLAS Collaboration, “Measurement of Upsilon Production in 7 TeV pp Collisions at ATLAS”, Submitted to Phys. Rev. D arXiv:1211.7255 [hep-ex]
[32] ATLAS Collaboration, “Charged-particle multiplicities in pp interactions measured with the ATLAS detector at the LHC”, New J. Phys. 13 (2011) 053033
[33] ATLAS Collaboration, “Improved Luminosity Determination in pp Collisions at
√s
=7 TeV using the ATLAS Detector at the LHC”, Submitted to EPJC, arXiv:1302.4393 [hep-ex]
[34] T. Sjostrand, S. Mrenna, and P. Z. Skands, “PYTHIA 6.4 Physics and Manual”, JHEP 0605, 026
(2006), arXiv:hep-ph/0603175
[35] ATLAS Collaboration, “ATLAS tunes of PYTHIA 6 and Pythia 8 for MC11”, ATL-PHYS-PUB-2011-009, http://cdsweb.cern.ch/record/1363300
[36] S. Agostinelli et al., “GEANT4: A simulation toolkit” Nucl. Instrum. Meth. A 506, 250 (2003);
ATLAS Collaboration, “The ATLAS Simulation Infrastructure,” Eur. Phys. J. C 70, 823 (2010), arXiv:1005.4568 [physics.ins-det]
[37] P. Nason, “A new method for combining NLO QCD with shower Monte Carlo algorithms”, JHEP 0411 (2004) 040.
[38] S. Frixione, P. Nason and G. Ridolfi, “A Positive-Weight Next-to-Leading-Order Monte Carlo for Heavy Flavour Hadroproduction”, JHEP 0709 (2007) 126.
[39] S. Frixione and B. R. Webber, “Matching NLO QCD computations and parton shower simulations”, JHEP 0206 (2002) 029.
[40] S. Frixione, P. Nason and B. R. Webber, “Matching NLO QCD and parton showers in heavy flavour production”, JHEP 0308 (2003) 007.
[41] H.-L. Lai, M. Guzzi, J. Huston, Z. Li, P. M. Nadolsky, J. Pumplin and C. -P. Yuan, “New parton distributions for collider physics”, Phys. Rev. D 82 (2010) 074024, arXiv:1007.2241 [hep-ph]
[42] B. Anderson et al., “Parton fragmentation and string dynamics”, Phys. Rep., 97 (1983), p. 31 [43] M.G. Bowler “e+e production of heavy quarks in the string model”, Z. Phys. C, 11 (1981), p. 169 [44] B. Anderson, G. Gustafson, B. Soederberg, “A general model for jet fragmentation”, Z. Phys. C,
20 (1983), p. 317
[45] G. Corcella et al. , “H
erwig6: an event generator for Hadron Emission Reactions With Interfering Gluons”, JHEP 0101 (2001) 010.
[46] B.R. Webber, “A QCD model for jet fragmentation including soft gluon interference”, Nucl. Phys.
B, 238 (1984), p. 492.
[47] M. Cacciari, S. Frixione, N. Houdeau, M. L. Mangano, P. Nason and G. Ridolfi, “Theoretical predictions for charm and bottom production at the LHC,” JHEP 1210 (2012) 137,
arXiv:1205.6344 [hep-ph].
[48] T. Skwarnicki, Ph. D Thesis, DESY F31-86-02 (1986), Appendix E
[49] V. Kostyukhin, “VKalVrt - package for vertex reconstruction in ATLAS.”, ATL-PHYS-2003-031, http://cdsweb.cern.ch/record/685551
[50] M. Cacciari, P. Nason and R. Vogt, “QCD Predictions for Charm and Bottom Production at
RHIC”, Phys. Rev. Lett. 95, 122001 (2005), arXiv:hep-ph/050220
A Additional figures
[GeV]
K±
ψ
mJ/
5.1 5.2 5.3 5.4 5.5 5.6 5.7 5.8
Candidates / 0.01 GeV
0 5000 10000 15000 20000 25000 30000
candidates B+
candidates B-
=7 TeV s Data 2011
L dt = 2.4 fb-1
∫
ATLAS Preliminary
Figure 8: Histograms of the invariant mass of the selected B
+(continuous line) and B
−(dashed line) candidates. No efficiency corrections are applied. The lower yield of B
−with respect to B
+candidates is due to the different reconstruction efficiency of positively and negatively charged hadrons (pions, kaons), resulting from different interaction cross sections with the detector material. After extracting the background, the number of signal B
+events is 63531
±838, and the number of signal B
−events is 62093
±842, where the quoted uncertainties are statistical.
[GeV]
K±
ψ
mJ/
5 5.2 5.4 5.6 5.8 6
Entries / 0.01 GeV
0 5000 10000 15000 20000 25000
K+
ψ
→ J/
B+
K+
χc1,2
→ B+
)+/0
π (K*/K ψ
→ J/
B+/0
π+
ψ
→ J/
B+
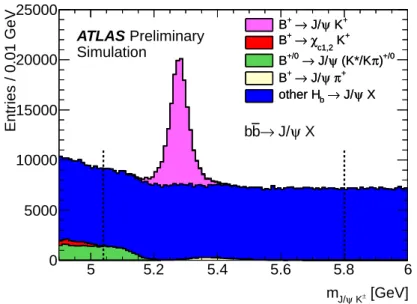
ψ X
→ J/
other Hb
K+
ψ
→ J/
B+
K+
χc1,2
→ B+
)+/0
π (K*/K ψ
→ J/
B+/0
π+
ψ
→ J/
B+
ψ X
→ J/
other Hb
ψ X
→ J/
b b ATLAS Preliminary Simulation