ATLAS-CONF-2010-083 11October2010
ATLAS NOTE
ATLAS-CONF-2010-083
August 19, 2010
Azimuthal Decorrelation in Dijet Events at √
s = 7 TeV
The ATLAS Collaboration
Abstract
The azimuthal decorrelation in central high-p
Tdijet events has been measured with the ATLAS detector in pp interactions at center-of-mass energy √
s = 7 TeV with an integrated luminosity of R
L = 315 ± 35 nb
−1. Results from a next-to-leading order perturbative QCD
calculation and from several Monte Carlo event generators provide a reasonable description
of the normalized differential cross section.
The production of events containing two high transverse momentum (p
T) jets is a key signature of Quantum Chromodynamic (QCD) interactions between partons in pp collisions at high center-of-mass energy ( √
s). QCD predicts how the azimuthal angle with respect to the beam axis (φ) between the two most energetic partons changes when additional radiation is produced. Dijet production at leading order (LO) results in two jets with equal p
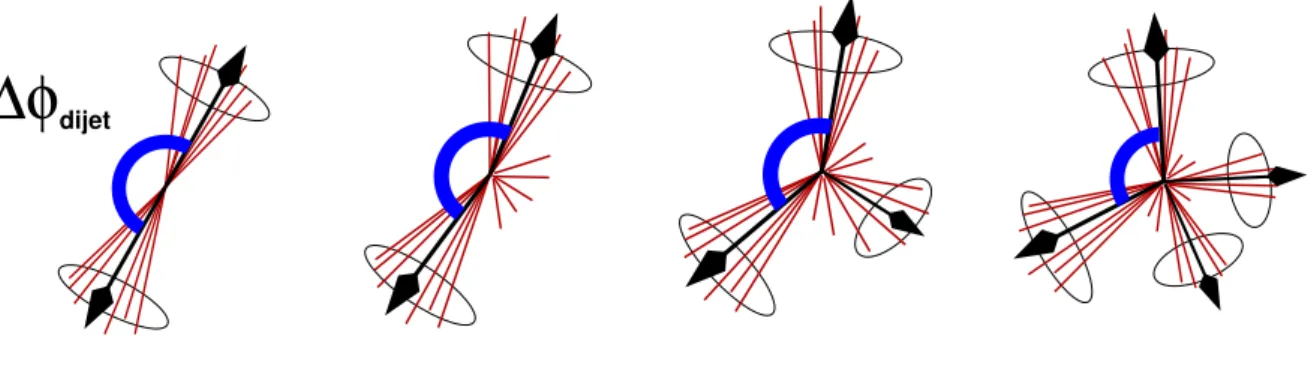
Tand correlated azimuthal angles such that the azimuthal angle be- tween them, ∆ φ, is equal to π. The addition of soft radiation causes small azimuthal decorrelations with
∆ φ ∼ π, whereas ∆ φ << π is evidence of additional hard radiation as illustrated in Fig. 1 [1]. Three-jet production populates the region 2π/3 < ∆ φ < π while smaller values of ∆ φ require additional radiation such as a fourth jet in an event. Distributions in ∆ φ test higher-order perturbative QCD (pQCD) calcu- lations without requiring the reconstruction of additional jets and offer a way to examine the transition between soft and hard QCD processes with a single observable. The proper description of QCD radiation is important for a wide range of precision measurements and in searches for new physical phenomena.
We present a measurement of the normalized differential dijet cross section (1/σ
dijet)(dσ
dijet/d ∆ φ), where the ∆ φ distribution is normalized by the inclusive dijet cross section, σ
dijet, integrated over the same phase space. This construction helps to minimize experimental and theoretical uncertainties in the observable. The anti-k
Tjet algorithm [2] with a radius of R = 0.6 and full four-momentum recombination was used to reconstruct the jets in each event; jets were only considered if reconstructed within an overall acceptance of |y
jet| < 2.8, where y
jetis the jet rapidity
1. Events were required to have the two highest p
Tjets within central rapidity |y
jet| < 0.8, and the second-highest p
Tjet was required to have p
jetT> 100 GeV. Four analysis regions were then defined based on the jet with the highest p
T(p
maxT) in the event: 110 − 160 GeV, 160 − 210 GeV, 210 − 310 GeV, and > 310 GeV.
The measured differential cross sections were compared with the results of the next-to-leading-order (NLO) pQCD calculation NLOJET ++ [3] with the CTEQ 6.6 [4] parton density functions (PDF). AP- PLgrid [5] was used to e ffi ciently calculate the cross section. Fixed-order calculations fail in regions of phase space dominated by soft multi-parton emissions such as ∆ φ ∼ π. Monte Carlo event generators, such as PYTHIA [6, 7], HERWIG [8], and HERWIG ++ [9] use phenomenological parton-shower mod- els to simulate higher-order QCD e ff ects that e ff ectively resum the divergences in these regions of phase space.
ALPGEN [10] is a parton-level event generator often used in studies of multijet backgrounds to top and Higgs production. Multijet configurations are produced by incorporating high-order tree-level pQCD diagrams with the phenomenological parton-shower model from HERWIG and JIMMY [11]. The impact
∆φ
dijetFigure 1: A sketch of the azimuthal angle ∆ φ in jet events. The amount of QCD radiation in the event increases from left to right. The blue arc indicates the azimuthal angle between the two leading jets in the event.
1Rapidity is defined asy=lnE+pz
E−pz
, where E is the energy andpzis the momentum measured along the beam axis.
| [radians]
φ
|∆ /2
π 2π/3 5π/6 π
]-1 [radiansφ∆/dσ dσ1/
10-3
10-2
10-1
1 10 102
=7 TeV s ALPGEN,
| < 0.8
>100 GeV |yjet T
pjet
< 160 GeV
T
110 < pmax
ATLASPreliminary
Partons Σ
5 Partons
≥ 4 Partons 3 Partons 2 Partons
| [radians]
φ
|∆ /2
π 2π/3 5π/6 π
]-1 [radiansφ∆/dσ dσ1/
10-3
10-2
10-1
1 10 102
=7 TeV s ALPGEN,
| < 0.8
>100 GeV |yjet T
pjet
< 210 GeV
T
160 < pmax
ATLASPreliminary
Partons Σ
5 Partons
≥ 4 Partons 3 Partons 2 Partons
| [radians]
φ
|∆ /2
π 2π/3 5π/6 π
]-1 [radiansφ∆/dσ dσ1/
10-3
10-2
10-1
1 10 102
=7 TeV s ALPGEN,
| < 0.8
>100 GeV |yjet T
pjet
< 310 GeV
T
210 < pmax
ATLASPreliminary
Partons Σ
5 Partons
≥ 4 Partons 3 Partons 2 Partons
| [radians]
φ
|∆ /2
π 2π/3 5π/6 π
]-1 [radiansφ∆/dσ dσ1/
10-3
10-2
10-1
1 10 102
=7 TeV s ALPGEN,
| < 0.8
>100 GeV |yjet T
pjet
> 310 GeV
T
pmax
ATLASPreliminary
Partons Σ
5 Partons
≥ 4 Partons 3 Partons 2 Partons
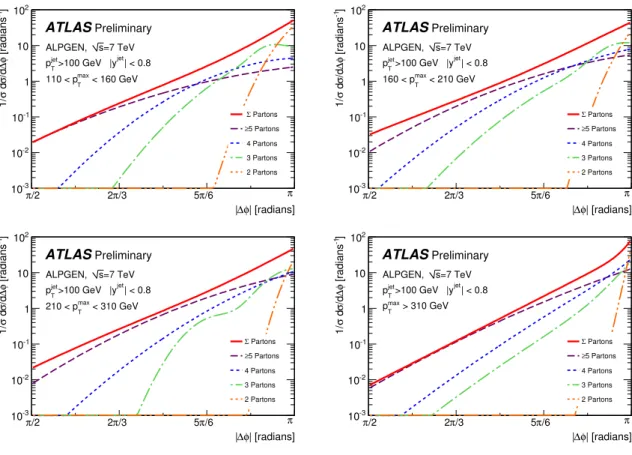
Figure 2: The generated (1/σ
dijet)(dσ
dijet/d ∆ φ) distribution from ALPGEN at √
s = 7 TeV. Individual contributions from 2 → 2 (orange dot-dot-dashed line), 3 (green dot-dashed line), 4 (blue dotted line), and ≥ 5 (purple dashed line) production are shown. The total contribution (indicated by “ Σ Partons”) is represented by the solid red line. The minimum p
Trequirement is 100 GeV, and the subfigures reflect the leading jet p
maxTbins: 110 − 160 GeV, 160 − 210 GeV, 210 − 310 GeV, and > 310 GeV.
of multi-parton production on the ∆ φ observable is illustrated in Fig. 2. The individual components from 2 → 2, 3, 4, and ≥ 5 production in ALPGEN, and the total contributions are shown for each p
maxTbin. Note that although the two highest p
Tjets in the event must be central in rapidity, the shape of the normalized ∆ φ distribution is sensitive to the contribution from additional jets in the event. Contributions from 2 → 2 diagrams dominate near ∆ φ ∼ π, as expected, while the higher-order pQCD tree-level diagrams provide the azimuthal decorrelation in the region ∆ φ << π. The 2 → 5 diagrams dominate in the region near ∆ φ ∼ π/2. These 2 → 5 diagrams are absent from the NLO pQCD calculation which is NLO in three-parton production and LO in four-parton production. Verification of the performance of the Monte Carlo event generators using high-statistics QCD processes is of clear interest for applications that require accurate description of processes with several jets. The QCD radiation is similar to that in W and Z production with additional jets, which are background processes in top quark studies and searches for the Higgs boson. Similar data at lower √
s have been used in past efforts to tune initial-state radiation parameters in these Monte Carlo event generators [12, 1].
The measurement was made using the ATLAS detector which is described in detail elsewhere [13].
The inner detector consists of a silicon pixel detector, a silicon microstrip detector, and a transition ra- diation tracker within a 2 T solenoid magnet and covers the pseudorapidity
2range |η| < 2.5. These
2Pseudorapidity is defined asη=−ln(tan(θ/2)), where the polar angleθis taken with respect to the positivezdirection.
tracking detectors were used to reconstruct tracks and vertices including the primary pp interaction ver- tex. The central calorimeters are particularly important to this analysis, and include both electromagnetic and hadronic sections. High granularity liquid-argon (LAr) electromagnetic sampling calorimeters cover the range |η| < 3.2. The hadronic calorimetry in the range |η| < 1.7 is provided by a scintillator-tile calorimeter. In the end-caps and forward regions (1.5 < |η| < 4.9), LAr calorimetry is used for both electromagnetic and hadronic measurements.
The trigger system uses a custom-built hardware system with a fixed latency of 2.5 µs to select events for further analysis. This measurement was based on events recorded using either the minimum-bias trigger scintillators (MBTS) or by a calorimeter jet trigger. The MBTS detector consists of 32 scintillator counters organized into disks on each inner face of the end-cap calorimeter cryostats, covering 2.09 <
|η| < 3.84, such that the disk surface is perpendicular to the beam direction. A high-rate minimum- bias trigger, requiring at least one MBTS scintillator, was used to record the events in this analysis for the first R
L = 254 µb
−1of integrated luminosity. The jet trigger uses coarse calorimeter information to identify the position of jets with high transverse energy (E
T). These jets were reconstructed with a sliding window algorithm using towers formed from the electromagnetic and hadronic calorimeters with a granularity of ∆ φ × ∆ η = 0.2 × 0.2 for |η| < 3.2. The jet trigger recorded R
L = 315 nb
−1with a threshold of E
T> 15 GeV (electromagnetic scale
3). This trigger was on the e ffi ciency plateau for events containing the high p
Tjets required by this analysis. The total dataset used thus corresponded to an integrated luminosity of R
L = 315 ± 35 nb
−1. The luminosity was based on beam separation scans for an absolute calibration with a total uncertainty of 11%, dominated by the uncertainty of the LHC beam current [14].
Both data and simulated events were fully reconstructed using objected-oriented analysis software running on a distributed computing grid. The anti-k
Tjet algorithm was used to reconstruct jets from par- tons in the NLO pQCD calculation, from particles in the Monte Carlo event generators, and from topo- logical clusters of calorimeter energy deposits [15] in the data and detector-level GEANT4-based [16]
simulation. Cluster energies were calibrated to the electromagnetic energy scale. Jets, formed from the clusters, were further calibrated to correct for the fact that the ATLAS calorimeter has lower response to hadronic energy than to electromagnetic energy, and for the energy absorbed in the dead material in front of the calorimeter. The jet energy calibration was based on the Monte Carlo simulation. Test-beam data and in situ measurements [17] show that the detector simulation models the calorimeter response to single hadrons to within 5%. The overall correction to the jet p
Twas ≈ 35% for central jets with p
T> 60 GeV.
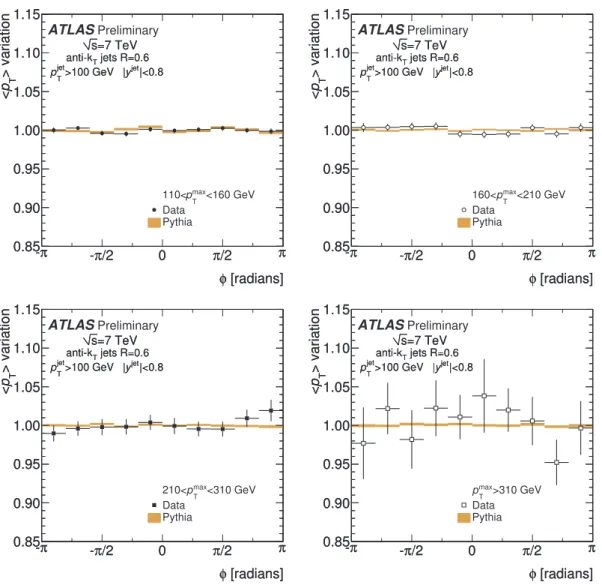
Full details of the energy scale evaluation are given elsewhere [18]. The final energy scale calibration and its estimated uncertainty account for uncertainties in the modeling of hadronic showers in the detec- tor, the description of calorimeter noise, the material in front of the calorimeter, and uncertainties in the translation of the test-beam energy scale to the in situ calorimeter. The effects of multiple pp interactions were included in this uncertainty. Finally, the model-dependent uncertainty due to the hadronization, parton shower, and underlying event models was estimated by comparing the correction derived using a sample of PYTHIA events to that derived using a sample of ALPGEN+HERWIG+JIMMY events, and was found to be < 3%. The jet energy calibration was averaged over the φ of the jet. This leads to the possibility of a φ-dependent variance not otherwise covered by the systematic uncertainties estimated as part of the overall calibration effort. We tested the appropriateness of using this average for the ∆ φ distribution by examining the average p
Tof the jet binned in the jet φ for each of the four p
maxTbins.
The variation of the jet energy scale with respect to φ is shown in Figure 3. It is clear from the level of agreement between the simulation and data that the variation of the average p
Taround unity is well cov- ered by the 5 − 7% uncertainties already associated with the jet energy scale calibration. The systematic
3The electromagnetic scale is the basic calorimeter signal scale for the ATLAS calorimeters. It gives the correct scale for the energy deposited in electromagnetic showers, while it does not correct for the lower hadron shower response nor for energy losses in dead material.
[radians]
φ π
- -π/2 0 π/2 π
> variation Tp<
0.85 0.90 0.95 1.00 1.05 1.10 1.15
<160 GeV
max
pT
110<
Data Pythia
[radians]
φ π
- -π/2 0 π/2 π
> variation Tp<
0.85 0.90 0.95 1.00 1.05 1.10 1.15
=7 TeV s
jets R=0.6 anti-kT
|<0.8 yjet
>100 GeV |
jet
pT
ATLASPreliminary
=7 TeV s
jets R=0.6 anti-kT
|<0.8 yjet
>100 GeV |
jet
pT
[radians]
φ π
- -π/2 0 π/2 π
> variation Tp<
0.85 0.90 0.95 1.00 1.05 1.10 1.15
<210 GeV
max
pT
160<
Data Pythia
[radians]
φ π
- -π/2 0 π/2 π
> variation Tp<
0.85 0.90 0.95 1.00 1.05 1.10 1.15
=7 TeV s
jets R=0.6 anti-kT
|<0.8 yjet
>100 GeV |
jet
pT
ATLASPreliminary
=7 TeV s
jets R=0.6 anti-kT
|<0.8 yjet
>100 GeV |
jet
pT
[radians]
φ
-π -π/2 0 π/2 π
> variation Tp<
0.85 0.90 0.95 1.00 1.05 1.10 1.15
<310 GeV
max
pT
210<
Data Pythia
[radians]
φ
-π -π/2 0 π/2 π
> variation Tp<
0.85 0.90 0.95 1.00 1.05 1.10 1.15
=7 TeV s
jets R=0.6 anti-kT
|<0.8 yjet
>100 GeV |
jet
pT
ATLASPreliminary
=7 TeV s
jets R=0.6 anti-kT
|<0.8 yjet
>100 GeV |
jet
pT
[radians]
φ
-π -π/2 0 π/2 π
> variation Tp<
0.85 0.90 0.95 1.00 1.05 1.10 1.15
>310 GeV
max
pT
Data Pythia
[radians]
φ
-π -π/2 0 π/2 π
> variation Tp<
0.85 0.90 0.95 1.00 1.05 1.10 1.15
=7 TeV s
jets R=0.6 anti-kT
|<0.8 yjet
>100 GeV |
jet
pT
ATLASPreliminary
=7 TeV s
jets R=0.6 anti-kT
|<0.8 yjet
>100 GeV |
jet
pT
Figure 3: The average jet p
Tvariation vs. φ, showing the φ dependence of the jet energy scale in data and the PYTHIA MC sample.
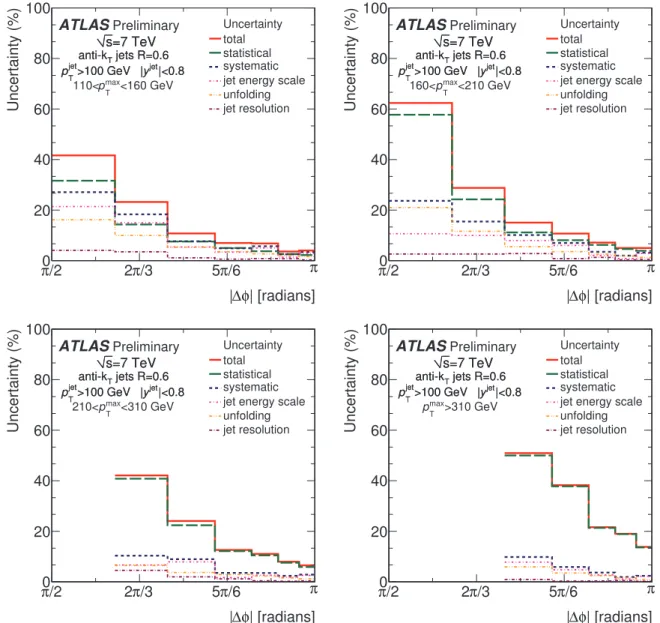
uncertainty associated with the jet energy calibration for the (1/σ
dijet)(dσ
dijet/d ∆ φ) observable is shown as a function of ∆ φ for each of the p
maxTbins in Fig. 4.
Events, selected using the trigger described above, were required to have a vertex that was consistent with the beam spot, reconstructed within |z| < 10 cm of the center of the detector, and that was formed from at least 5 tracks. Only those events that also had jets with p
T> 100 GeV within rapidity |y| < 2.8 were considered in this analysis. Additional selection criteria were applied to these jets to suppress contributions from noise, problematic detector regions, and cosmic rays [19]. Of the 7.5 million events that satisfied these criteria, 7398 events had at least two jets where both leading jets were within |y| < 0.8 and where the leading jet had p
T> 110 GeV.
The correction for the finite resolution of the detector and for residual inefficiencies in the vertex
and jet selection was applied in a single step using a bin-by-bin migration function evaluated with fully-
simulated events generated with PYTHIA. The correction factor in the shape of the ∆ φ distribution
ranged from 0% to 20% over the range from π/2 to π. Fully simulated events from HERWIG, HER-
WIG ++ , and ALPGEN were used to cross check this unfolding correction.
| [radians]
φ
|∆
π/2 2π/3 5π/6 π
Uncertainty (%)
<160 GeV
max
pT
110<
Uncertainty total statistical systematic jet energy scale unfolding jet resolution
0 20 40 60 80 100
=7 TeV s
jets R=0.6 anti-kT
|<0.8 yjet
>100 GeV |
jet
pT
ATLASPreliminary
=7 TeV s
jets R=0.6 anti-kT
|<0.8 yjet
>100 GeV |
jet
pT
| [radians]
φ
|∆
π/2 2π/3 5π/6 π
Uncertainty (%)
<210 GeV
max
pT
160<
Uncertainty total statistical systematic jet energy scale unfolding jet resolution
0 20 40 60 80 100
=7 TeV s
jets R=0.6 anti-kT
|<0.8 yjet
>100 GeV |
jet
pT
ATLASPreliminary
=7 TeV s
jets R=0.6 anti-kT
|<0.8 yjet
>100 GeV |
jet
pT
| [radians]
φ
|∆
π/2 2π/3 5π/6 π
Uncertainty (%)
<310 GeV
max
pT
210<
Uncertainty total statistical systematic jet energy scale unfolding jet resolution
0 20 40 60 80 100
=7 TeV s
jets R=0.6 anti-kT
|<0.8 yjet
>100 GeV |
jet
pT
ATLASPreliminary
=7 TeV s
jets R=0.6 anti-kT
|<0.8 yjet
>100 GeV |
jet
pT
| [radians]
φ
|∆
π/2 2π/3 5π/6 π
Uncertainty (%)
>310 GeV
max
pT
Uncertainty total statistical systematic jet energy scale unfolding jet resolution
0 20 40 60 80 100
=7 TeV s
jets R=0.6 anti-kT
|<0.8 yjet
>100 GeV |
jet
pT
ATLASPreliminary
=7 TeV s
jets R=0.6 anti-kT
|<0.8 yjet
>100 GeV |
jet
pT
Figure 4: The uncertainty in the normalized differential cross section vs. ∆ φ. Each component of the systematic uncertainty is displayed separately; adding each component in quadrature results in the overall systematic uncertainty (blue dashed line). The components of the systematic uncertainty are the jet energy scale (pink dot-dashed line), the unfolding uncertainty (yellow dot-dot-dashed line), and the jet resolution (purple dot-dashed line). The overall statistical uncertainty (green long-dashed line) and resulting total uncertainty (red solid line) are also shown. The subfigures reflect the leading jet p
maxTbins:
110 − 160 GeV, 160 − 210 GeV, 210 − 310 GeV, and > 310 GeV.
The leading sources of systematic uncertainty in the di ff erential cross section measurement are the
jet energy scale calibration, the statistical uncertainty in the unfolding correction factor, and the p
Tand angular resolution of jets. (The systematic uncertainties due to the p
T, φ, and y resolutions each
ranged from ≈ 0.5% near ∆ φ ∼ π to 2 − 3% near π/2.) In all cases, the systematic uncertainties were
symmetrized by taking the maximum value of the up and down deviations from the central mean. The
overall levels of the systematic uncertainty, a comparison with the statistical uncertainty, and the overall
| [radians]
φ
∆
|
π /2 2 π /3 5 π /6 π ]
-1[radians φ ∆ /d σ d σ 1/
10
-310
-210
-11 10 10
210
310
4〈
〉
〈
〉 〉 〈 〉 〈
〈
〉
〈
〉
〈
〉
〈
〉 〉 〈 〉 〈 〉 〈
〈
〉
〈
〉
〈
〉
〈
〉 〉 〈 〉 〈 〉 〈
〈
〉
〈
〉
〈
〉
〈
〉 〉 〈 〉 〈 〉 〈 dt=315 nb
-1∫ L Data
3
)
× 10
>310 GeV (
max
p
T2
)
× 10
<310 GeV (
max
p
T210<
1
)
× 10
<210 GeV (
max
p
T160<
0
)
× 10
<160 GeV (
max
p
T110<
systematic uncertainty Pythia
Herwig Herwig++
Alpgen
〈
〉
=7 TeV s
jets R=0.6 anti-k
T|<0.8 y
jet>100 GeV |
jet
p
TATLAS Preliminary
=7 TeV s
jets R=0.6 anti-k
T|<0.8 y
jet>100 GeV |
jet
p
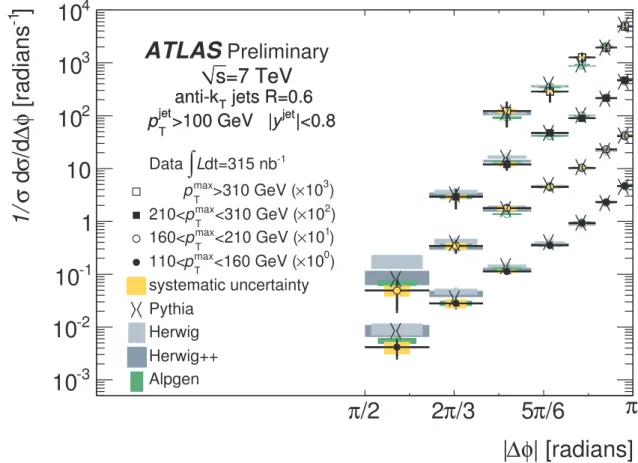
TFigure 5: The normalized di ff erential cross section (1/σ
dijet)(dσ
dijet/d ∆ φ) binned in four regions based on the p
Tof the leading jet. The data are represented by the points; the different bins in p
maxTare scaled by arbitrary multiplicative factors for display purposes. The error bar indicates the level of total uncertainty;
the systematic uncertainties are represented by the filled yellow box centered on the data points. Overlaid on the data are the predictions from four Monte Carlo generators: PYTHIA ( ih symbol), HERWIG (gray boxes), HERWIG ++ (blue boxes), and ALPGEN (green boxes). The simulation was scaled by the same factor as the data. The filled areas represent the statistical uncertainty in the Monte Carlo sample; the width of the boxes along the x-axis have been arbitrarily limited for clarity. The uncertainties on the PYTHIA Monte Carlo points are too small to be visible.
uncertainty formed by adding the two in quadrature, is shown in Fig. 4 for each of the four p
maxTbins.
The measurement is statistics-limited except for a few bins near ∆ φ ∼ π.
The normalized differential dijet cross section (1/σ
dijet)(dσ
dijet/d ∆ φ) is shown for each of the four
p
maxTbins as a function of ∆ φ in Fig. 5. The spectra are strongly peaked at ∆ φ ≈ π. Overlaid on the
data points in Fig. 5 are the predictions from four Monte Carlo generators: PYTHIA, HERWIG, HER-
WIG++, and ALPGEN. The filled regions represent the statistical uncertainties in the different Monte
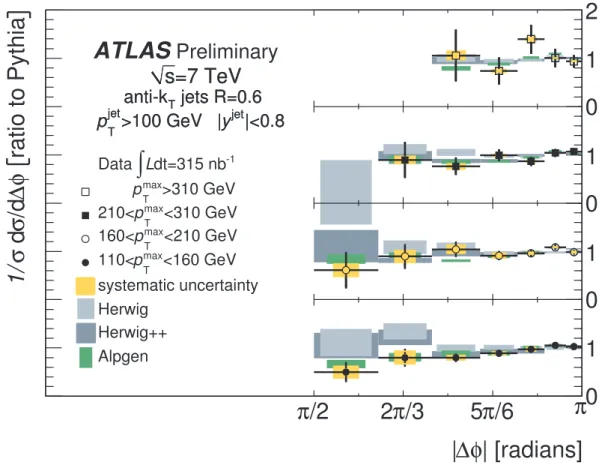
Carlo simulations. Ratios of the data with respect to the PYTHIA sample are shown in Fig. 6. Ratios of
HERWIG, HERWIG ++ , and ALPGEN to the PYTHIA result are also shown. There is general agreement
between the Monte Carlo predictions and the measured cross section within the overall uncertainties for
the highest three p
Tbins. ALPGEN shows good agreement with the data for all the p
Tbins.
| [radians]
φ
∆
|
π /2 2 π /3 5 π /6 π
ratio to Pythia φ ∆ /d σ d σ 1/
dt=315 nb
-1∫ L Data
>310 GeV
max
p
T<310 GeV
max
p
T210<
<210 GeV
max
p
T160<
<160 GeV
max
p
T110<
systematic uncertainty Herwig
Herwig++
Alpgen
0 1 0 1 0 1 0 1 2
=7 TeV s
jets R=0.6 anti-k
T|<0.8 y
jet>100 GeV |
jet
p
TATLAS Preliminary
=7 TeV s
jets R=0.6 anti-k
T|<0.8 y
jet>100 GeV |
jet
p
TFigure 6: Ratio of the normalized di ff erential cross section (1/σ
dijet)(dσ
dijet/d ∆ φ) with respect to the prediction from the PYTHIA Monte Carlo. The measurements are binned in four regions based on the p
Tof the leading jet. The data are represented by the points. The error bar indicates the level of total uncertainty; the systematic uncertainties are represented by the filled yellow box centered on the data points. Overlaid on the data are the predictions from three Monte Carlo generators: HERWIG (gray boxes), HERWIG ++ (blue boxes), and ALPGEN (green boxes). The simulation was scaled by the same factor as the data. The filled areas represent the statistical uncertainty in the Monte Carlo sample; the width of the boxes along the x-axis have been arbitrarily limited for clarity.
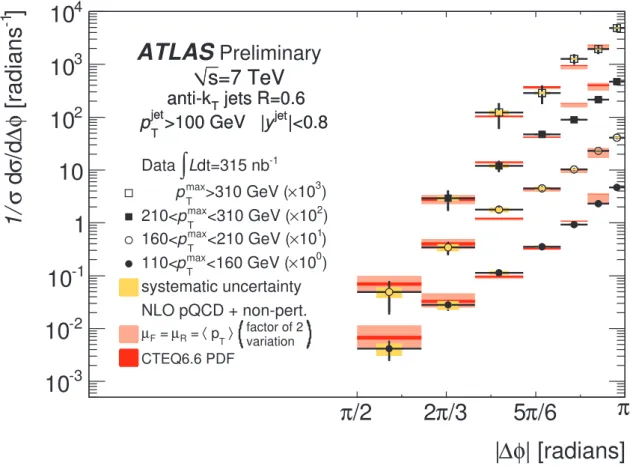
Overlaid on the data points in Fig. 7 are the results of a pQCD calculation obtained using NLOJET++
through APPLGrid running FastJet [20]. The observable was calculated from the ratio of the predictions for 2 → 3 processes (dσ
dijet/d ∆ φ) and 2 → 2 processes (σ
dijet). NLO pQCD provides a good description of the data. Results from pQCD at large ∆ φ in Fig. 7 were excluded because the fixed-order perturbation theory calculation of the 2 → 3 processes (dσ
dijet/d ∆ φ) diverges at ∆ φ ≈ π where soft processes domi- nate. The renormalization and factorization scales in the calculation were taken to be equal to the average p
Tof the two leading jets hp
Ti , and were varied upwards and downwards by a factor of two to determine the resulting uncertainty. The uncertainties from the CTEQ6.6 PDF [21] were also calculated and are approximately (1 − 7)%; the largest uncertainties are near π/2. The theory calculation is corrected for non-perturbative effects due to hadronization and underlying event. These effects tend to cancel, so the overall correction factor is quite small, at the level of (1 − 3)%; the largest correction factors are near π/2.
This correction was calculated using the AGILe and RIVET [22] interface to PYTHIA [6] and has been
applied in the region where the NLO pQCD calculation is valid ( ∆ φ away from π). The theory calculation
| [radians]
φ
∆
|
π /2 2 π /3 5 π /6 π ]
-1[radians φ ∆ /d σ d σ 1/
10
-310
-210
-11 10 10
210
310
4dt=315 nb
-1∫ L Data
3
)
× 10
>310 GeV (
max
p
T2
)
× 10
<310 GeV (
max
p
T210<
1
)
× 10
<210 GeV (
max
p
T160<
0
)
× 10
<160 GeV (
max
p
T110<
systematic uncertainty NLO pQCD + non-pert.
variation factor of 2
T〉
〈 p
R = µ
F = µ
CTEQ6.6 PDF
=7 TeV s
jets R=0.6 anti-k
T|<0.8 y
jet>100 GeV |
jet
p
TATLAS Preliminary
=7 TeV s
jets R=0.6 anti-k
T|<0.8 y
jet>100 GeV |
jet
p
TFigure 7: The normalized di ff erential cross section (1/σ
dijet)(dσ
dijet/d ∆ φ) binned in four regions based on the p
Tof the leading jet. The data are represented by the points; the different bins in p
maxTare scaled by arbitrary multiplicative factors for display purposes. The error bar indicates the level of total uncertainty and the systematic uncertainties are represented by the filled yellow box centered on the data points.
Overlaid on the data are the results from NLO pQCD (NLOJET++ calculated with APPLGrid) with the CTEQ6.6 PDF. The factorization and renormalization scales are set to h p
Ti, and the calculation is corrected for non-perturbative e ff ects due to hadronization and underlying event. The PDF uncertainty is indicated by the width of the red band, and the scale uncertainty is indicated by the larger pink band.
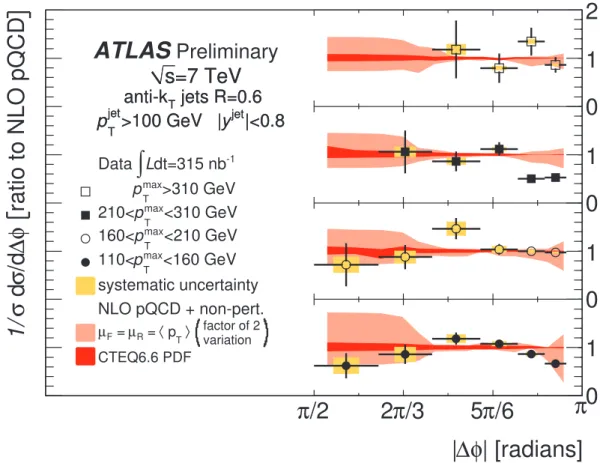
provides a reasonable description of the data as shown in Fig. 8 which depicts the ratio of the normalized differential cross section in data to that in NLO pQCD. The relatively large scale uncertainties between π/2 < ∆ φ . 2π/3 result from the LO 2 → 4 contributions in the pQCD calculation.
Azimuthal decorrelations in dijet events have been measured by the ATLAS collaboration with R L = 315 ± 35 nb
−1at √
s = 7 TeV. The data have been corrected for experimental resolutions extracted from a detector simulation tuned with extensive test beam studies and confirmed with in situ measurements. The normalized di ff erential cross section (1/σ
dijet)(dσ
dijet/d ∆ φ) has been compared with the results from various Monte Carlo event generators and a NLO pQCD calculation. The performance of the leading logarithmic parton-shower Monte Carlo generators is satisfactory in describing the data;
these distributions can be used to further refine initial-state radiation parameters. ALPGEN provides the best description of the data among the event generators as might be expected given that it includes higher order tree-level multijet configurations. The NLO pQCD calculation shows good agreement with the data in each of the leading jet p
Tbins, thus providing an early look at multijet production at √
s = 7 TeV
| [radians]
φ
∆
|
π /2 2 π /3 5 π /6 π
ratio to NLO pQCD φ ∆ /d σ d σ 1/
dt=315 nb
-1∫ L Data
>310 GeV
max
p
T<310 GeV
max
p
T210<
<210 GeV
max
p
T160<
<160 GeV
max
p
T110<
systematic uncertainty NLO pQCD + non-pert.
variation factor of 2
T〉
〈 p
R = µ
F = µ
CTEQ6.6 PDF
0 1 0 1 0 1 0 1 2
=7 TeV s
jets R=0.6 anti-k
T|<0.8 y
jet>100 GeV |
jet
p
TATLAS Preliminary
=7 TeV s
jets R=0.6 anti-k
T|<0.8 y
jet>100 GeV |
jet