Nectarios Ch. Benekos
Max-Planck-Institut fr Physik Munich, Germany and
Matthias Schott
Ludwig-Maximilians-University, Munich, Germany
The study of the Z Boson at the ATLAS experiment provides several interesting aspects. The measurements of cross section and transverse mo- mentum spectrum (p
t) of the Z Boson at ATLAS provide additional tests of the standard model and may be sensitive to exotic physics processes.
Z-Boson production is also a common background process for many other physics analysis and must be understood very well. The achievable preci- sion of the cross section σ(pp → Z/γ → µ
+µ
−) with first data of LHC at the ATLAS detector are discussed.
PACS numbers: 13.38.Dg, 14.70.Hp
1. Introduction
The ATLAS detector [1], currently being installed at CERN, is designed to provide precise measurements of 14TeV proton-proton collisions at LHC.
One of the major detector components is the Muon Spectrometer (MS) which consists out of more than 1,200 single drift-tube chambers. The MS provides an independent high precision measurement of the transverse momentum p
Tof muons.
The mass spectrum of the Z-Boson is known to very high precision from LEP experiments and therefore can be used as a physics process for various calibration tasks.
In this study first results on the achievable precision of the cross section measurement
∗
Physics at LHC, Cracow, 2006
(1)
Reconstructed DiMuon-Mass [GeV]
50 60 70 80 90 100 110 120
Normalized to Cross-Section
(>60GeV) µ µ
→ γ Z/
(<60GeV) µ µ
→ γ Z/
τ τ
→ Z
ν µ
→ W
µ µ
→ b b
Fig. 1. Reconstructed DiMuon Mass for the signal and various back- ground processes
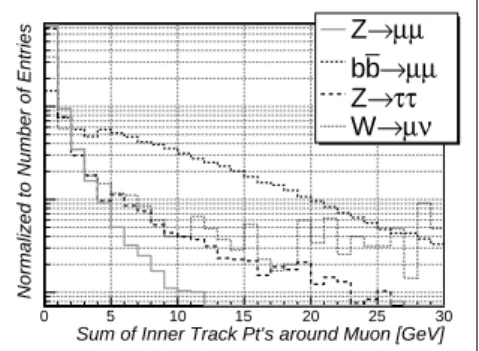
Sum of Inner Track Pt’s around Muon [GeV]
0 5 10 15 20 25 30
Normalized to Number of Entries
µ µ
→ Z
µ µ
→ b b → τ τ Z → µ ν W
Fig. 2. Sum of inner Tracks around muons within a cone-radius of 0.5 for signal and various background processes
σ(pp → Z/γ → µ
+µ
−) = N
Cand− N
Backgroundǫ
totalR Ldt (1)
with the first 10 pb
−1of LHC data with the ATLAS detector are discussed.
In a first step a cut based signal selection is presented and a method for background estimation N
Backgroundbased on real data is discussed. The ef- ficiency factor ǫ
totalin Equation 1 includes all contributions from the trigger system, the muon spectrometer and the applied cuts. In a second step of this study we explore the possibility to use the Z-Boson resonance and its decay into two muons to determine some of these efficiencies namely the MS reconstruction efficiencies ǫ
IDand momentum resolution within data which is indispensable for the a cross-section measurement.
2. Signal Selection
The decay of the Z-Boson into two muons has a very characteristic signa- ture: two high energetic and isolated muons in the final state are produced.
We expect a significant contribution of QCD-background due to the over-
whelming cross-section of QCD processes. It is assumed that QCD-processes
which result in two high energetic muons are dominated by the decay of b ¯ b-
pairs into two muons. Moreover, the decay of a W
±-Boson into one high
energetic muon and a neutrino plus an additional muon from a QCD-jet and
the process Z → τ τ → µνµν were studied as possible backgrounds in this
analysis. The expected invariant dimuon mass spectrum without any ap-
plied cuts is shown in Figure 1 and it was generated with the full simulation
of the ATLAS Detector.
For the selection we require at least two reconstructed tracks with op- posite charge in the pseudorapidity (η) range between −2.6 and 2.6 in the Muon Spectrometer. These tracks are considered to be muons. The in- variant mass of the two muons M
µµmust be larger than 60 GeV
1. The minimal transverse momentum p
minThas to be larger than 10 GeV, while the maximal transverse momentum p
minTof the two muons must be larger 15 GeV. The difference of the azimuthal angle φ of the two muon tracks is required to be greater than 2 rad.
Muons which result from QCD-processes tend to be not isolated as indi- cated in Figure 2. This leads to the following requirements: The number of reconstructed tracks in the inner detector within a cone radius of 0.5 around each muon (N
IT) must be smaller than 7, while the sum of the transverse momenta of these tracks must fulfill PNIp
T < 8 GeV. The cone-distance is defined as
c = q (φ
µ− φ
IT)
2+ (η
µ− η
IT)
2The last cut requires that the reconstructed jet energy within a cone radius of 0.5 around each muon PJ etsE
T is smaller than 20 GeV. A muon is called isolated if these three requirements are fulfilled.
In total, these cuts lead to an expected purity of ρ = 99.75% and an efficiency normalized to a single muon trigger above 6 GeV of 44.68%.
3. Background Estimation
The QCD background is estimated from the number of events N
N on Isolatedwhere the two muon tracks pass all cuts presented in section 2 except the isolation cuts, hence are not isolated. According to Monte Carlo studies that more than 90% of these selected events are due to b ¯ b decays (Figure 3).
The ratio r
QCDof the number of events which have two isolated muons to events which have no isolated muons, is expected to be described sufficiently good by the full ATLAS simulation. The number of QCD-events which pass all selection cuts can then be estimated by
N
QCD−Background= r
QCD× N
N on Isolated(2) On similar grounds the background contribution due to W → µν can be estimated. The advantage of this method is the independence of any Monto Carlo cross-section prediction. Only the ratio of r
QCDdepends on Monte Carlo simulations. We assume that these ratios have an uncerainty
1
In the very rare case in which more than 2 reconstructed tracks pass all applied cuts,
the muon pair with the invariant mass closer to the Z-Boson mass is considered
Reconstructed DiMuon Mass [GeV]
40 50 60 70 80 90 100 110
Normalized to Cross-Section
(>60GeV) µ µ
→ γ Z/
τ τ
→ Z
ν µ
→ W
µ µ
→ b b
Fig. 3. Reconstructed DiMuon Mass requiring two non isolated muons with opposite charge
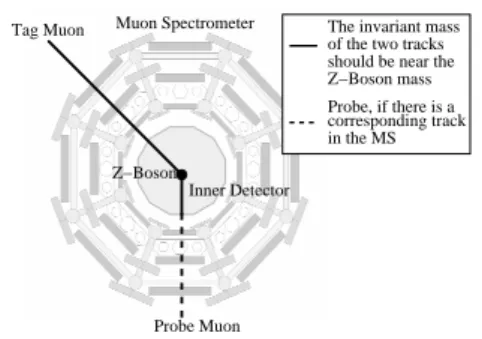
Tag Muon
Probe Muon Z−Boson
The invariant mass of the two tracks should be near the Z−Boson mass corresponding track in the MS Probe, if there is a
Inner Detector Muon Spectrometer
Fig. 4. Sketch of the Tag and Probe method
of 100% as a very conservative estimation. This leads to an expected overall background contribution of
N
BackgroundN
Z→µµ= 0.25% ± 0.20% (3)
4. Measurement of Detector Properties with Data
The tag and probe method (see Figure 4) can be used to determine the reconstruction efficiency of the ATLAS Muon Spectrometer ǫ
M Sand the efficiency of isolation cuts ǫ
Isopresented in section 2. This method uses two tracks which have an invariant mass close to the Z-Boson mass. Hard cuts are applied on one candidate muon (e.g. isolation cuts) which is called tag muon and the other muon is used (probe muon) to test a specific property.
Two reconstructed tracks in the Inner Detector of ATLAS of which one can be associated with a track in the Muon Spectrometer (tag muon) are required to determine the reconstruction efficiency of the ATLAS Muon Spectrometer. It is tested in a second step, if a corresponding track for the probe muon also exists in the MS. On this grounds the reconstruction efficiency of the MS can be calculated if this efficiency is assumed to be independent. The comparison between ǫ
M Sdetermined by Monte Carlo Truth and ǫ
M Sdetermined with Tag and Probe is shown in Figure 5, which indicates an agreement within the statistical uncertainties. The following cuts are applied on both - tag and probe muon - to reduce the background:
• |91 GeV − M
µµ| < 10 GeV
• p
tagT> 20GeV, p
probeT> 20 GeV
• both tracks are required to be isolated
-3 -2 -1 0 1 2 3η
Efficiency
0.6 0.65 0.7 0.75 0.8 0.85 0.9 0.95 1
Tag and Probe Monte Carlo Truth
Fig. 5. Muon Reconstruction Effi- ciency determined with the tag and probe approach in comparison with Monte Carlo Truth informatio
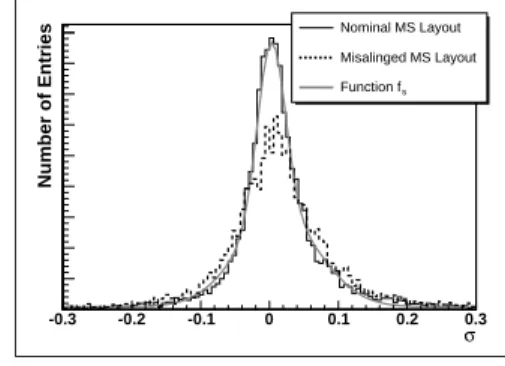
/ ndf
χ2 147.6 / -4
p0 0.002801 ± 0.000523 p1 289.8 ± 5.8 p2 -0.02802 ± 0.00048 p3 4.57 ± 0.34
-0.3 -0.2 -0.1 0 0.1 0.2 σ0.3
Number of Entries
0 50 100 150 200 250 300 350 400
450 χ2 / ndf 147.6 / -4
p0 0.002801 ± 0.000523 p1 289.8 ± 5.8 p2 -0.02802 ± 0.00048 p3 4.57 ± 0.34 Nominal MS Layout Misalinged MS Layout
s Function f