Physik Department
Alignment of the ATLAS Muon Spectrometer Using Muon Tracks
Diploma Thesis
by
Bernhard Bittner
June 9, 2009
When charged particles of more than 5 TeV pass through a bubble chamber, they
leave a trail of candy. (http://xkcd.com/401/)
Contents
I ATLAS and the LHC 1
1 Introduction and Outline 3
2 The ATLAS Detector 5
2.1 The ATLAS Coordinate System and Conventions . . . . 5
2.2 The Detector Components . . . . 5
2.3 The Magnetic Field Conguration . . . . 8
II The ATLAS Muon Spectrometer 11 3 The Muon Spectrometer 13 3.1 The Layout of the Muon Spectrometer . . . 13
3.2 The MDT Chambers . . . 13
4 Commissioning of the MDT Chambers in ATLAS 19 4.1 The Noise Rate of the MDT Chambers . . . 20
4.2 Commissioning of the MDT Chambers in ATLAS . . . 26
4.3 Overview of the Commissioning Status . . . 27
III The Alignment of the ATLAS Muon Spectrometer 31 5 Alignment Concepts 33 5.1 Why Is Alignment of the MDT Chambers Needed? . . . 33
5.2 Momentum Determination with the Sagitta Method . . . 34
5.3 Impact of Misalignment on the Sagitta Measurement . . . 35
5.4 The ATLAS Optical Alignment System . . . 37
5.5 Alignment Using Muon Tracks . . . 39
6 Segment Reconstruction 41 6.1 Segment Reconstruction for Curved Tracks . . . 41
6.2 Tests of the Segment Reconstruction Algorithm . . . 43
6.3 Conclusions . . . 48
7 Alignment with Straight Tracks 51 7.1 Alignment with Straight Tracks Using χ
2Minimisation . . . 51
7.2 Simplied Alignment Method . . . 53
7.3 Conclusions . . . 56
iii
8 Alignment with Curved Tracks, Method I 59
8.1 Momentum Measurement in the Middle Chamber . . . 59
8.2 Momentum Measurement from Angular Deection . . . 59
8.3 Inuence of the Calibration . . . 60
8.4 Track Reconstruction Accuracy . . . 60
8.5 Chamber Shift Reconstruction . . . 62
8.6 Conclusions . . . 63
9 Alignment with Curved Tracks, Method II 65 9.1 Alternative Alignment Method . . . 65
9.2 Rotation Determination . . . 66
9.3 Performance Tests with Monte-Carlo Data . . . 67
9.4 Conclusions . . . 69
IV Conclusions 71
10 Summary 73
V Appendix 75
A Momentum Calculation 77
B Determination of the Residuals Depending on the Chamber Rota-
tion 79
Part I
ATLAS and the LHC
1
Chapter 1
Introduction and Outline
After years of delay the Large Hadron Collider (LHC) at CERN
1will nally come into operation in 2009. This 27 km long machine will extend the frontiers of particle physics with its unprecedented high energy and luminosity. Inside the LHC, bunches of up to 10
11protons will collide at a rate of 40 million Hertz to provide proton- proton collisions at a centre-of-mass energy of 14 TeV with the design luminosity of 10
34cm
−2s
−1.
With this new collider, physicists hope to nd answers to some of the most fundamental questions in particle physics. In particular, they are interested to answer questions such as: Are there more than 3 space dimensions? or How did matter behave right after the Big Bang?. The search for the Higgs boson, the only particle predicted by the standard model of particle physics which has not been observed yet, also plays the most important role. An other very interesting eld is the search for new particles and physics beyond the standard model such as supersymmetric particles or rst hints for expectations from string theories like extra spatial dimensions.
Two general-purpose detectors, ATLAS and CMS, will study proton-proton colli- sions at the LHC. This thesis is performed in the context of the ATLAS experiment.
One very important part of this detector is its muon spectrometer which makes up for more than 80% of the whole detector volume. It is equipped with a huge su- perconducting air-core toroidal magnet providing an average magnetic eld of 0.4 T to allow for a precise muon momentum measurement with the spectrometer alone.
More than 1200 precision chambers are used to measure muon trajectories in the spectrometer with high eciency.
The high spatial resolution of the muon chambers allows for the measurement of transverse muon momenta with a resolution of ∆p
T/p
T< 10% up to energies of 1 TeV/c muons. This momentum resolution requires the knowledge of the relative positions of the muon chambers with 30 µ m accuracy. The required accuracy of the chamber position measurement is provided by an optical alignment monitoring system.
This thesis addresses two import aspects of the muon spectrometer. In the rst part, the focus is on the commissioning of the muon chambers with focus on noise reduction in the readout electronics. The second part studies the alignment of the muon spectrometer with muon tracks as a complement to the optical system.
1
CERN - Conseil Européen pour la Recherche Nucléaire
3
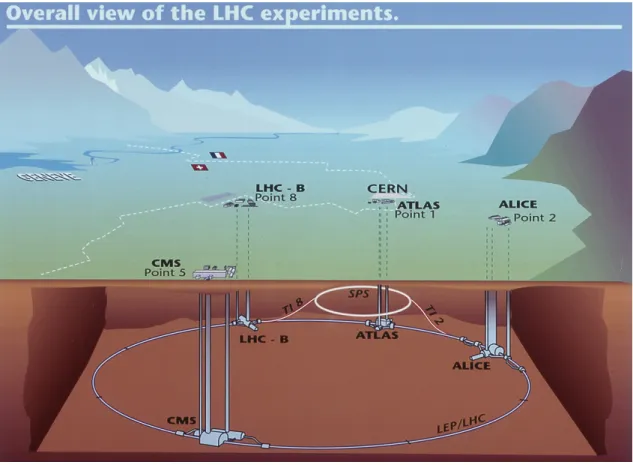
Figure 1.1: The Large Hadron Collider and its four large detectors: ALICE (A Large
Ion Collider Experiment), ATLAS (A Toroidal LHC ApparatuS), CMS (Compact
Muon Solenoid) and LHCb (Large Hadron Collider beauty experiment).
Chapter 2
The ATLAS Detector
There are four big detectors at the LHC: ALICE, ATLAS, CMS and LHCb. Two of them (ATLAS and CMS) are so-called multi purpose detectors and will exploit the whole rage of physics available at the LHC. The other two will focus on certain specic physics processes. ALICE will study the formation of a quark-gluon-plasma resulting from colliding lead nuclei, LHCb will focus on b-quark physics and related CP violation.
The ATLAS detector is 44 m long and 25 m in height. It has an overall weight of about 7,000 tones. The cavern of the LEP
1experiment that was situated at the same point was too small for the new detector and therefore a new cavern was build.
The assembly of the detector started in 2003 and is about to be nished end of 2008.
2.1 The ATLAS Coordinate System and Conven- tions
The ATLAS coordinate system is a right-handed system. The x axis is pointing to the center of the LHC ring, the y axis is pointing upwards and the z axis is parallel to the beam, pointing towards the LHCb experiment at point 8 of the LHC (see Fig.
1.1). The polar angle ϑ is measured from the positive z axis. The pseudo-rapidity η is dened as
η = − ln tan ϑ
2
. (2.1)
The traverse momentum p
Tof a particle is dened as the momentum component perpendicular to the LHC beam axis. ATLAS is divided into two parts: the barrel region (with |η| < 1.05 ) and the endcap region ( 1.05 < |η| < 2.7 ).
2.2 The Detector Components
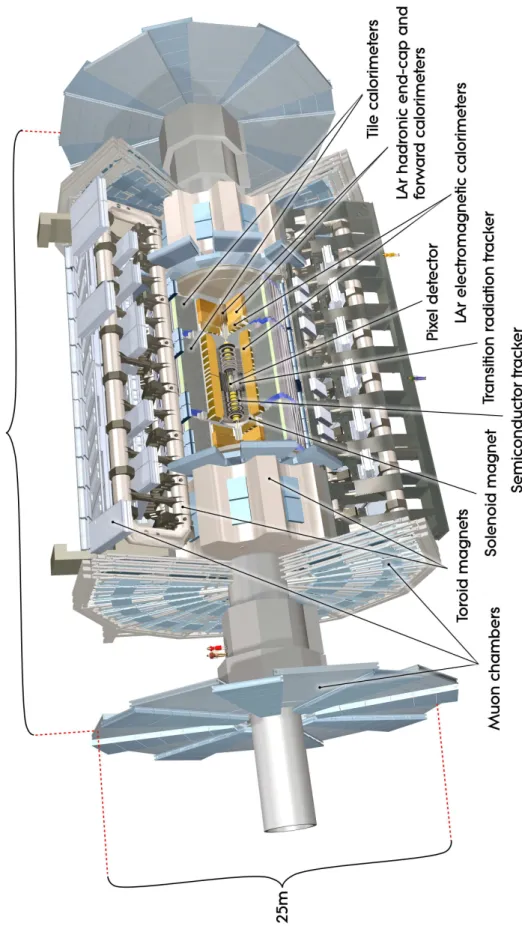
ATLAS, like all 4π collider detectors, consists of several layers of subdetectors. A cut-away view of the detector is shown in Figure 2.1. Following is a short descrip- tion of the dierent detector parts. Since this thesis is concerned with the muon spectrometer, this part is described in more detail.
1
LEP - Large Electron-Positron Collider
5
Figure 2.1: Cut-away view of the ATLAS detector. The dimensions of the detec-
tor are 25 m in height and 44 m in length. The overall weight of the detector is
approximately 7000 tones.
2.2. THE DETECTOR COMPONENTS 7
2.2.1 The Inner Detector
The Inner Detector (ID) starts at a radial distance of 4.6 centimetres from the proton beam axis, extends to a radius of 1.2 metres, and is seven metres in length along the beam. The ID can determine track coordinates with an accuracy better than 20 µ m in the r - φ plane perpendicular to the beam. With this high accuracy it is possible to associate the detected particles to a common vertex.
The ID is build inside a superconducting solenoid magnet. From the measured track curvature the momentum of the particles can be calculated. To fulll this task at the LHC, the detector has to cope with very high track densities and event rates.
At the nominal luminosity of 10
34m
−2s
−1, 28 proton-proton interactions every 25 ns are expected, each event consisting of up to about 2000 particles. This requires a very fast detector with high granularity.
The ID is a combination of three subsystems: two segmented silicon detector trackers (the Pixel Detector and the Semiconductor Tracker (SCT) ) and a gas tracking detector, the Transition Radiation Tracker (TRT).
The Pixel Detector is the innermost part of the ID. Its 80 million electronics channels are distributed over 1744 modules with about 47,000 pixels each. The resolution in the precision plane
2is as small as 10 µ m.
It is surrounded by the SCT. This detector covers a larger η area, namely |η| <
2.5 . The resolution in the precision plane is with 17 µ m almost as good as for the Pixel Detector, and it provides track points over a large volume. The modules are equipped with silicon strip detectors. Each strip has a width of 80 µ m and a length of 12.6 cm.
Subsequent is the TRT, a combination of straw-tube tracker and transition radi- ation detector. It consists of straw tubes (tiny drift tubes) and a transition medium inbetween and provides on average 36 spacepoints per track with a resolution of about 170 µ m. Electrons are identied by their characteristic transition radiation.
2.2.2 The Calorimeters
The calorimeters are starting right outside the solenoid magnet, at a distance of 1.5 meters from the beam axis. Their purpose is the determination of the total energy of a particle. This is done by stopping the particles and their decay products and measuring the deposited energy in the calorimeters. Since the interaction of hadrons, leptons and photons with matter is very dierent, there is one part dedicated to measure hadron energies and another part designated to determine the energy of electro magnetically interacting particles.
Except for muons, all particles are absorbed in the calorimeters.
The Liquid Argon Calorimeter
The Liquid Argon (LAr) Calorimeter is divided into several components: an electro- magnetic sampling calorimeter with 'accordion-shaped' lead absorbers in the barrel and in the endcaps, a hadronic calorimeter using at copper electrodes in the end- caps, and a forward calorimeter close to the beampipe in the endcaps made of copper and tungsten as absorber material. In addition, LAr presampling calorimeters in
2
The so-called precision plane is the r - φ plane, providing the measurement of the important
transverse momentum p
Tof a track.
front of the electromagnetic calorimeter help to correct for the energy loss in front of the calorimeter (mainly due to LAr cryostat walls and the barrel solenoid).
The Tile Calorimeter
The Tile Calorimeter is a large hadronic sampling calorimeter which uses steel as absorber material and scintillating plates read out by wavelength shifting bres as active medium. It covers the central region |η| < 1.7 . A special feature in its design is the orientation of the scintillating tiles which are placed in planes perpendicular to the colliding beams and are staggered in depth resulting in a good sampling homogeneity. The thickness of the calorimeter is equivalent to a total of about two hadronic interaction lengths. It has a cylindrical structure with an inner radius of 2.3 m and an outer radius of 4.2 m and is subdivided into a 5.6 m long central barrel and two 2.9 m long extended barrel parts. The total number of readout channels is about 10,000.
2.2.3 The Muon Detectors
The muon spectrometer forms the outermost layer of ATLAS. the fact that muons are the only long living particles that don't get stopped in the calorimeters, is used for particle identication. A toroidal magnetic eld of 1.5 T bends the muon tracks a second time after the ID and provides the possibility to independently determine the momentum of the particle.
ATLAS uses four dierent muon detector types: Monitored Drift Tube chambers (MDT), Resistive Plate Chambers (RPC), Thin Gap Chambers (TGC) and Cathode Strip Chambers (CSC). RPCs and TGCs are very fast responding chambers, but have only a poor spatial resolution. They are used to provide a muon trigger and the so-called second coordinate
3. RPCs are used in the barrel part, TGCs in the endcaps. The MDT and CSC chambers provide a very high spatial resolution in the track bending plane, but are relatively slow. The combination of all four detector types provides the desired resolution in space and time.
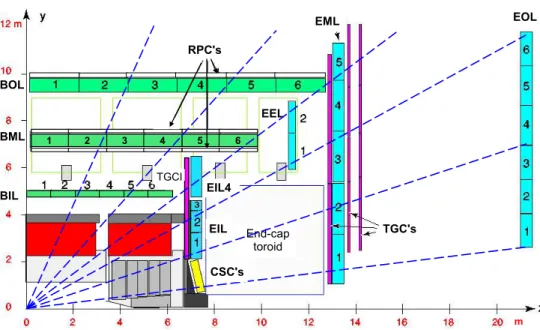
In the very forward direction, the rate of muons is very high and only the CSCs are fast enough to detect them with high eciency. A schematic view of the locations of the dierent chamber types is shown in Figure 3.1. The combination of a MDT and a RPC chambers in the barrel is called a muon station.
The muon spectrometer is discussed in detail in the following section.
2.3 The Magnetic Field Conguration
As discussed before, there are two independent superconducting magnets in ATLAS:
a central solenoid producing a eld of 2 T surrounding the inner detector and a toroidal magnet system with a maximum eld of 1.5 T in the muon spectrometer (see Fig. 2.2). The toroidal magnet system consists of a barrel part and two endcap magnets. The outer endcap parts of the muon spectrometer are outside the magnetic eld.
3
The direction perpendicular to the precision plane.
2.3. THE MAGNETIC FIELD CONFIGURATION 9
Figure 2.2: Geometry of the magnet coils and tile calorimeter steel. The eight race-
track shaped barrel toroid coils, with the end-cap coils interleaved, are visible. The
solenoid magnet lies inside the cylindrical calorimeter volume. The tile calorimeter
serves also as return yoke for the solenoid magnet.
Part II
The ATLAS Muon Spectrometer
11
Chapter 3
The Muon Spectrometer
After the quick overviews of all subsystems in ATLAS, the muon spectrometer shall now be discussed in detail. ATLAS puts much emphasis on a very precise muon reconstruction since there are many physics processes with muons in the nal state.
The muon spectrometer is also the largest part of ATLAS and herefore responsible for the huge dimensions of the detector (see Fig. 2.1).
3.1 The Layout of the Muon Spectrometer
The muon spectrometer consists of 3 layers of chambers in the barrel and in the endcaps as shown in Figure 3.1. There are also additional chambers (e.g. mounted on the endcap toroids) to close acceptance gaps.
The magnet system of the muon spectrometer contains no iron in order to mini- mize scattering of the muons. With a solid iron core it would have been possible to achieve a stronger magnetic eld, but at the cost of much higher deection of muon tracks due to multiple scattering.
Without contribution from the inner detector the aim for the momentum reso- lution of the muon spectrometer is
∆p
Tp
T< 3% for E
µ< 200 GeV and ∆p
Tp
T≈ 10% for E
µ≈ 1 TeV . (3.1) The muon momentum is determined from the sagitta of the muon track and the magnetic eld strength along the track. To achieve the desired momentum resolution the muon chambers have to provide a spatial resolution of about 40 µ m and the relative positions of the chambers have to be known with an accuracy of about 30 µ m in the bending plane.
The precision tracking detectors of the ATLAS muon spectrometer are mostly drift-tube detectors, the so-called Monitored Drift Tube (MDT) chambers. A small forward region of the spectrometer is covered by CSC chambers.
3.2 The MDT Chambers
The monitoring by optical sensors (discussed in detail in Chapter 3.2.2) serves for the measurement of torsions and expansions induced by the magnetic eld and
13
Figure 3.1: Schematic view of one quadrant of the muon system in the r - z plane (track bending plane). The dashed lines indicate tracks of muons with innite momentum. They typically traverse three muon stations allowing for a track sagitta measurement (see text). The dierent detector types in the muon system, MDT (in BIL, BML, BOL, EIL, EEL, EML and EOL layers), CSCs, RPCs and TGCs are indicated.
Figure 3.2: Cross-section of the barrel muon system perpendicular to the beam
axis (non-bending plane) showing three concentric cylindrical layers of eight large
and eight small chambers. The outer diameter is about 20 m. The global ATLAS
coordinate system is indicated.
3.2. THE MDT CHAMBERS 15
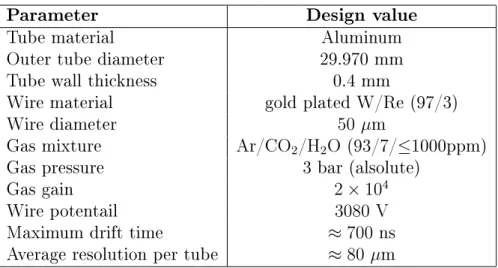
Parameter Design value
Tube material Aluminum
Outer tube diameter 29.970 mm
Tube wall thickness 0.4 mm
Wire material gold plated W/Re (97/3)
Wire diameter 50 µ m
Gas mixture Ar/CO
2/H
2O (93/7/ ≤ 1000ppm)
Gas pressure 3 bar (alsolute)
Gas gain 2 × 10
4Wire potentail 3080 V
Maximum drift time ≈ 700 ns
Average resolution per tube ≈ 80 µ m
Table 3.1: Parameters of the drift tubes in the ATLAS MDT chambers
µ
29.970 mm Anode wire Cathode tube
Rmin
(a) Cross-section of a
drift tube. (b) Longitudinal cut through a MDT tube.
Figure 3.3: A MDT tube in dierent views.
temperature changes, respectively. There are also optical measurements between the dierent chambers to measure their relative movements.
Each chamber consist of 2 multilayers of drift tubes, each with 3 tube layers and 4 tube layers for the inner chambers, respectively. Design parameters of the drift tubes are shown in Table 3.1. The mechanical structure of a MDT chamber is shown in Figure 3.4.
All MDT chambers inside ATLAS have a unique name e.g. BOS5A04 (cp. Fig. 3.1
and Fig. 3.2). The name describes the position of the chamber and the type. The
rst letter indicates wether the chamber is in the barrel (B) or belongs the endcaps
(E). The second letter stands for Inner, Middle or Outer and refers to the three
layers of chambers around the interaction point. The next letter indicates if the
chamber belongs to a Large or a Small sector. The coils of the toroid are in the
'small' sectors, leaving less space for the muon chambers. The rst number stands
for the η index of the chamber as shown in Figure 3.1. The last letter stands for
the both sides of ATLAS, the A side (positive z axis) and the C side (negative z
axis). The last number is the sector number. So our chamber is in the barrel, a
small outer chamber in sector 4. It is located on the A side and has an η index of 5.
x y z
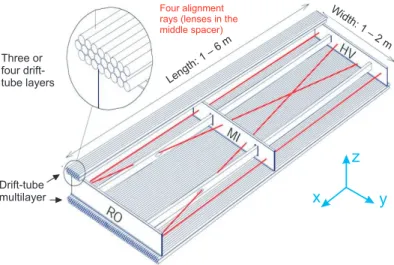
Figure 3.4: Mechanical structure of a MDT chamber. Three spacer bars connected by longitudinal beams form an aluminum space frame carrying two multilayers of three or four drift tube layers. Four optical alignment rays, two parallel and two diagonal, allow for monitoring of the internal geometry of the chamber. RO and HV designate the location of the readout electronics and high voltage supplies, respectively.
The local coordinate system of the chamber is given by the wires ( x axis), the y axis perpendicular to the tubes and parallel to the tube layers and the z axis perpendicular to the tube layers.
3.2.1 Principle of Drift Tubes and MDT Chambers
When a charged particle is passing through the tube, the gas molecules along the path get ionised. Due to the high potential dierence between the tube wall and the wire, the electrons drift to the anode wire in the centre of the tube, whereas the ions drift to the tube wall (cp. Fig. 3.3(a)). The drift velocity of the electrons depends on the local electric eld. Due to the cylindrical geometry the eld gets stronger closer to the wire. At a distance of about 150 µ m from the wire, the eld is strong enough that the energy gained by the electrons allows for the ionisation of the gas molecules. This leads to an avalanche of secondary electrons. Under normal ATLAS operating conditions, the gas amplication is about 2 · 10
4.
The readout electronics measures the time corrected for the muon ight time between the beam crossing signal and the charge pulse arriving on the wire plus an oset from the propagation of the signal along the wire. This gives the time the electrons needed to drift from the muon ionisation track to the wire . From the time measurement one can determine the minimal distance R
minbetween the muon track and the wire (see Fig. 3.3(a)). To determine the oset, the position infomation of the trigger chambers (RPC or TGC) in the second coordinate (local x ) along the wire is used.
The drift time t is linked to the drift radius r by the so called space-to-drift relationship r(t) or r - t relationship. This relationship depends on environmental parameters such as gas mixture and density, magnetic eld and high voltage. To obtain a precise r - t relationship, each chamber has to be calibrated at regular time intervals of about one day (cp. [6]).
With this r - t calibration a resolution of a single tube of about 80 µ m is achieved.
3.2. THE MDT CHAMBERS 17 It is limited mostly by uctuations of the ionisation clusters along the track and the diusion of the electrons. Also, ionisation clusters from background radiation, such as thermal neutrons, have a negative inuence on the resolution because of the induced uctuations of the space charge and therefore of the local electric eld in the tubes.
Combining the position measurements of the drift tubes in the 6 to 8 layers of a MDT chamber along the muon track, allows for a chamber position resolution of 40 µ m provided the anode wire positions in a chamber are known with an accuracy of 20 µ m. This high mechanical accuracy of the MDT chambers is assured by the precise assembly of the chambers and by continuous optical monitoring of their deformations during operation.
3.2.2 MDT Chamber Monitoring
Each MDT chamber has its own internal optical monitoring system to measure mechanical deformations. As indicated in Figure 3.4, there are 4 optical alignment rays built into the frame of a chamber: two along the tubes and two diagonal.
With this system, it is possible to monitor deformations with an accuracy of tens of micrometers [15]. This system was also used to adjust the tube sag to the wire sag of up to 500 µ m due to gravity in order to centre the wires in the tubes.
The importance of the chamber deformations for the track reconstruction within a chamber is studied in Section 6.2.4.
3.2.3 MDT Chamber Electronics
Each chamber is served by a high voltage (HV) power supply for the drift tubes, a low voltage (LV) power supply for the readout electronics, a connection to the central trigger and readout system and a connection to the Detector Control System (DCS).
High Voltage Supply
The high voltage for the drift tubes is distributed on the chamber via a HV splitter box to each of the tube layers. The two multilayers of the chambers are served by separate channels of the HV power supplies. Inside a multilayer, the tubes are connected serially via so-called HV hedgehog boards. Each board provides HV for a group of 24 tubes.
Readout of the Chambers
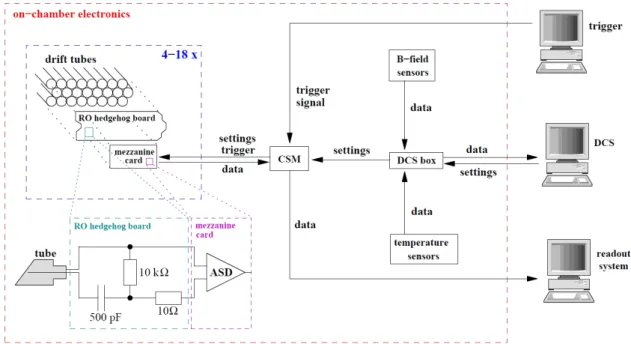
The central part of the MDT chamber readout electronics is the Chamber Service Module (CSM). It has connections to the mezzanine cards (see below), the timing, trigger and control (TTC) system, an optical link to the readout system and a serial connection to the DCS box on the chamber. A schematic view of all electronic components on a chamber is given in Figure 3.5.
The mezzanine cards are mounted on read-out (RO) hedgehog boards. These boards are similar to the HV hedgehog boards, but their purpose is to decouple the signal from the HV and relay it to the ASD chips
1on the mezzanine cards. Each
1
An ASD chip consists of 8 Amplier, Shaper and Discriminator chains.
Figure 3.5: The readout electronics scheme of a MDT chamber. The Chamber Service Module (CSM) controls all components.
ASD chip has eight channels and there a three chips per mezzanine card. When the signal exceeds a programmed threshold which can be set separately for each ASD chip the ASDs send digital signals to a TDC
2on the mezzanine card and analog signals to an ADC
3.
The time measurement in the TDC is started by the bunch crossing signal of the LHC and stopped when the signal from the ASD chips arrives. With a time-of-ight correction, the start signal corresponds to the moment when the muon crosses the tube. Consequently, the time measured by the TDC is the drift time of the electrons in the tube plus the signal propagation time along the wire.
The ADC is measuring the charge of the pulse arriving during a certain time window after the threshold of the ASD is crossed (typically 20 ns). The information can be used to distinguish between real muon and noise hits, since muons have a higher signal. It is also possible to correct for time variations of the threshold crossing depending on the signal size.
The information from the TDC and the ADC are transferred to the CSM. If the module receives a trigger signal from the central ATLAS trigger, the data is sent via an optical bre to the central DAQ
4.
The DCS box on the chamber is connected to the CAN
5bus of ATLAS. Over this bus the electronics of the chambers can be programmed (e.g. dierent thresholds, new rmware versions) and initialized. Also the temperature and B-eld sensors on the chambers are read out via this bus.
2
TDC - Time-to-Digital-Converter.
3
ADC - Analog-to-Digital-Converter.
4
DAQ - Data AQuisition.
5
CAN - Controller Area Network.
Chapter 4
Commissioning of the MDT Chambers in ATLAS
Once an MDT chamber is installed in the ATLAS detector, the access is very lim- ited and repair is dicult. Therefore all chambers were tested several timesat the production sites, after transport to CERN [4, 7] and before installationwith preliminary power supplies and gas and read-out systems to ensure that only fully functional chambers are installed in the experiment. These tests included measure- ments of the gas leak rate, HV stability and noise rates. The complete chambers, including front-end-electronics and components of the optical alignment system, were certied with cosmic rays.
As soon as the chambers are installed in the detector, they should be connected to the nal gas and power supplies and be included in the central trigger and readout chain. Unfortunately this was not always possible due to time limitations, interfer- ence from other installation tasks, and the limited availability of gas and electrical services. Chambers already installed in the detector and connected to the central services are continuously tested to discover new failures. The tests include taking cosmic and noise data with all available chambers and in combination with other subsystems of ATLAS [11].
The serial tests of the 88 MDT chambers built at MPI started in fall 2003 and continued until beginning of 2006 in Munich [8, 9]. The chambers were integrated with their trigger chambers and tested at CERN between November 2004 and April 2006 [16, 9]. They were installed in the experiment in 2005 and 2006 and subse- quently commissioned[14, 12, 9].
Cosmic Ray Data Taking
For the so-called milestone runs, ATLAS was running with all available subdetector systems and recording muon events originating from cosmic radiation which is the only other radiation source besides the LHC which can illuminate the whole detec- tor. The dierence to normal data taking is the trigger setting as the muons are not originating from the primary vertex as during beam collisions and are arriving randomly in time. The purpose of these runs is the commissioning and optimization of the detector components and the debugging of hard- and software problems.
19
killed_tubes Entries 575 Mean 2.715 RMS 1.915
nr. of tubes
0 1 2 3 4 5 6 7 8 9
nr. of chambers
20 40 60 80 100 120
killed_tubes Entries 575 Mean 2.715 RMS 1.915
(a) Number of tubes per chamber with noise rate 3· RMS above average (see text for de- tails).
killed_tubes_noise Entries 1943 Mean 1.276 RMS 4.281
noise rate [kHz]
10-1 1 10
nr. of tubes
0 5 10 15 20 25 30
killed_tubes_noise Entries 1943 Mean 1.276 RMS 4.281
(b) Noise rate distribution for tubes outside the 3· RMS window.
Figure 4.1: Frequency of drift tubes with high noise rates.
Noise Runs
The noise rate is determined with the same method as used in the pre-installation tests. A random trigger with a typical rate of 10 kHz was used. Accidental hits in the acceptance time window of the electronics can originate from discharges in the tubes, from pick-up on the cables and thermal noise in the electronics. To dierentiate between discharges and electronics noise runs with and without HV applied were taken.
4.1 The Noise Rate of the MDT Chambers
The noise rate f
noiseof a drift tube is determined by randomly triggering the MDT chamber readout electronics and dividing the fraction of hits per trigger by the active time window of the data acquisition:
f
noise= events
active time window · total number of triggers . (4.1) Equation (4.1) is only valid for 1/f
noisemuch less than the active time window. The active time window is the time interval in which the electronics is accepting a trigger signal. For the MDT chambers it is set to 2.5 µ s (3200 TDC counts a 25/32 ns).
The noise rate of a drift tube during normal ATLAS operation is depending on the threshold settings on the ASD chip. The highest acceptable rate is 40 kHz per tube chosen such that the noise rate is negligible compared to the real hit rate [7].
To calculate the average noise rate, one determines the average rate over all tubes in the chamber. Tubes with zero hits are dropped. To minimize the eect of single noisy tubes, the RMS of the noise rate distribution is calculated and all tubes with a rate more then three times the RMS above the average values are excluded from the calculation of the new average is calculated. The numbers of excluded tubes and the noise rate spectrum are given in Figure 4.1.
For a reliable noise rate determination very high statistic is needed:
N = 1
0.01
2= 10
4events for 1% accuracy.
4.1. THE NOISE RATE OF THE MDT CHAMBERS 21
x
noise hits
muon events
t
maxt
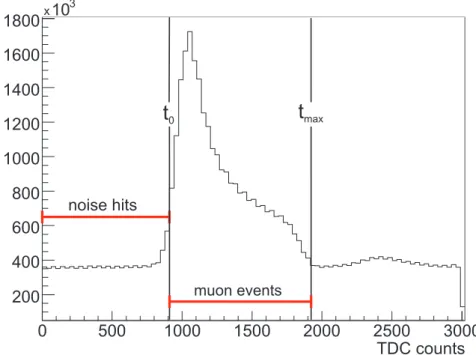
0Figure 4.2: Example TDC spectrum. The drift time spectrum is clearly visible between t
0= 900 and t
max= 1900 TDC counts (0.70 µ s to 1.5 µ s). Every hit before 850 TDC counts is considered noise. For this specic run the active time window was set to 3000 TDC counts.
The time measurement always shows an oset between the trigger time t = 0 and the arrival time of the signal. All events before the start of the drift time spectrum must be noise hits (cp. Fig. 4.2). The noise rate during cosmic data taking is given by:
f
noise, cosmic= events before t
0t
0· total number of triggers . (4.2) To achieve an accuracy of 1% in the noise rate measurement one needs 10
4events per tube, because not all are in the noise window. One needs about
10
4· active time window
t
0≈ 60 · 10
3events.
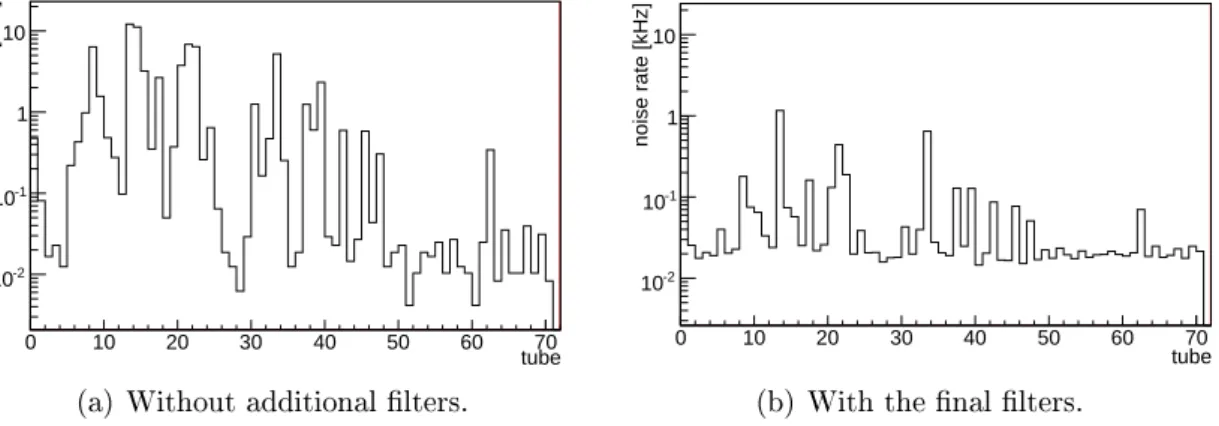
An overview of the measured noise rates for the barrel MDT chambers is given in Figure 4.3. The noise rate is not uniform for all chambers in the barrel. The highest noise rates are observed in azimuthal sectors 1 to 6. This is especially obvious for the inner layer. Also the noise rate of chambers on the A side are slightly higher than on side C. A possible explanation for this pattern is that most of the cables for the inner detector are routed through these sectors.
With very few exceptions the noise rates are below the maximum tolerable value
(e.g. BML1A15). The BML1A15 chamber has one layer with very high noise rate
which is most probably related to a broken HV cable between the splitter box and
the tube layer.
C8 C7 C6 C5 C4 C3 C2 C1 A1 A2 A3 A4 A5 A6 A7 A8
η
φ
1 2 3 4 5 6 7 8 9 10 11 12 13 14 15 16 17 18 19 20
10-4
10-3
10-2
(a) Noise of the inner layer chambers in kHz.
C8 C7 C6 C5 C4 C3 C2 C1 A1 A2 A3 A4 A5 A6 A7 A8
η
φ
1 2 3 4 5 6 7 8 9 10 11 12 13 14 15 16 17 18 19 20
10-2
10-1
1
(b) Noise of the middle layer chambers in kHz.
C8 C7 C6 C5 C4 C3 C2 C1 A1 A2 A3 A4 A5 A6 A7 A8
η
φ
1 2 3 4 5 6 7 8 9 10 11 12 13 14 15 16 17 18 19 20
10-2
10-1
1
(c) Noise of the outer layer chambers in kHz.
Figure 4.3: Average noise rates of the barrel MDT chambers identied by their code
names as function of η and φ (cp. Sec. 3.2). Note the dierent scales. Chambers
with less than 100 hits per layer are left blank. The BIR chambers in φ -sector 11
and 15 are moved to the (virtual) sectors 19 and 20, respectively, since the bins are
already occupied by the BIM.
4.1. THE NOISE RATE OF THE MDT CHAMBERS 23
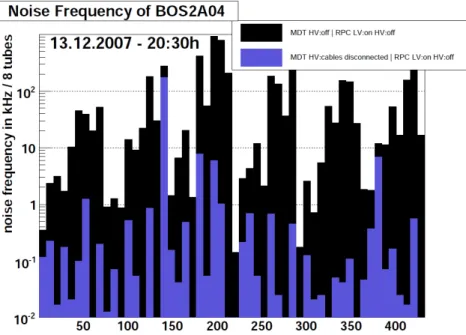
Figure 4.4: Noise rates of the 432 drift tubes of a BOS MDT chamber in ATLAS with (black) and without (blue) HV cables connected to the chamber.
4.1.1 Noise Rate of BOS chambers
During the noise runs in summer 2008, a signicantly higher noise rate compared to other chambers and to the tests before the chamber installation in the ATLAS detector was found on several of the BOS MDT chambers built at the MPI. The pattern is visible in Figure 4.3(c). All even φ -sectors (BOS MDT chambers) on side C have a higher average noise rate than the neighboring BOL chambers in the odd sectors. The eect is also visible on side A, but not to as pronounced.
Further investigation revealed that the noise is equally distributed over all mez- zanine cards on the chambers and therefore a problem in the electronic components is very unlikely. One explanation is pick-up on the HV cables. To verify this as- sumption, noise runs with dierent settings were taken: HV cables not connected, HV cables only connected to the chamber and not to the power supply, HV cables connected to the chamber and the power supply. Also the routing of the HV cables was changed. The tests revealed a clear pick-up on the HV cables with the noise rates dropping by a factor 10 to 100 when disconnecting the cables (cp. Fig. 4.4).
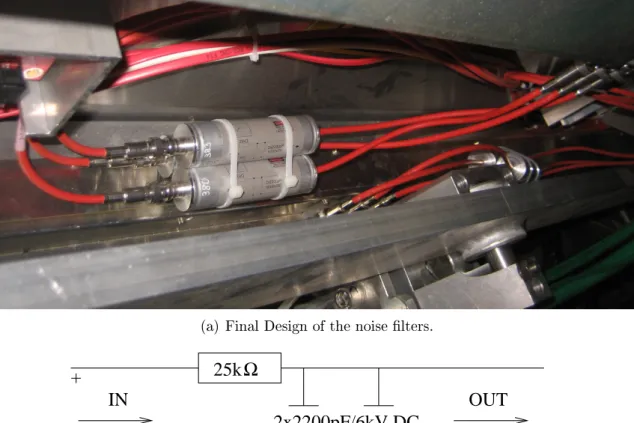
Closer investigation, including measurements of signals induced on the cables, revealed no explicit sources for the pick-up on the chamber, only a small inuence of the RPC electronics mounted on the muon stations was discovered. Since the source of the noise could not be located and eliminated, an alternative approach was followed: installing additional low-pass lters between the HV cables and the tube layers to dampen pick-up signals with high frequencies. Two possible locations for the lters were considered:
inside the splitter box (cp. Fig. 4.6(a)),
between the splitter box and the single layers (cp. Fig. 4.6(b), 4.7(a)).
After several tests, the best results were achieved by installing lters between the
original splitterbox and the tube layers as close as possible to the connectors leading
0 10 20 30 40 50 60 tube70
noise rate [kHz]
10-2
10-1
1 10
(a) Without additional lters.
0 10 20 30 40 50 60 tube70
noise rate [kHz]
10-2
10-1
1 10
(b) With the nal lters.
Figure 4.5: Eect of the noise lters: a signicant decrease of the noise rates is clearly visible.
into the Faraday cage of the readout electronics. Since the 15
thof August 2008 all 88 MDT chambers constructed in Munich are equipped with the nal noise lters and are now well below the 40 kHz noise limit per tube (see next section).
4.1.2 The Noise Filters
The splitter boxes installed on the MDT chambers already have a low-pass lter with a cut-o frequency of f
C≈ 160 kHz included. To further reduce the noise, lters with lower cut-o frequency are needed. f
Cis dened as the frequency above which the amplitude of a incoming signal is damped to less than half of the initial value. For a simple R - C lter it is given by
f
C= 1
2π · R
total· C
total. (4.3)
The cut-o frequency can be lowered by either increasing the resistance or the ca- pacitance of the R - C circuit. For the rst prototypes the original splitter box was modied. The capacitance was increased by a factor of 20 (from 500 pF to 10 nF) while the resistor in the shielding was removed to reduce potential dierences be- tween the ground and the chamber resulting in f
C,new≈ 16 kHz. This modication lead to a decrease of the noise rate by a factor of 10 to 100 (cp. Fig. 4.5).
Placing the lter before the original splitter boxes did not change the noise rate, leading to the conclusion that there is also pick-up on the HV distribution cables on the chambers. Therefore it is preferable to have a lter close to each tube layer minimizing the length of cable between lter and tubes.
First prototypes with a cut-o frequency of less then 100 Hz have been tested with very good results, resulting in the decision to install such lters on all chambers.
The nal design of the lters with a cuto frequency of f
C≈ 725 Hz is shown in
Figure 4.7.
4.1. THE NOISE RATE OF THE MDT CHAMBERS 25
(a) Included in a splitter box (b) Separately for each layer
Figure 4.6: First prototypes of the noise lters.
(a) Final Design of the noise lters.
25k Ω
25k Ω
2x2200pF/6kV DC
OUT IN
+
−
(b) Circuit diagram of the nal noise lters.
Figure 4.7: The nal design of the noise lters with a cut-o frequency of f
c=
732.4 Hz.
4.2 Commissioning of the MDT Chambers in AT- LAS
The cosmic and noise runs are also an opportunity to identify chambers with hard- or software problems. Errors can occur at dierent stages in the data taking process, in particular during
1. powering of the chambers with LV and HV controlled by the DCS
1,
2. initialisation of the on-chamber electronics (e.g. programming of the CSMs and mezzanine cards with the individual thresholds),
3. the actual data taking.
Problems occurring during the powering up are easy to locate: either the chamber is not yet connected to the power supplies (no current drawn) or there is a short circuit in the HV cable (e.g. badly isolated connectors) or on the chamber (e.g. a broken wire in a tube). A short circuit is obvious if the current reaches the limit of 10 µ A. During cosmic ray data taking, a chamber is expected to draw less than 1 µ A of current.
To check if the short circuit is on the chamber or on the HV cable, the chamber is disconnected from the HV cables and the power supply is ramped up. If the nominal voltage of 3080 V is reached without current ow, the problem has to be on the chamber itself. Now each tube layer is tested separately, then the individual tubes in the layer. A broken wire is disconnected from the HV distribution by removing the corresponding resistor on the hedgehog card.
If the on-chamber electronic fails to be initialised there are several possible rea- sons:
the chamber has no connection to the CAN bus (e.g. damaged CAN distribu- tion box),
a hardware problem occurred on the CSM or a mezzanine card,
the CSM has the wrong rmware version installed,
the CSM has no connection to the TTC bre (e.g. due to a broken or dirty bre).
The nature of the problem can be seen from the error messages in the DCS.
When starting a new run, it is possible that chambers stop sending data after some time. If this happens right at the beginning of the run, it indicates a problem with the readout bre. Chambers that stop sending data after some time of normal running, usually have lost their electronics initialisation and have to be reinitialized.
The recorded data can also reveal problems. From special runs with HV applied to only one multilayer it is possible to tell if the HV channels are correctly connected.
An overview of the problems solved during the MDT chamber commissioning in spring 2008 is given in Table 4.1.
1
DCS Detector Control System.
4.3. OVERVIEW OF THE COMMISSIONING STATUS 27
Problem #
readout bre problems 7 TTC bre problems 13 old rmware on the CSM 23
broken CSM 3
broken mezzanine card 5 no LV connection 32 no HV connection 42
trips of the LV 1
trips of the HV 5
wrong HV mapping 6
Table 4.1: Problems of installed ATLAS MDT chambers solved during the commis- sioning in spring 2008.
4.3 Overview of the Commissioning Status of the Muon Spectrometer
At the time of writing, all barrel chambers and almost all endcap chambers have been installed and connected to gas and electrical services. A very high percentage of the chambers is working as expected[10]:
1088 of 1150 MDT chambers are installed (the only exception are the except staged EE chambers in the endcaps).
99.8% of the installed MDT chambers are included in the readout, only 2 presently not accessable endcap chambers are not properly connected (cp.
Fig. 4.9(a)).
98.5% of the chambers in the readout are operational with HV.
98.3% of the 339640 readout channels (drift tubes) are working.
During the rst beam injections in the LHC on 10. September. 2008, ATLAS was able to record events from interactions of the proton beam with residual gas molecules in the vacuum beam pipe. An example of a beam halo event is shown in Figure 4.8.
The ATLAS muon spectrometer is now ready to take data. The remaining
problems are already located (see Fig. 4.9(b)) and are scheduled for repair during
the winter 2008/2009 shutdown of the accelerator.
Figure 4.8: First beam halo events reconstructed by ATLAS in September 2008.
The red lines indicate reconstructed muon tracks.
4.3. OVERVIEW OF THE COMMISSIONING STATUS 29
(a) MDT chambers included in the readout. Only two presently not accessable chambers in the endcap C (white) are not connected.
OK readout problem gas problem HV problem
(b) Open problems in the ATLAS MDT system. Chambers with gas problems are not connected to the central service because of leaks.
Figure 4.9: Status of the MDT chambers end of October 2008. Chambers are sorted
by their position along the beam pipe. Starting on the left with the endcap chambers
on side C, then the barrel chambers and nally the endcap A chambers. From top
to bottom are the dierent layers of the spectrometer: inner chambers at the top,
middle chambers in the middle, and outer chambers at the bottom.
Part III
The Alignment of the ATLAS Muon Spectrometer
31
Chapter 5
Alignment Concepts
5.1 Why Is Alignment of the MDT Chambers Needed?
The design goal for the ATLAS muon spectrometer is a momentum resolution of better than 10% for 1 TeV/c muon transverse momentum. This requires a precise alignment of the muon chambers; the momentum resolution degrades from 9% for perfectly aligned chambers to 11% for a relative positioning uncertainty of only 30 µ m which is the goal for the ATLAS muon spectrometer (cp. Fig. 5.1). It is also important to know the chamber positions with respect to the toroid coils and the magnetic eld because of the relatively high non-uniformity of the magnetic eld inside the muon spectrometer.
0 2 4 6 8 10 12
10 102 103
pT (GeV)
Contribution to resolution (%)
Wire resolution and autocalibration Chamber alignment
Multiple scattering Energy loss fluctuations Total
|η| < 1.5
Figure 5.1: Contributions to the fractional muon momentum resolution. The align- ment contribution assumes 30 µ m alignment accuracy in the track bending coor- dinate in the magnetic eld. The alignment becomes very important for highly energetic muons with p
T> 500 GeV.
A system of 12,000 optical alignment sensors is installed in the muon spectrom- eter to monitor relative chamber movements with 10 µ m accuracy[15]. The optical alignment system and its limitations are discussed in more detail in Section 5.4.
In order to determine the relative chamber positions in addition to chamber movements, the optical alignment monitoring system needs to be calibrated by mea- suring the initial positions of the chambers by means of straight muon tracks with magnetic eld switched o (see Chapter 7). Curved muon tracks will be used for
33
middle chamber (BM)
outer chamber (BO)
inner chamber (BI) sagitta s
y z l
s muon track
track point
Distance L
Figure 5.2: Illustration of the track sagitta measurement in the (barrel) muon spec- trometer (precision or bending plane in which the precision track point measure- ments are performed). The z - y coordinate system is parallel to the local chamber coordinate system. The auxiliary coordinate system for a muon track ( l - s ) is de- termined by the direction of the line connecting the track points in the BO and BI chambers and the direction of the track sagitta s perpendicular to l .
chambers no connected to the optical alignment system (small chamber sectors in the barrel, see Sec. 3.1) and to monitor the optical alignment. Curved tracks are recorded during the normal ATLAS operation when the magnets are switched on.
The alignment with curved tracks (see Chapter 8) requires independent knowledge of the momentum of the particle and is therefore more complicated compared to the alignment with straight tracks.
5.2 Momentum Determination with the Sagitta Method
To understand how misalignment of the chambers inuences the momentum mea- surement, one must have a closer look at the momentum reconstruction. Muon momenta are measured via the track sagitta which is dened as the maximum devi- ation of the curved track from the straight interconnection of the hits in the inner and outer chambers. As depicted in Figure 5.2, we use a coordinate system in which the l axis is parallel to the straight interconnection of the inner and outer chamber hits. The s axis is orthogonal to the l axis in the precision plane (cp. Fig. 5.2). S
iis the s coordinate of the i
thtrack point ( i = inner, middle, outer). The sagitta s is given by
s = 1
2 (S
inner− 2S
middle+ S
outer)
. (5.1)
For an auxiliary coordinate system with origin at the inner track point, S
innerand
S
outerare zero by denition. In the approximation of a uniform magnetic eld B ,
5.3. IMPACT OF MISALIGNMENT ON THE SAGITTA MEASUREMENT 35 the momentum is related to the sagitta s by:
p = 0.3 · B · L
28 · S for [B] = T, [L, S] = m, [p] = GeV/c . (5.2)
5.3 Impact of Misalignment on the Sagitta Mea- surement
The muon chambers are mounted in the muon spectrometer with 1 mm position and 1 mrad orientation accuracy. These limitations in the mounting precision have an inuence on the measured sagitta. The impact of misalignment in each coordinate dimension of the auxiliary coordinate system is the following:
x axis: Although not shown in Figure 5.2 the axis along the tubes is the third degree of freedom for chamber displacements. A displacement in this direction does not aect the sagitta such that misalignment in x direction can be neglected.
l axis: A displacement in l direction has also no impact on the sagitta. But the distance between the hits in the outer and inner chambers is important for the momentum calculation (cp. Eq. (5.2)). Since L enters quadratically in equation (5.2), the momentum uncertainty for position uncertainty ∆L in this axis is
∆p
p = 2 · ∆L
L . (5.3)
The minimum distance L in ATLAS is about 5 m (for a track close to η = 0 ).
From the installation accuracy ∆L is less than 2 cm resulting in a maximum momentum error contribution of 0.8%.
Thus displacements in l direction do not contribute signicantly to the error on the momentum and no high alignment accuracy in this direction is required.
s axis: Shifts along this axis obviously have a direct inuence on the sagitta. To achieve the aim of a misalignment uncertainty of only 30 µ m on the sagitta, the chamber alignment in this direction must fulll the same requirement.
5.3.1 Misalignment in the Local Chamber Coordinate Sys- tem
The auxiliary l - s coordinate system is dierent for each track. It is not useful to work with it when combining the results of severals events. The global ATLAS coordinate system is used for all calculations involving more than one chamber.
The alignment parameters, on the other hand, are given in the local chamber
reference system. The denition of the local chamber coordinate system is given in
Figure 5.3. The sagitta measurement is only inuenced by shifts and rotations in
the precision plane (see Fig. 5.2), a displacement along the tubes has only a small
eect via the determination of the magnetic eld along the track.
x
y z
b
a g
Figure 5.3: Denition of the local chamber coordinate system. The origin is on the wire of the rst tube in the innermost tube layer in the middle of the tube. The rotation angles α , β and γ are dened around the x , y and z axes, respectively.
y
z l
s D z
D y J D s
D y D z measured track
true track connection of inner and outer chamber hit points
Figure 5.4: Impact on the measured ∆s = S
0− s sagitta by shifts in y and z of the middle chamber (cp. Fig. 5.2).
Translations
Displacements ∆s are combinations of shifts in y and z of the middle chamber with respect to the inner and outer chambers on a muon tack (cp. Fig. 5.4). The contribution of each of the shifts depends on the local track angle ϑ dened in Figure 5.4:
∆s = ∆y cos ϑ + ∆z sin ϑ . (5.4)
Rotations
The relevant rotation is a displacement the precision plane, i.e. around the x axis.
It results mainly in an z shift of the measured track point. The additional shift in y is negligible for expected chamber rotations. For a rotation ∆α shifts of the track point depend on the track distance a from the rotation axis x (cp. Fig. 5.5).
∆y = c·sin ∆α
2 = 2a·sin
2∆α
2 ≈ 0 , ∆z = c·cos ∆α
2 = 2a·cos ∆α
2 ·sin ∆α
2 ≈ a·∆α .
(5.5)
5.4. THE ATLAS OPTICAL ALIGNMENT SYSTEM 37
a
a D z
D y
a c
Figure 5.5: Impact on the measured trackpoint from a chamber rotation around the x axis (cp. Fig. 5.2).
Figure 5.6: The Red alignment system of NIKHEF (RasNIK). The image sensor (RasCam) is a CMOS pixel sensor in the barrel and a CCD sensor in the endcaps.
An infrared lter is placed in front of the sensor to avoid stray light. A RasMux multiplexer is installed on each chamber reading out up to eight RasCam sensors.
A MasterMux can multiplex up to 16 RasMux, sending the data to a computer for processing.
Other rotations do not have a signicant impact on the sagitta.
5.4 The ATLAS Optical Alignment System
An optical alignment system is used to monitor the relative positions of the MDT chambers[5]. The optical alignment sensors work as follows: an infrared LED projects via a lens an encoded chess-board mask on an optical position sensor(cp.
Fig. 5.6 for details). Relative movements of the mask, the lens, and the camera translate into a movement of the recorded chess board image. The image analysis permits the measurement of these relative movements with an accuracy of about 1 µ m. The sensors are mounted on the MDT chambers, on the toroid magnet coils in the barrel and on special alignment reference bars in the endcaps. With the knowledge of the positions of the sensors an absolute alignment of the relative MDT chamber positions is possible.
An overview of the optical alignment system in the barrel is shown in Figure 5.7.
Figure 5.7: Layout of the optical alignment rays (red) for three adjacent barrel sec- tors (see Sec. 3.1). The Chamber-to-Chamber Connection sensors (CCC) measure the positions of chambers in a small sector relative to those in adjacent large sectors which are internally aligned with projective light rays.
5.4.1 The In-plane Alignment System
Optical in-plane alignment systems are integrated into the MDT chambers as has already been discussed in Section 3.2.2. Their purpose is to monitor chamber de- formations induced by thermal expansion, gravity etc. with an accuracy of better than 10 µ m.
5.4.2 The PrAxial Chamber-to-Chamber Alignment System
The praxial alignment system is monitoring the shifts and rotations between neigh- boring chambers in the same layer. The name derives from the two sensor types used: proximity and axial sensors. The set-up of the two sensors types is shown in Figure 5.8.
The combination of both systems is used to determine the relative positions and orientations of chambers within a layer with accuracies of about 10 µ m and 30 µ rad, respectively.
5.4.3 The Projective Alignment System
To assure precise alignment of the three chambers on a track one needs measure- ments linking the three layers of the spectrometer. This central part of the optical alignment system is called projective alignment system because the light rays are pointing in the direction of straight tracks originating from the interaction point.
For each large sector and each barrel hemisphere there are eight projective optical lines interconnecting the inner, middle and outer layer (cp. Fig. 5.7).
The small sectors do not have projective optical lines because of space reasons.
5.5. ALIGNMENT USING MUON TRACKS 39
Figure 5.8: The layout of the praxial alignment sensors on a layer of MDT chambers.
The sensors are mounted relative to a reference sense wire on each chamber with a precision of 20 µ m. The proximity sensors are indicated in green, the axial sensors in red.
The are aligned by means of the chamber-to-chamber connection sensors (CCC) and using muon tracks passing through overlap regions between small and optically aligned large chambers.
5.5 Alignment Using Muon Tracks
The barrel chambers mounted on the toroid coils, special chambers installed on the cryostat of the endcap toroid magnets in the transition region between the barrel and the endcaps are not monitored by projective optical sensors. There is also no optical connection between the barrel and the endcap chambers. All these chambers have to be aligned using muon tracks during the operation of the ATLAS detector. The momenta of the muon tracks are measured in the optically aligned chambers. The muon trajectories are then extrapolated to the chambers without optical projective alignment sensors and compared with the measurements of the same tracks there.
Alignment with Straight Tracks
Since the required positioning accuracy of the sensors on the chambers of 20 µ m could not be achieved for all chambers it is necessary to calibrate the optical system before it can reach its design accuracy. This process is already ongoing with cosmic muons and will be continued with rst collisions data during special runs with the toroidal magnetic eld turned o. An algorithm for the alignment with straight muon tracks is discussed in Chapter 7.
Alignment of the Small Chambers
In order to align the small chamber sectors it is necessary to relate their positions
to the optically monitored large sectors. Tracks passing through overlap regions
between large and a small chambers are used. If the large chambers are correctly
aligned the momentum of muons can be precisely determined. Requiring the same
momentum measured in the small and the large chambers determines the relative alignment corrections.
Alignment with Curved Tracks
To provide additional monitoring of the chamber alignment besides the optical sys-
tem during data taking an algorithm using curved tracks has been developed which
is the main part of this thesis. First studies of this method have been performed
by J. Schmaler in 2007[14]. Details and performance of the method are discused in
Chapter 8 concentrating on the barrel part of the muon spectrometer.
Chapter 6
Segment Reconstruction Within a MDT Chamber
The alignment of the muon spectrometer with muon tracks requires precise recon- struction of track segments in the muon chambers. The reconstruction for the segment reconstruction and its accuracy are discussed in this chapter.
6.1 Segment Reconstruction for Curved Tracks
For each track traversing a MDT chamber there is a certain number of hits in the drift tubes. For each hit we know the position of the wire with an accuracy of about 20 µ m and the drift time. The muon trajectory within a MDT chamber is well described by a parabola.
y(z) = a · z
2+ b · z + c . (6.1) First we perform a quality evaluation of the track. Hits with unphysical drift time are eliminated. The next step is to assure that there is at least one hit in each of the two multilayers. One needs at least three points to t a parabola. In practice there are usually three hits per multilayer. The drift time measurements do not provide single space points, but only the minimal distances (drift radii) of the track to the wires without information about the orientation of the tracks in each tube.
To nd the parameters of the parabola (6.1) we perform a t to the individual hits of a track using the MINUIT 2[1] algorithm implemented in ROOT[2]. Starting parameters are taken from a straight-line t to all hits in a chamber. This rst straight-line t selects hits belonging to a track, rejecting for example noise hits.
The t minimizes the χ
2function
χ
2= X
hits
(d
2hit− r
hit(t))
2σ
2(r
hit(t)) , (6.2)
where d
hitis the distance of the parabola from the anode wire, r
hitthe measured drift radius and σ(r
hit(t)) the error on the drift radius.
41
d
z
y
Figure 6.1: Reconstructed track segment in a MDT chamber with the denition of the deection is δ . Tubes with hits are indicated in red.
6.1.1 Momentum Reconstruction with Curved Track Segments
For low muon momenta ( p
T. 10 GeV / c) the high spatial resolution of the MDT chambers is sucient to resolve the curvature of the muon track over the short distance within a chamber. The curvature of the muon track is a measure of the muon momentum. The deection angle δ which is dened as the angle between the muon ight direction at the entrance of the chamber and the ight direction at the exit (see Fig 6.1) can be used to determine the muon momentum analytically based on the relation
∆~ p = q · Z
P
d ~l × B ~ ∆~ p = ~ p
outgoing− ~ p
incoming. (6.3) To calculate the bendingpower R
P
d ~ s × B ~ along the path the parabola is segmented into 1 mm steps. Since the parabola is dened in the y - z plane, we have to add additional information about the x coordinate along the path. The magnetic eld is in rst approximation parallel to the x -axis, such that a deection in x -direction is negligible. The path in the x -direction is therefore approximated by a straight line dened by the x positions of the rst and last hit in the chamber. Since MDT chambers do not measure the x coordinates, data from the RPC chambers are used. For the middle chamber stations which have two RPCs the track can be reconstructed in the x - z -plane. The outer chambers are only equipped with one RPC. Here we use the x -coordinate from the RPC measurement for all MDT hits assuming only small movement of the muon in x direction within the station. The inner stations are not equipped with RPC chambers at all. One has to extrapolate the muon trajectory in the x - z plane from the middle to the inner station to get the x coordinates of the hits in the inner layer, however with lower accuracy.
The position of the hit closest to the interaction point is dened as the entrance point of the chamber and is used as starting point of the integral in Equation (6.3).
The slope of the parabola and the assumed path in x determine the direction to the next point on the track using a Runge-Kutta algorithm of second order.
With the deection angle calculated from the slopes of the t parabola at the rst and the last hit position, the absolute value of the momentum p can be calculated.
Assuming a constant magnetic eld B and constant momentum p the deection angle δ is linked to ∆p :
∆p = δ · p = q · Z
P
B d l ⇒ p = q δ ·
Z
P
B d l . (6.4)
A detailed description of the formulae used is given in Appendix A.
6.2. TESTS OF THE SEGMENT RECONSTRUCTION ALGORITHM 43 Set number p
T[GeV/c] Events [ 10
3]
MC1 6 389
MC2 10 246
MC3 20 234
MC4 mixture 432
Table 6.1: Monte-Carlo datasets used for testing of the track segment reconstruction algorithm. They only contain the information from the muon spectrometer, no hits in the calorimeter or ID are stored. After the propagation through the calorimeters the muons loose about 3 GeV/c of momentum. The direction of the muons at the interaction point was limited to the chamber tower closest to η = 0 to ensure high statistics of tracks per chamber.
Energy [GeV]
6 8 10 12 14 16 18 20
Bias [%]
-0.25 -0.20 -0.15 -0.10 -0.05 -0.00 0.05
(a) ∆p/p
Energy [GeV]
6 8 10 12 14 16 18 20
[%]σ
3.6 3.65 3.7 3.75 3.8 3.85 3.9 3.95