System Test of the
ATLAS Muon Spectrometer in the H8 Beam at the CERN SPS
C. Adorisio,g G. Aielli, T. Alexopoulos,t P. Amaral,c C. Amelung,c G. Avolio,g R. Avramidou,o P. Bagnaia,k M. Barisonzi,q M. Barone,d F. Bauer,x I. Benhammou,ac J. Bensinger,b M. Beretta,d S. Bessler,ab G. Bobbink,q A. Borisov,w H. Boterenbrood,q I. Boyko,e S. Braccini,d P. Branchini,m V. Canale,i M. Caprio,i R. Cardarelli, G. Cataldi,h F. Cerutti,c,d J. Chapman,o G. Chelkov,e G. Chiodini,h G. Ciapetti,k
M. Cirilli,k D. Dedovich,e M. Della Pietra,i D. Della Volpe,i R. De Asmundis,i A. Di Ciaccio, A. Di Domenico,k A. Di Simone, J. Dubbert,n E. Etzion,ac R. Fakhrutdinov,w S. Falciano,k R. Ferrari,j
A. Formica,x C. Fukunaga,ad G. Gaudio,j E. Gazis,t P. F. Giraud,x E. Gorini,h F. Grancagnolo,h J. Gregory,o H. Groenstege,q C. Guyot,x R. Hart,q K. Hashemi,b S. Hassani,x S. Horvat,p R. Ichimiya,s P. Iengo,i M. Ikeno,r P. Ioannou,u M. Iodice,m M. Ishino,f Y. Kataoka,f A. Konig,q
O. Kortner,p C. Kourkoumelis,u A. Kozhin,w H. Kroha,p
Z. Krumshteyn,e H. Kurashige,s E. Lancon,x A. Lanza,j J. F. Laporte,x D. Lellouch,ae D. Levin,o L. Levinson,ae F. Linde,q C. Luci,k N. Lupu,ab
G. Maccarrone,d T. Maeno,c K. Mair,c S. Maltezos,t A. Manz,p E. Meoni,g G. Mikenberg,ae P. Mockett,y S. Mohrdieck-Moeck,p K. Nagano,r K. Nikolaev,e R. Nikolaidou,x A. Nisati,k H. Nomoto,f D. Orestano,m S. Palestini,c E. Pasqualucci,k,∗ F. Pastore,k R. Perrino,h
F. Petrucci,m G. Polesello,j A. Policicchio,g D. Pomarede,x P. Ponsot,x L. Pontecorvo,k M. Primavera,h F. Rauscher,n D. Rebuzzi,j R. Richter,p
S. Rosati,c J. Rothberg,y H. Sakamoto,f R. Santonico, O. Sasaki,r A. Schricker,c G. Schuler,c P. Schune,x S. Spagnolo,h R. Spiwoks,c A. Staude,n G. Stavropoulos,a Y. Sugaya,v S. Tanaka,r S. Tarem,ab
R. Thun,o I. Trigger,c G. Tsipolitis,t C. Valderanis,t P. Valente,k W. Vandelli,j R. Vari,k S. Veneziano,k J. Vermeulen,q T. Wengler,c
P. Werneke,q T. Wijnen,q M. Wolter,z,aa M. Woudstra,q Y. Yasu,r
P. F. Zema,g Z. Zhao,o A. Zhemchugov,e B. Zhou,o N. van Eldik,q H. van der Graafq
aLawrence Berkeley National Laboratory, 1 Cyclotron Road, Berkeley, CA 94720, USA
bBrandeis University, Mailstop 057, 415 South Street, Waltham, MA 02454, USA
cCERN, CH-1211 Gen`eve 23, Switzerland
dINFN Laboratori Nazionali di Frascati, via Fermi, 40, I-00044, Frascati, Italy
eJoint Inst. for Nuclear Research (JINR), 141980, Dubna, Moscow Region, Russia
fICEPP, University of Tokyo, 7-3-1 Hongo, Bunkyo-ku, Tokyo 113-8654, Japan
gUniversit`a della Calabria and INFN, Cosenza, p. Bucci, I-87036 Arcavacata di Rende (Cosenza), Italy
hUniversit`a del Salento and INFN, Lecce, via Arnesano, 73100 Lecce, Italy
iUniversit`a di Napoli ”Federico II” and INFN, Napoli, via Cintia, I-80126, Napoli, Italy
jUniversit`a di Pavia and INFN, Pavia, via Bassi, 6, I-27100, Pavia, Italy
kUniversit`a di Roma La Sapienza and INFN, Roma, p.le Moro 2, I-00185, Roma, Italy
Universit`a di Roma Tor Vergata and INFN, Roma 2, v. Ricerca Scientifica 1, I-00133, Roma, Italy
mUniversit`a di Roma Tre and INFN, Roma Tre, via della Vasca Navale, 84, I-00146, Roma, Italy
nLudwig-Maximilians-Universit¨at M¨unchen, Geschwister-Scholl-Platz 1, 80539 M¨unich, Germany
oMichigan University, Ann Arbor, MI 48109, USA
pMax-Planck-Institut f¨ur Physik, Fhringer Ring 6, 80805 Mnchen, Germany
qNIKHEF, Kruislaan 409, PO Box 41882, 1098 SJ Amstedam, The Netherlands
rHigh Energy Accelerator Res. Organ. (KEK), 1-1 Oho, Tsukuba, Ibaraki 305-0801 Japan
sKobe University, 1-1 Rokkodai-cho, Nada-ku, Kobe 657-8501 Japan
tNational Technical University Athens, Zografou Campus, GR-157, 80 Zografou, Greece
uUniversity of Athens, 15701 Ilissia, Greece
vResearch Center for Nuclear Physics, Osaka University, Osaka, Japan
wInstitute for High Energy Physics (IHEP), Pobeda str. 1, 142281, Protvino, Moscow Region, Russia
xDapnia, CEA - Saclay, F-91191 Gif sur Yvette Cedex, France
yUniversity of Washington, 3910 15th Ave. NE, Seattle, WA 98195-1560, USA
zTufts University, Medford, MA 02155, USA
aaH. Niewodnicza´nski Institute of Nuclear Physics, Radzikowskiego 152, 31-342 Krak´ow, Poland
abTechnion - Israel Institute of Technology, Haifa 32000, Israel
acTel Aviv University, P.O. Box 39040, Tel Aviv 69978, Israel
adTokyo Metropolitan University, 1-1 Minami-Osawa, Hachioji-shi Tokyo, 192-0397 Japan
aeWeizmann Institute of Science, P.O. Box 26, Rehovot 76100, Israel
Abstract
We describe a system-test of the ATLAS Muon Spectrometer performed at the H8 beam line of the CERN SPS during 2003. The setup includes one barrel tower made of six Monitored Drift Tube chambers equipped with an alignment system and four Resistive Plate Chambers, and one end-cap octant consisting of six end-cap MDT equipped with an alignment system and one triplet and two doublets of Thin Gap Chambers. Many system aspects of the muon spectrometer have been studied with this setup, from the performance of the precision and trigger chambers to the capability to align the precision chambers at the level of a few tens of micrometers and to operate the muon trigger at the crossing frequency of the LHC.
Key words: ATLAS Muon Spectrometer, test beam, SPS, CERN PACS:29.40.Gx, 29.40.Cs, 29.30.Ep
1. Introduction
The ATLAS muon spectrometer has been designed for the stand-alone measurement of muons produced in high-energy proton-proton collisions at the CERN LHC with a resolution better than 10% for transverse momenta up to 1 TeV, and to trigger on single muons with transverse momenta down to a few GeV. A detailed description of the spectrometer and of its expected performance can be found in reference [1,2].
Since the year 2000, a large-scale system-test of the ATLAS muon spectrometer has been set up and operated in the North Area of the CERN Super-Proton-Synchrotron (SPS), at the H8 beam line. The test setup emulates one full-size projective tower of the barrel and of the end-cap spectrometer and has evolved with time, integrating more muon detectors and control devices. The main goal of the system-test was to study the integration of all the components of the ATLAS Muon Spectrometer and to evaluate the performance of the system in a configuration as close as possible to the final setup in the ATLAS experiment.
In this paper, after a general introduction to the H8 setup, performance studies of the MDT chambers are given in Section 2. The barrel and end-cap alignment systems are discussed in Sections 3 and 4. RPC performance studies are reported in Section 5, TGC and the Level-1 trigger studies are detailed in Sections 6 and 7.
1.1. Setup overview
In the ATLAS experiment, the muon momentum is determined by measuring the track curvature in a toroidal magnetic field provided by three superconducting air-core toroid magnets, one in the barrel and one in each end-cap of the spectrometer, with a field integral in the range 2–8 Tm. The track curvature is measured with three layers of precision tracking chambers positioned along the muon trajectory. Most of the precision chambers in the muon detector are built from high-pressure drift tubes, referred to as Monitored Drift Tubes (MDT) [3]. In the end-cap inner region, for pseudorapidities greater than 2, Cathode Strip Chambers (CSC) [1,4] are used since they are able to cope with higher background rates, at the expense of an increased electronics channel density. The expected background rates range from 10 to 100 Hz/cm2in the MDT region, increasing up to 1 kHz/cm2 in the CSC region. These values have been computed by simulating high luminosity LHC running conditions and are affected by large systematic uncertainties.
Trigger chambers are based on two different technologies: Resistive Plate Chambers (RPC) [5] cover the barrel region while Thin Gap Chambers (TGC) [6] are used in the higher background environment of the end-cap region. Two RPC doublets (two gas gaps) attached to the middle barrel chambers provide the low-pTtrigger information. The information from a RPC doublet installed on the outer barrel chambers is combined with the signal from the middle chambers to produce the high-pT trigger. RPC chambers are also used to provide the coordinate along the MDT tubes (”second coordinate”), which is not measured by the MDT chambers. Similarly in the end-cap, two TGC doublets and
Dedicated to our friend Marc Virchaux who initiated most of this work.
∗ Corresponding author, e-mail:enrico.pasqualucci@roma1.infn.it
one triplet (three gas gaps) are installed close to the middle station and provide the low- and high-pT trigger signals. The TGC also measure the coordinate of the muons in the direction of the MDT wires. For this purpose, additional TGC chambers are installed close to the inner MDTs to improve the measurement accuracy of this coordinate.
This section describes the setup during the 2003 period of data taking; a schematic overview is shown in Figure 1. The test concerned different detectors (MDT, RPC, TGC), auxiliary subsystems such as alignment or detector control systems, and key soft- ware tools (data acquisition, calibration, track reconstruction, alignment software and database).
10x10 HODO
BIL BML
BOL RPC2
RPC1 RPC3
MBPL
EIL
EML
EOL TGC1 TGC2TGC3
15 o Z
X Y
BIL BML
0 10 20 30 m
x
z
Fig. 1. Plan of the H8 test beam lay-out in 2003. From left to right: the 10x10 trigger, the bending magnet, the hodoscope trigger, the barrel BIL, BML, BOL stations equipped with the trigger RPC, the end-cap EIL, EML and EOL MDT chambers and the trigger TGC chambers. The coordinates in capital letters are used by the alignment system; the ones in small letters are used by the offline reconstruction software.
A muon beam with momenta ranging from 20 GeV/c to 350 GeV/c was available in this area during SPS running periods. Most of the data during summer 2003 were taken with a narrow-band beam of 180 GeV central energy. At this energy, the beam profile is characterized by an intense core with an r.m.s. radius of about 3 cm and an extended beam halo with a r.m.s. radius of about 1 m. Beam triggers were made with two sets of scintillation counters: a coincidence of two 10×10 cm2 scintillators, hereafter referred to as 10×10 trigger, to trigger on the beam core, and a coincidence of two hodoscope planes of 100×60 cm2 size in anti-coincidence with the 10×10 trigger, hereafter referred to as hodoscope trigger, to trigger on the beam halo. The time resolution of the 10×10 trigger was better than 1 ns while the hodoscope trigger had a time resolution better than 2 ns. For some periods of the 2003 run, signals provided by the TGC and RPC trigger chambers were also used for triggering.
A SPS dipole magnet1 has been used in some runs to enhance the beam dispersion for low momentum muons, in order to emulate the angular spread of particles from the virtual interaction point in ATLAS.
The H8 muon setup can be divided in two parts: a barrel stand consisting of six MDT chambers, reproducing the geometry of an ATLAS barrel tower (two inner large, BIL,
1 MBLP magnet with a maximum field integral of about 4 Tm, corresponding to a momentum kick of about 1.2 GeV
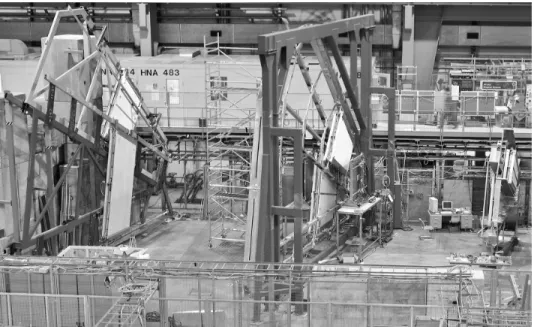
two middle large, BML, and two outer large, BOL, chambers) and six end-cap MDT chambers reproducing the geometry of one end-cap octant (inner large-1, EIL, and inner small-1, EIS, middle large-2, EML, and middle small-2, EMS, outer large-3, EOL, and outer small-3, EOS). In the ATLAS nomenclature Inner, Middle and Outer refer to the position with respect to the interaction point. In the barrel stand the Middle and Outer stations were also equipped with RPC chambers. In the end-cap stand, one TGC triplet and two TGC doublets were installed close to the middle station. All the stations were tilted by 15◦ with respect to the plane perpendicular to the beam axis. Pictures of the H8 muon setup are shown in Figure 2 and 3.
Fig. 2. Picture of the end-cap test stand with six MDT chambers and two TGC stations, taken in July 2003. From right to left: EOL, EML and EIL MDT chambers; the TGC doublets are close to the middle MDT station.
Both the barrel and end-cap stands were equipped with their optical alignment systems.
The principle of the alignment system [7] is to have the three stations of a trigger tower connected by optical lines emulating the trajectory of infinite momentum muons produced at the ATLAS interaction point (Figure 4). For the end-cap chambers, this principle is implemented using so-called alignment bars since in the ATLAS spectrometer the cryostat of the end-cap magnet prevents direct light paths.
1.2. The data acquisition system
The Data Acquisition system (DAQ) used during the beam test was based on the ATLAS DAQ architecture [8]. The computing and network infrastructures were built as a prototype of the ATLAS infrastructure. This allowed for using the muon setup as basis for a “combined run” carried out in september 2003, when the ATLAS Pixel, Silicon Central Tracker, and Tile Calorimeter detectors were read out simultaneously with the muon detectors. The network was laid out as two separate private networks: a Fast
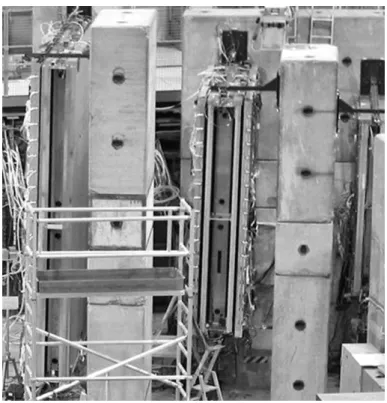
Fig. 3. Picture of the barrel tower consisting of two Inner, two Middle and two Outer MDT. The RPC attached to the Middle (center) and Outer (left) barrel MDT are also visible.
Fig. 4. Working principle of the ATLAS muon alignment system.
Ethernet system for control messages and a Gigabit Ethernet network for data transfer.
All network services have been set up in the private control network; the access to the CERN network was made possible via a dedicated gateway with a firewall. A dedicated server was set up to:
– allow for network booting of all the diskless Single Board Computers (SBC), hosted
in VME crates and dedicated to configuration and read-out of data from all the read out boards in the system;
– act as central repository for releases of the Data Acquisition software used during the beam test;
– provide a common installation of all necessary analysis tools and utilities.
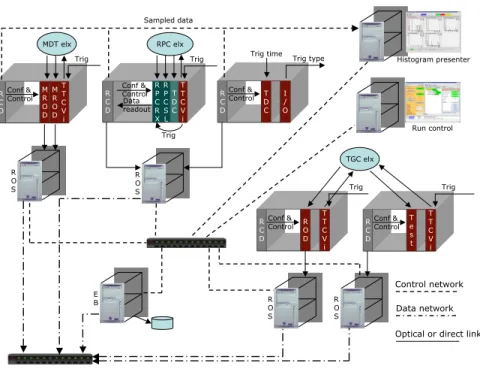
The three detector technologies could be read out concurrently, together with the Muon Central Trigger Processor Interface (MuCTPI) (described in Section 7). A diagram of the DAQ system is shown Figure 5.
Data network Optical or direct link Control network R
CD RP CR X RP CS L T DC TT CV i Conf &
Control Data readout
Trig RC
D M RO D M RO D T TC Vi Conf &
Control
Trig MDT elx
Trig RPC elx
R CD
R OD
TT CV i Conf &
Control
Trig TGC elx
R CD
T es t
TT CV i Conf &
Control
Trig R
OS
R OS
RO S R CD
T DC
I O/ Conf &
Control
Trig type Trig time
RO S Sampled data
EB
Histogram presenter
Run control
Fig. 5. Schematic view of the data acquisition system as implemented at the 2003 H8 beam test.
On each MDT chamber, data were read out by on-detector TDCs and ADCs, triggered by a signal received via the TTC (Trigger Timing and Control) [9] optical system, and collected by a Chamber Service Module (CSM) [10] prototype. An optical link connected each CSM to an MDT Read Out Driver (MROD) [11], housed in a 9U VME64X crate, together with a Single Board Computer (SBC)2 that acted as crate controller. Each MROD can receive data from up to 6 CSMs. Two MRODs were used, for the end-cap and the barrel setup, respectively. Both MRODs sent data asynchronously via a S-link [12] to a single PC. This PC emulated the functionalities of a Read Out System (ROS), which in the final system implements the interface between the detectors’ Read Out Drivers, the second level trigger farm and the event building system. At the 2003 test beam, ROSes
2 Type VP110, Concurrent Technologies, Essex, UK.
were used to collect data from each detector crate and to build event fragments ready for final event building.
The RPC read-out was based on two VME modules: a data receiver module (RPC- RX) and a sector logic module (RPC-SL), collecting information from on-detector trigger electronics. Several TDCs housed in the same VME crate were used to provide an al- ternative read-out of RPC strips. Data were acquired by the SBC via the VME bus. In order to comply with the ATLAS standard data format, the RPC Read Out Driver was emulated by the SBC. Emulated fragments were sent to the ROS via an optical link.
TGC chambers were read out with a Read Out Driver prototype; a test ROD was also used for trigger commissioning. Both were connected to their respective ROS with optical links. For debugging purposes, they were read out in parallel and data were successfully cross-checked. The ROD prototype processed data from the front-end electronics; raw data were also copied via VME to a local buffer on the crate controller and a monitoring process checked consistency between raw data and processed events. Data collected dur- ing the spill (∼5 sec) could be processed during the inter-spill time (∼20 sec). A few thousand events were typically collected during a spill.
An additional VME crate (”beam crate”) contained an I/O register3 a TDC and a SBC4. The I/O register was used to select the trigger source. During the last period of the test, when the SPS beam was bunched to simulate the LHC beam crossing period, the TDC was used to measure the phase between the beam and the trigger signal and the SBC acquired its data, acting as ROD emulator and sending data to the RPC ROS.
All the data fragments built in the Read Out Systems were sent via Gigabit ethernet links to a PC for final event building and data output to the staging disk. Data files were then transferred to the remote CERN data recording facility for permanent storage.
1.2.1. The online data monitoring
A monitoring service based on the ATLAS DAQ monitoring facilities was developed for MDT and RPC chambers. It was based on the Online Monitoring Service provided by the online software, allowing to interface an event provider (event sampler) with an event user (monitoring program) regardless of the actual implementation of the sampler.
As a consequence, data sampling was possible at any level of the acquisition chain (ROD, ROS or event builder). A file sampler was also implemented, allowing to sample events from saved data files for code development or ”a posteriori” checks.
The monitoring programs were organized as a Finite State Machine (FSM) in order to match DAQ states. State transitions could be controlled either by the user or by the DAQ itself, via a controller to interface the monitoring system to the ATLAS online communication system. The Inter Process Communication (IPC) between the monitor- ing controller and the monitoring applications was based on a package developed for the KLOE experiment [13]. The core software handling the Finite State Machine and the interface with the online services was detector independent; data decoding and his- togramming were implemented as user plug-in libraries. Histograms were produced using the ROOT [14] package and made available online through the ATLAS Online Histogram- ming Service (OH). They could also be displayed via a graphical browser.
3 Model V262, CAEN, Viareggio, Italy.
4 Model RIO 8062, CES, Geneva, Switzerland.
1.3. Alignment sensors
Two different types of optical alignment systems are used in the ATLAS muon spec- trometer: RASNIK [24] and BCAM/SaCam [25,26]. Both systems consist of a CCD looking through a lens at a target, the main difference being the type of target. Each system provides a CCD image, which is analyzed on-line and converted into geometrical parameters. In addition, temperature sensors are used to monitor the thermal expansion of the MDT chambers and, in the end-cap, of the alignment bars.
1.3.1. RASNIK
A RASNIK (Red Alignment System of NIKHEF) sensor consists of a CCD, a lens, and a back-illuminated chessboard-like pattern on a glass slide, called mask. These three optical elements can be either placed separately in the detector, or the CCD and the lens can be integrated in a stiff tube to build a camera. The former setup can be used as a three-point straightness monitor, while the latter is a directional point-line monitor or proximity sensor. The response of the RASNIK system is given by the positions of the three elements relative to the optical axis (through CCD and lens). The four parameters provided by a RASNIK are: the translation in the two coordinates orthogonal to the optical axis, the rotation angle between the mask and the CCD around the optical axis, and the magnification at which the mask image appears on the CCD.
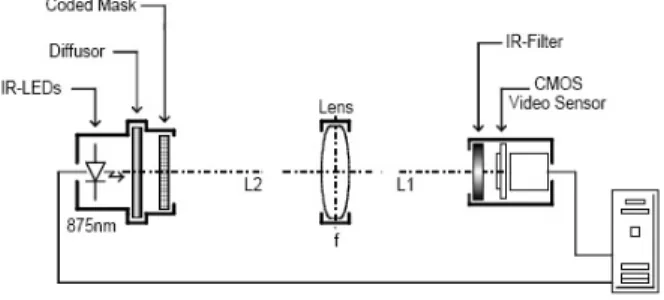
Fig. 6. Components of the basic RASNIK system.
In the barrel alignment system, RASNIK CCDs are monochrome CMOS sensors5. These devices contain 384×287 pixels with a size of 12µm. The sensitivity peak lies at 820 nm wavelength. The CMOS is embedded in a custom-made electronic board, which converts the CMOS signal into a semi-differential CCIR composite video signal sent to the outside via a RJ-45 cable. The readout frequency is 7.37 MHz. The whole electronics is mounted in an aluminum die-cast housing and the optical window is covered with an infrared filter6, in order to avoid stray light.
In the end-cap alignment system, the CCD7 has 320×240 pixels with a size of 10µm being controlled and read out through the LWDAQ system. The mask is a thin (0.5µm thick) film chromium-glass slide with a modified chessboard pattern, back-illuminated by an array of 9 infrared LEDs (875 nm wavelength). The squares on the chessboard
5 VV5430 Monolithic Sensor, VLSI Vision Limited, Edinburgh, UK
6 RG830 Schott filter by Bes Optics Inc., W. Warwick, RI, USA.
7 Type TC255P, National Instruments Corporation, Austin, TX, USA.
pattern have dimensions such that a black/white square is projected onto at least 5–10 CCD pixels. Depending on the setup, a variety of square sizes in the range 85–340µm are used.
The lens is usually placed approximately halfway between mask and CCD. As the mask dimensions (of order cm) are larger than those of the CCD (of order mm), the image projected onto the CCD corresponds to only a small fraction of the mask. In order to determine its location on the mask, the chessboard pattern is modified in every ninth column and row to encode coarse position information. Fine position information is obtained from an interpolation of the many black/white transitions, and should be better by a factor of
Npixel than the CMOS pixel size of 12µm.
A nice feature of the RASNIK is the decoupling of dynamic range and position res- olution: the dynamic range can be increased by using a larger mask, without any loss in resolution. With this, the dynamic range of the RASNIK can be extended to several decimeters. For a symmetric RASNIK, where the lens is positioned halfway between CCD and mask, position resolutions of a few microns have been obtained for the coordinates transverse to the optical axis. The longitudinal position is measured by the magnifica- tion of the image, and the resolution is about 10−5times the distance between CCD and mask.
1.3.2. BCAM/SaCam
The BCAM (Boston CCD Angle Monitor) used in the end-cap alignment is a camera, consisting of a CCD and a lens, which looks at a laser diode at a distance between 0.5 m and 16 m. The distance from CCD to lens is very close to the focal length of the lens, about 76 mm, and the image seen by the camera is thus a blurred circular light spot.
The position of the centroid of this light spot on the CCD can be translated into a transverse angle with respect to the BCAM optical axis. The longitudinal position can be obtained, with lower precision, from the relative angle between the image of two laser diodes mounted in the same BCAM if their separation is known. One or two cameras and two or four laser diodes are integrated in one BCAM. In the case of two cameras, they are arranged next to each other facing in opposite directions.
BCAMs can be used in two configurations. Each BCAM of a pair is a directional two- point monitor, measuring the absolute angular position of its partner to an accuracy of 50µrad. A triplet of BCAMs on a straight line is a three-point straightness monitor, each of the outer BCAMs measuring the relative angular positions of the two others with an accuracy of 5√
2µrad. In addition, each pair of BCAMs in such a triplet also provides two-point information. The effective longitudinal precision, using the two laser diodes separated by 16 mm, ranges from 300µm at 0.5 m to 75 mm at 16 m. The dynamic range of a BCAM is ±21 mrad in horizontal and±16 mrad in vertical direction, given by the active area of the CCD.
The SaCam (Saclay Camera) used in the barrel alignment is very similar to the BCAM.
Its CCD is of the same type as the one used for the barrel RASNIKs, and the lens is mounted at a distance of 80 mm from the CCD. The target is formed by 4 back- illuminated holes at two different spacings: 15×15 mm for standalone targets and 35× 50 mm for targets mounted on a camera housing.
1.4. The barrel alignment system setup
The H8 barrel alignment setup comprises 66 optical lines, i.e. about 1% of the optical lines of the barrel spectrometer. Important features like the data acquisition chain, cali- bration procedures and cabling schemes have been tested under real conditions. The 66 optical lines can be divided in different classes, as listed in Table 1.
Name sensor type number alignment type In-plane RASNIK 24 MDT deformations Praxial RASNIK 12 Plane alignment Axial RASNIK 6 Plane alignment Projective RASNIK 8 Tower alignment Reference SaCam 16 Link to the toroid
CCC SaCam – Small-to-large chamber connection BIR-BIM RASNIK – BIR-to-BIM chamber connection
Table 1
The seven classes of optical lines used in the barrel alignment system. In the test beam setup only the first five were present.
Each MDT chamber is equipped with four in-plane RASNIK lines to monitor defor- mations of the chambers. The rˆole of the projective alignment system is to provide the relative positions, later translated to sagitta corrections, of the three chamber layers.
However, in ATLAS not all barrel chambers can be located on projective lines due to the lack of space. Therefore, additional systems are required to establish an optical link be- tween the chambers with projective elements and the adjacent chambers without. These praxial and axial alignment sensors are used to align the MDT chambers within a cham- ber layer with respect to each other; the sensors are installed at the corners of the MDT chambers.
In ATLAS, an optical link from the MDT chambers to the barrel toroid is established by the reference system, which is divided in two parts: a set of SaCam cameras linking the coils to each other, and another set linking the coils to the chambers. All these cameras are mounted on plates, which in the test beam were fixed on external supports. The CCC (Chamber-to-Chamber Connection) systems provide links between the Small and Large chambers. BIR-BIM connections are special optical links between chambers in the two sectors where the support feet of the ATLAS structure are located. As in the test beam only Large chambers were installed, these systems have not been tested. Since the MDT wires are the reference objects for muon track measurements, all alignment sensors on chambers were positioned with respect to MDT wires by means of precise mechanical tools.
1.5. The end-cap alignment system setup
While the barrel region can accommodate an alignment system mainly based on the measurement of relative positions of chambers in a tower, i.e. of triplets of chambers
traversed by a muon, the alignment in the end-caps requires the addition of alignment bars [20]. These are hollow aluminum tubes, up to 9.6 m long, used as precision refer- ence rulers: as for chambers, their deformation, relative position, and thermal expansion are monitored by optical and temperature sensors. The positions of the end-cap MDT chambers are monitored by optical sensors relative to the closest alignment bars, rather than to the other chambers in the same tower.
The end-cap alignment scheme has been designed as follows. The relative positions of alignment bars are measured using a grid of BCAMs. These are arranged as radial pairs (along an alignment bar) and azimuthal pairs (inside a chamber layer), and as polar triplets (connecting different layers) of BCAMs. RASNIK proximity sensors are used to monitor the positions of MDT chambers with respect to alignment bars, in addition, az- imuthal BCAMs look at light sources on MDT chambers. Three-point RASNIKs measure the deformations of MDT chambers and of alignment bars. Finally, temperature sensors monitor the thermal expansion of chambers and bars.
An important feature of the end-cap system is factorization: it is possible to recon- struct the alignment in sequential steps without significant loss of precision. The shape of alignment bars and MDT chambers can be reconstructed individually, then the relative alignment of all the bars is performed, and finally the positions of pairs of chambers are determined with respect to the closest alignment bars. This reduces the required com- puting power, as the complexity of an alignment problem grows (for a moderate number of objects) approximately with the square of the number of objects to be aligned in one step.
1.6. The detector control system 1.6.1. The MDT control system
The Detector Control System (DCS) [15,16] handled the configuration, readout, and monitoring of temperature sensors, alignment devices, and low voltage power for the MDT front end electronics for both the barrel and end-cap regions of the setup. The readout, monitoring, and first stage analysis tasks were distributed across seven proces- sors linked by the DIM data transfer system [17], a client/server protocol developed at CERN. The central monitoring and user interfaces were built using the general purpose industrial control system PVSS-II8, which had been selected by CERN for the LHC experiments. PVSS can run as a distributed system and permits object-like definition of devices and components. A graphical editor and a scripting language assist in the development of monitoring code and a framework developed at CERN [18] allows for configuration of large arrays of devices.
The low voltage power for the readout electronics boards on each MDT chamber was fed by two power supplies9. Each of them was a node on a CANBus10 connected to a Kvaser11 PCI CAN board in a computer running PVSS. The supplies were controlled and read by a PVSS process via the OPC12 client/server protocol.
8 Produced by ETM AG, Eisenstadt, Austria.
9 Model PL 500, Wiener, Burscheid, Germany.
10Controller Area Network, CAN in Automation, International Users’ and Manufacturers’ group.
11Kvaser, Advanced CAN Solutions, M¨olndal, Sweden.
12Open Process Control (formerly OLE Process Control), an industry-wide standard data interface.
The temperature profile of MDT chambers was monitored by a number of temperature sensors mounted on both sides of each chamber. The barrel chambers and two end- cap chambers (EO station) were equipped with NTC thermistors13 while four end-cap chambers (EI and EM stations) were equipped with TMP sensors14. The six end-cap alignment bars (two bars per chamber station) were outfitted with interior Platinum Pt-100 and Pt-1000 temperature sensors15.
The temperature sensors were calibrated in the laboratory and calibration constants applied at the time data were read. The sensors were read out using the Embedded Local Monitor Boards (ELMB) [19] developed for voltage measurement and control in a high radiation environment. Each ELMB is a node on a CANBus carrying control signals and data readout. Temperature values were recorded at regular intervals by a PVSS process and the data were stored for use by the global alignment programs. The ELMB’s will also be used for magnetic field measurement and for configuration and monitoring of the on-chamber readout electronics.
A three-dimensional grid of optical alignment devices linked MDT chambers and, in the case of the end-cap, also the alignment bars [20]. Deformations of alignment bars and chambers were monitored by dedicated optical sensors. The alignment data acquisition system provided about 300 images for each readout cycle of about five minutes. A de- scription of the different types of optical devices used in the alignment systems is given in Section 1.3.
Image analysis tasks ran on different processors with a rate of about one image per second. Image analysis results were stored in local files and in a common database; during normal running about 15 MB of image analysis data were generated per day.
For the barrel alignment system, control of the hardware devices was done via multi- plexers and the image readout was handled by a frame grabber16 board in a computer running Windows. A server program configures the multiplexers and sends images via DIM to an analysis task. A supervisory PVSS program controls the data acquisition cycle and receives results for display and archiving.
In the end-cap, the Long Wire Data Acquisition System (LWDAQ) [21] controlled and read out the alignment sensors. Driver boards in a VME crate implement the flashing and readout sequence digitizing and buffering the images from the sensors to which they are connected through multiplexers. The end-cap system comprised 19 multiplexers (one per chamber and two per alignment bar plus one for the muon simulator camera) and three driver boards. The driver boards are controlled by an embedded microprocessor17 in the VME crate. This processor configures the drivers with the device addresses, exposure time, and readout sequence and receives the digitized image via the VME backplane for monitoring, display, and image analysis.
1.6.2. The RPC control system
The purpose of the DCS system for the RPC chambers is to monitor and control crucial parameters of the detector operating conditions:
13NTC type DC95, Thermometrics Inc., Edison NJ, USA
14Type TMP37, Analog Devices Inc., Norwood, MA.
15Produced by Pico Technology Limited, St Neots, Cambridgeshire, UK.
16Model DT3152 for the PCI bus, Data Translation, Marlboro, MA, USA.
17Type VP110, Concurrent Technologies, Essex, UK.
– gas flow and composition, manifold pressure;
– high voltage status (voltage and current monitor);
– gap currents (measured directly on the gas gaps);
– low voltage supplying the front-end electronics.
For some of these parameters, action must be taken in order to stabilize the working point of the chambers or to shut them down in case of emergency. For instance, corrections to the high voltage settings must be applied in order to compensate for variations of environmental parameters like temperature and pressure. The high voltage on the gas gaps must be shut down in case of gas problems (anomalous flow rate, bad composition, low pressure in the manifold), or in case of over-current.
The system architecture was based on a PC running windows XP, where a PVSS-II application runs continuously. The application had been developed using the standard Joint Control Project (JCOP) Framework for LHC experiments, developed at CERN [22].
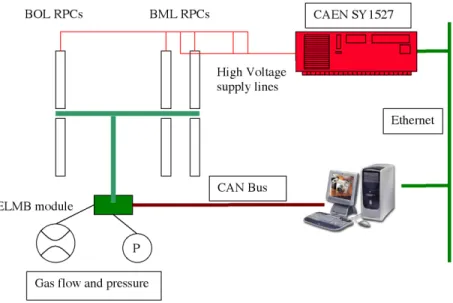
The PC was connected by a Ethernet link to a power supply mainframe18, and via a CAN bus to a ELMB module to read the gas parameters and gap currents. Figure 7 shows a schematic view of the system. Some key characteristics are given in Table 2.
Fig. 7. Schematic view of the RPC Detector Control System
Twelve high voltage supplies were used to power 48 RPC gaps via 1:4 splitter boxes.
Data was reported on a set of PVSS panels and was stored in a MySQL relational database organized as a Conditions Database. This database was structured with fold- ers and tables for each subsystem associating an interval of validity to each detector parameter.
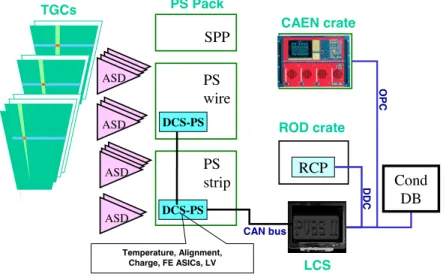
1.6.3. The TGC control system
The TGC control system [23], shown in Figure 8, was based on a single Local Control Station (LCS), i.e. a PC running a custom control application, based in turn on the PVSS-
18System 1527, CAEN, Viareggio, Italy.
Item Number Solution Connection
RPC detectors 6 — —
Gas flow rate 3 ELMB CAN-Open
Gas pressure 1 ELMB CAN-Open
Gap current 48 ELMB CAN-Open
High voltage 12 CAEN 1527 Ethernet Low voltage 6 CAEN 1527 Ethernet
Table 2
DCS-controlled RPC parameters.
II software. This PC was connected via a CAN bus to two ELMB modules, plugged on on-detector boards (DCS-PS boards) providing support to the on-chamber and front-end electronics. A special ELMB software, specific of the TGC detector, has been developed, extending the software provided by the central ATLAS DCS group.
CAEN crate PS Pack
TGCs
RCP
ASD
DCS-PS
DCS-PS
SPP
PS strip PS wire
ASD ASD
ASD
LCS
CAN bus Power Supplies
OPC
DDC
Temperature, Alignment, Charge, FE ASICs, LV
ROD crate
Cond DB
Fig. 8. Schematic view of the TGC Detector Control System.
In the TGC control system, DCS-PS boards perform most of the DCS control work.
They are plugged as mezzanine boards on the trigger electronics boards, called Patch panel and Slave (PS) boards, and interface the ELMB to the PS boards. During the test, the system controlled and monitored the following parameters on the trigger electronics boards and the TGC chambers:
– low voltage lines on the PS boards;
– temperature sensors placed on the detectors;
– the charge spectrum of seven analog wire groups, one channel per chamber;
– the Amplifier-Shaper-Discriminator threshold voltages;
– the on-chamber ASICs, including the configuration settings;
– voltage and current for seven high voltage channels, one channel per chamber.
A power supply mainframe19, controlled by the PVSS-II application on the PC, pro- vided high voltage to the TGC chambers.
The LCS communicated via a local area network with the data acquisition program running on the Single Board Computer20 hosted in the ROD crate, using the standard ATLAS DDC (DAQ-DCS Communications) program. It received commands from the data acquisition program to configure the front-end electronics according to parameters contained in a configuration file. At the end of each run, running condition data were stored in a MySQL relational database.
2. Performance studies of the MDT chambers
The MDT chambers are built from multi-layers of thin wall (0.4 mm) aluminum drift tubes. Each tube has a diameter of 30 mm and the wire has 50 µm diameter. The drift tubes are operated at a pressure of 3 bar with a 93%Ar-7%CO2 gas mixture. Each multilayer consists of three or four staggered tube layers. Typical operating high voltage is 3080 V, corresponding to a gas gain of about 2×10⁴. Given the non-uniform electric field, the drift velocity ranges from 20 to 100µm/ns. An important component of the MDTs is the tube end-plug that ensures, with a precisely machined reference surface, the positioning of the wire with the required accuracy. More details on the MDT chamber design and construction can be found in reference [1,3].
In order to meet the physics requirements, several criteria must be fulfilled by the MDT detector. The mechanical assembly of the drift tubes in a single chamber must ensure a positioning of the wires with respect of a local reference system with an accuracy of 20 µm; this is achieved with monitored, highly precise assembly procedures, and is certified with a dedicated X-ray tomography facility [27]. The relation between the measured drift time and the corresponding drift radius must be known with a 20µm accuracy; an iterative auto-calibration procedure [28] based on straight segment fits in a constrained multi-layer geometry has been shown to fulfill this requirement [29]. The average single- tube resolution must be better than 100µm, which translates into a sagitta resolution of about 50µm. The relative position of the chambers belonging to the same projective tower must be determined with an accuracy better than 40µm over distances up to 15 m;
requiring the alignment system described in the previous sections.
The basic design of the read-out of the chambers is as follows: groups of 24 tubes are connected to a single “hedgehog” card. This card capacitively decouples the signals from the tubes and feeds them to a “mezzanine” board, which is connected to the hedgehog card and contains the amplifiers, shapers, discriminators, and TDCs for encoding the signals of the 24 tubes connected to the hedgehog card. During the 2003 test, all MDT chambers were equipped with final electronics, with the exception of the Chamber Service Modules (CSM) [10]. These modules were prototypes, similar to the final ones.
19System 1527, CAEN, Viareggio, Italy.
20Type VP110, Concurrent Technologies, Essex, UK.
2.1. Electronics performance
During the 2003 H8, individual channel performance, cross talk and noise effects have been investigated. The drift tubes are instrumented with Amplifier-Shaper-Discriminator circuits (ASD) [30] and a ATLAS Muon TDC (AMT) [31] mounted on the mezzanine on one tube end, while the other end is terminated with the tube characteristic impedance of 380 Ω. The preamplifier input impedance is relatively low (120 Ohm) in order to maximize the collected charge. The shaper has a peaking time of 15 ns. For a gas gain of 2×10⁴the response function of the ASD is∼3 mV per primary electron, the nominal discriminator threshold is 44 mV corresponding to about 20 primary electrons, or to∼5 times the r.m.s. noise.
The digital part of the front-end electronics is clocked at the bunch crossing frequency of the LHC, 40 MHz. The AMT has a 5-bit interpolator with a least significant count of 25 ns/32 = 781.25 ps and a r.m.s. resolution of 250 ps. The time window for encoding the signals is programmable within a time range of 17 bits; for the tests described here it was set to 1.6µs. After shaping, the signal is converted with a logarithmic amplifier and sent to an 8-bit ADC that measures the charge in a 20 ns gate following the threshold crossing time. The charge is converted into a pulse width using the Wilkinson technique and encoded by the AMT. This information allows for improving the time resolution by applying a time-slewing correction. Since the 40 MHz clock is asynchronous with respect to the beam trigger, an additional mezzanine board was used to encode the trigger time in such a way that all drift times were corrected off-line and properly referred to the trigger.
The AMT data are read out via a serial link by a CSM [10], which buffers and multi- plexes them into a single output path that is also buffered, awaiting transmission to the MDT Read-Out Driver (MROD) [11]. In total, more than 3700 channels were read out with this scheme. Single tube performance studies were based on the hit counting rate, taking into account the corresponding TDC and ADC information. A detailed survey of a large set of data for all the chambers of the setup, spanning the entire 2003 data-taking period, was performed. 99% of the 1920 end-cap channels and 1800 barrel channels be- haved as expected. The few non-functioning channels were due to known problems, and were usually traced back to defects of the hedgehog cards.
For a quick estimate of the noise level, an analysis of the raw drift time distributions was done. This approach is suitable for on-line monitoring of noisy channels. The physical time spectrum is limited to the interval [t0, tmax], where t0 is the drift time of a track crossing the wire andtmax the drift time of a track at maximum distance from the wire (see Figure 9).
In contrast, noise hits are uniformly distributed over the TDC range. An estimate of the noise rate can therefore be obtained from the numbernnoiseof out-of-time hits, i.e.
hits with drift times smaller thant0 or larger thantmax in a sample of nsample events.
The hits are counted in a given time interval ∆t beforet0 or after tmax and the noise rate is computed as:
fnoise= nnoise
nsample∆t
The number of hits was estimated by fitting the two edges of the time distribution with step functions convoluted with Gaussian smearing, plus a flat background. The two
0 1000 2000 3000 4000 5000 6000 7000
0 200 400 600 800 1000 1200 1400 1600 1800 2000 Entries 2292052
7710. / 953
P1 67.09 1.518
P2 981.7 5.025
P3 6.914 0.1110E-01
P4 194.2 0.3224
P5 616.1 0.4016E-01
P6 1454. 0.1803
P7 5.169 0.2761E-01
P8 12.88 0.2105
TDC counts
Events/0.78 ns
Fig. 9. TDC spectrum for a set of drift tubes of multilayer 2, chamber BML 2. The fit to a double Fermi-Dirac function (see section 2.2) is superimposed.
regions usually give very similar noise rates. Noise rates in excess of a few kHz were related to bad ground connections of the mezzanine boards, and were promptly repaired during the first period of data-taking.
From the results obtained for all layers of the six barrel MDT chambers, two main features can be noticed:
– the noise changes little from one data taking period to another, apart of few layers exhibiting a large amount of out-of-time hits for a few particular runs;
– the noise is higher for strongly illuminated tubes, ranging from 0.5 to 1 kHz, while it is at a lower level for random trigger runs, typically a few hundred Hz.
To investigate the different contributions to out-of-time hits in the raw time distribution, and in particular to estimate the cross-talk between different channels, correlations were studied between drift times of neighbouring tubes. The fraction of events in which, for a valid drift time in a given reference tube, a hit was found in a nearby tube of the same layer is ≈ 8-9%. The majority of such hits is caused by genuine muon tracks crossing two adjacent tubes, such that the measured time is close to tmax in both tubes. From correlations between non-adjacent tubes, ≈ 2% of correlated spurious hits remain. To understand the source of this noise, the same multilayer is searched for “off-time tracks”, i.e. aligned doublets or triplets of tubes. Aligned off-time hits are due to real muons producing a signal in the trigger time window, in addition to the track causing the trigger. Taking into account such off-time tracks, the cross-talk between adjacent tubes is well below 1%.
In conclusion, the MDT cross-talk, defined as the probability of observing a cross-talk
pair per event, is about 0.03%. It has been observed only between channels connected to the same mezzanine board, is highest for adjacent tubes and decreases for more distant tubes. The cross-talk does not depend on the chamber occupancy, i.e. the probability of observing a cross-talk pair does not depend on the total number of hits.
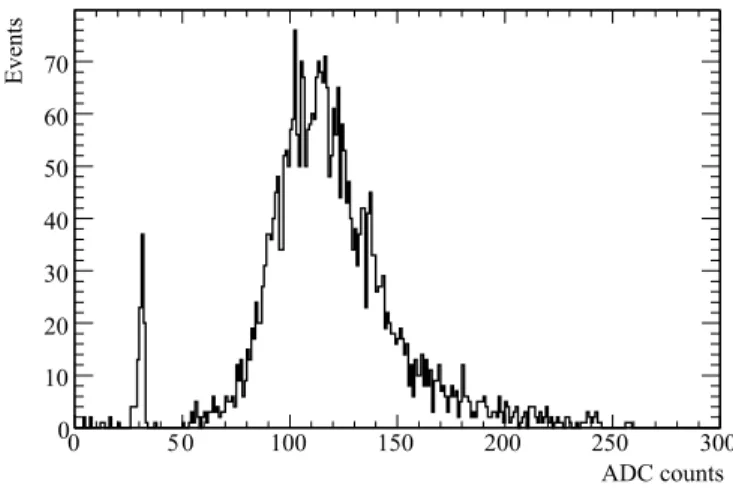
Additional information on the noise can be obtained by looking at the charge measured by the Wilkinson ADC. A typical distribution of the charge sampled by the ADC is shown in Figure 10. For genuine electronics noise, the ADC should not measure a charge above the pedestal value. Once requiring a charge below a given cut, the measured noise rate is at the level of a few hundred Hz, compatible with what is observed with a random trigger.
ADC counts
0 50 100 150 200 250 300
Events
0 10 20 30 40 50 60 70
Fig. 10. ADC spectrum for a set of drift tubes of multilayer 2, chamber BML 2
2.2. Stability of drift parameters
In order to study the stability with time of the MDT drift properties, data were collected for more than one month at constant gas mixture and flow rate (of∼1/2 volume exchange per day). The temperature variations during this period were monitored as explained in section 1.6.1.
The drift properties of the chambers were described by means of the maximum drift time variable, defined as tdrif t = tmax−t0. Variations in the composition of the gas mixture, temperature or pressure are promptly reflected by changes of tdrif t. In this study, an offline correction was applied to account for temperature variations, according to the functional form ∆tdrif t/∆T =−2.4 ns/K [29].
A typical TDC time spectrum is shown in Figure 9. The parameterst0 and tmax are determined by fitting the time distribution with an empirical functional form, consisting of a double Fermi-Dirac function, a constant term to account for noise and an exponential to reproduce the effect of variation of the drift velocity
dn
dt =P1+ P2 [1 +P3e(P5−t)/P4] [1 +e(P5−t)/P7] [1 +e(t−P6)/P8],