ATLAS-CONF-2014-057 30September2014
ATLAS NOTE
ATLAS-CONF-2014-057
September 26, 2014
Measurement of the di ff erential cross-section of highly boosted top quarks as a function of their transverse momentum using the ATLAS detector in
√ s = 8 TeV proton-proton collisions
The ATLAS Collaboration
Abstract
The di
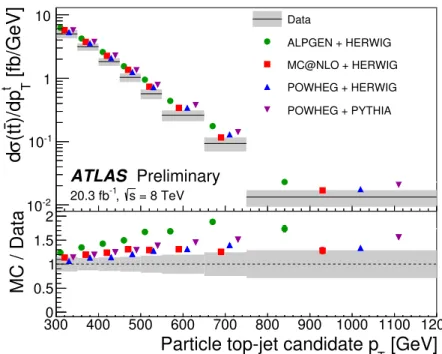
fferential cross-section for boosted top quark pair production is measured in 20.3 fb
−1of proton-proton collisions at a center-of-mass energy of 8 TeV. The measurement is per- formed for t¯ t events in the lepton+jets channel, where the hadronically decaying top quark has a transverse momentum above 300 GeV. Jet substructure techniques are employed to identify top quarks, which are reconstructed with an anti-k
tjet with radius parameter R
=1.0. The cross-section is reported as a function of the hadronically decaying top quark transverse momentum. The observed yield is corrected for detector e
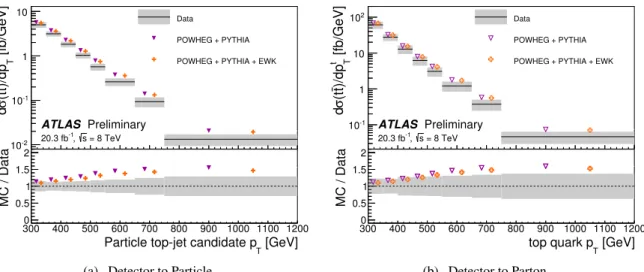
ffects to obtain a cross- section at particle-level in a fiducial region close to the event selection. A parton-level cross- section extrapolated to the full phase-space is also reported for top quarks with transverse momentum above 300 GeV. The predictions of next-to-leading-order and leading-order ma- trix element plus parton shower Monte Carlo generators are found to generally overestimate the measured cross-sections.
c
Copyright 2014 CERN for the benefit of the ATLAS Collaboration.
Reproduction of this article or parts of it is allowed as specified in the CC-BY-3.0 license.
1 Introduction
A wide range of theories beyond the Standard Model (BSM) predict new phenomena observable at the Large Hadron Collider (LHC). Several of the predicted new particles, such as vector-like quarks and the supersymmetric partners of quarks and gluons, are expected to produce final states with several jets, often including b-jets, lepton(s) and missing transverse energy (E
missT). Top-antitop quark (t¯ t) production presents a very similar experimental signature and, since t¯ t events are produced with a high cross-section at the LHC, this process often constitutes a dominant background to these searches for new physics. An improved understanding of t¯ t production, and a more precise determination of the parton distribution functions, would therefore be of great benefit to the LHC program. Furthermore, BSM t¯ t production mechanisms can distort the top quark transverse momentum (p
T) spectrum, in particular at high p
T(see e.g. Ref. [1, 2]). A precise measurement of the boosted top quark production rate might reveal a hint of physics beyond the Standard Model. The large number of t¯ t events produced so far at the LHC provide a unique opportunity to improve our understanding of t¯ t production and test the Standard Model (SM) at the TeV scale.
The first measurements of t¯ t production at the LHC have focused on a determination of the inclusive t¯ t cross-section. Now that the experimental uncertainties on these measurements (see e.g. Ref. [3–5]) are comparable to or lower than the theory uncertainties [6–11], the interest in di
fferential top cross-section measurements has gained traction. Measurements of the di
fferential cross-section as a function of the kinematics of the top quark, or the top-antitop quark pair, have been performed by the ATLAS [12, 13]
and CMS collaborations [14–16], where the highest top quark p
Tbin in a fully corrected measurement corresponds to the interval 350-800 GeV [13]. In this note the first such measurement is performed using techniques specifically designed to deal with the collimated decay topology of boosted top quarks.
In particular, the hadronic top quark decay is reconstructed as a single large-radius (large-R) jet. The selection and reconstruction are based on an algorithm developed [17] and used in t¯ t resonance searches [18–20]. It increases the t¯ t selection efficiency at high top quark p
Tand extends the kinematic reach into the TeV range. This analysis utilizes the lepton+jets channel where one W boson decays hadronically and the other leptonically, assuming each top quark decays to a W boson and a b-quark. The cross-section is measured as a function of the hadronically decaying top quark p
T. A particle-level cross-section is measured in a fiducial region resembling the detector-level selections for large-R jet p
Tabove 300 GeV. A parton-level di
fferential cross-section is also reported as a function of the top quark p
T. It is extrapolated to the full kinematic phase space except for a lower limit on top quark p
Tof 300 GeV.
This note is structured as follows. The analysis strategy is introduced in Sec. 2. This is followed by the descriptions of the ATLAS detector (Sec. 3), the data and Monte Carlo (MC) samples used in the analysis (Sec. 4) and the object definition and event selection (Sec. 5). The estimation of the background is presented in Sec. 6. The systematic uncertainties affecting the measurement are described in Sec. 7 followed by a comparison of the observed yield to the sum of the signal and background expectations in Sec. 8. The fiducial region at the particle-level and the technique used to unfold the reconstructed top p
Tspectrum to the particle and parton-levels are discussed in Sec 9, as well as the propagation of the statistical and systematic uncertainties through the unfolding procedure. The results and conclusions are presented in Sec. 10 and 11, respectively.
2 Analysis Strategy
The analysis starts by selecting a sample enriched in semileptonic t¯ t events (≈ 85%) with the following
event requirements. The hadronically decaying top quark is reconstructed using an anti-k
t[21] jet of
radius R
=1.0. The jet is trimmed [22] to mitigate the impact of initial state radiation, underlying event
activity, and additional pp interactions in the same bunch crossing (pile-up). Large-R jets containing
hadronically-decaying top quarks are selected by applying jet substructure cuts, which exploits the fact that they contain several high-p
Tsub-jets and a high mass, unlike jets originating from QCD radiation.
The leading large-R jet meeting these requirements is referred as the top-jet candidate. Since the two top quarks are predominantly produced back-to-back, a spatial separation between the leptonically decaying and the hadronically decaying top quarks is required. The lepton (e or
µ) is required to be isolated using aprocedure that retains a high efficiency when the decay products of the leptonic top quark are collimated.
A small-R anti-k
tjet (R
=0.4) is required to be close to the lepton and a significant amount of missingtransverse energy (E
missT) is demanded. At least one small-R jet has to be identified as originating from a bottom quark jet (b-tagged). More details on the identification and performance of boosted top quarks in ATLAS can be found in Ref. [23, 24].
After the event selection the background is composed primarily, in order of importance, of W
+jets, t¯ t dilepton, single-top, and QCD multijets events. They are estimated by MC simulation (either normalized to a theoretical cross-section or, for the case of t¯ t dilepton, as to determine its fraction of the full t¯ t sample), except for W
+jets, whose normalization and heavy-flavor content are adjusted in data control regions, and QCD multijets that is estimated with a fully-data driven method.
To minimize the dependence of the reported result on theoretical input, a particle-level fiducial region is designed to closely follow the event selection at the detector-level. Unfolding is carried out to correct for detector ine
fficiencies and smearing e
ffects to produce a cross-section measurement as a function of the p
Tof the leading selected particle-level large-R jets. A parton-level top quark p
Tmeasurement is also reported after correcting the particle-level spectrum for hadronization and fragmentation e
ffects, and extrapolating to the full phase space of t¯ t events with top quark p
T >300 GeV. The unfolded particle-level and parton-level spectra are then compared to the prediction of several MC generators.
3 The ATLAS detector
ATLAS is a multi-purpose detector [25] that provides nearly full solid angle coverage around the inter- action point. This analysis exploits all major components of the detector. Charged particle trajectories are reconstructed by the inner detector, comprised of a silicon pixel detector, a silicon microstrip detector and a transition radiation tracker (TRT), which covers pseudorapidity
1 |η| <2.5. The inner detector is embedded in a 2 T solenoidal magnetic field. Sampling calorimeters with several different designs span the pseudorapidity range up to
|η| =4.9. High granularity liquid argon (LAr) electromagnetic (EM) calorimeter are available up to
|η| =3.2. Hadronic calorimetry based on scintillating tile active material cover
|η|<1.7 while LAr technology is utilized for hadronic calorimetry from
|η|=1.5 to
|η|=4.9. The calorimeters are surrounded by a muon spectrometer. A magnetic field in the spectrometer is provided by air-core toroid magnets. Three layers of precision gas chambers track muons up to
|η|=2.7 and muon trigger chambers cover
|η|<2.4.
4 Data and Monte Carlo samples
The cross-section is measured using a dataset collected by the ATLAS detector during the 2012 LHC pp run at
√s
=8 TeV, which corresponds to an integrated luminosity of 20.3±0.6 fb
−1. The luminosity is measured using techniques similar to those described in Ref. [26] with a preliminary calibration of the luminosity scale derived from beam-overlap scans performed in November 2012. The average number of interactions per bunch crossing in 2012 was around 21. Data are considered only if they are acquired
1ATLAS uses a right-handed coordinate system with its origin at the nominal interaction point (IP) in the centre of the detector and thez-axis along the beam pipe. Thex-axis points from the IP to the centre of the LHC ring, and they-axis points upward. Cylindrical coordinates (r,φ) are used in the transverse plane,φbeing the azimuthal angle around the beam pipe. The pseudorapidity is defined in terms of the polar angleθasη=−ln tan(θ/2).
under stable beam conditions and with all sub-detectors fully operational. The sample is collected using the logical OR of two single electron triggers with transverse momentum thresholds of 60 GeV, low- ered to 24 GeV in case of isolated electrons, and two single muon triggers with transverse momentum thresholds of 36 GeV, lowered to 24 GeV in case of isolated muons.
Samples of MC simulated events are used to characterize the detector response and e
fficiency to reconstruct t¯ t events, estimate systematic uncertainties and predict the background contributions from various physics processes. The simulated events are weighted such that the distribution of the average number of pp interactions per bunch crossing agrees with data. The response of the detector is simulated using a detailed model implemented in GEANT4 [27]. For the evaluation of some systematic uncertain- ties, generated samples are passed to a fast simulation using a parameterisation of the performance of the ATLAS electromagnetic and hadronic calorimeters [28]. Simulated events are reconstructed using the same algorithms that are applied to collision data.
The nominal signal t¯ t sample is generated using the P
(P
-hvq patch4) [29] generator that is based on next-to-leading order QCD matrix elements. The CT10 [30] parton distribution functions (PDF) are employed and the top quark mass set to m
top =172.5 GeV. Parton shower and hadronization are simulated with P v6.425 [31] using the Perugia 2011 tune [32]. Electroweak corrections are applied to this sample, which are extracted with H
2.1-
[33] implementing the theoretical cal- culations of Ref. [34–36]. The prediction of P
is compared to that obtained with other generators such as MC@NLO v4.01 [37] interfaced to H v6.520 [38] for parton showering and hadronization, J
v4.31 [39] for the modeling of multiple parton scattering and CT10 for the PDF set. In addition, the leading order (LO) multi-leg generator A
v2.13 [40] interfaced to H
is used where up to four additional partons in the matrix-element (ME) are produced. The MLM [40] matching scheme is employed to avoid double counting of configurations generated by both the parton shower and the ME calculation. The CTEQ6L1 [41] PDF set is employed. Heavy-flavor quarks are included in the ME calculations to produce the t¯ t
+b b ¯ and t¯ t
+c c ¯ processes. The overlap between the heavy-flavor quarks produced from the ME calculations and from the parton shower is removed. For the evaluation of sys- tematic uncertainties due to the parton showering model, a P
+H
sample is compared to a P+P sample. The uncertainties due to QCD initial and final state radiation (ISR and FSR) modeling are estimated with samples generated with A
M
v3.8 [42] interfaced to P
for which the parton shower parameters are varied according to a measurement of the additional QCD activity in t¯ t events [43]. The electroweak corrections that are applied to the nominal P+P sample are not applied to the other samples. The t¯ t samples are normalized to the NNLO+NNLL cross-section
2[6–11]:
σtt¯ =
253
+−1513pb. Each t¯ t sample is produced requiring at least one leptonic decay in the top anti-top quark pair.
Leptonic decays of vector bosons produced in association with several high-p
Tjets, referred to as W
+jets and Z
+jets, constitute the largest background in this analysis. Samples of simulated W
/Z+jets events with up to five additional partons in the LO matrix-elements are produced with the A gen- erator interfaced to P
for parton showering using the MLM matching scheme. Heavy-flavor quarks are included in the ME calculations to produce the Wb b, ¯ Wc¯ c, Wc, Zb b ¯ and Zc¯ c processes. The over- lap between the heavy-flavor quarks produced by the matrix element and by parton shower is removed.
W
+jets samples are normalized to the inclusiveW boson NNLO cross-section [45, 46] and corrected applying additional scale factors derived from data, as described in Sec. 6.
Single top quark production is simulated using multiple generators. Production in the t-channel is re- alized using the A
M
generator while production in the s-channel and production in association with a W boson are modeled with P
. Both generators are interfaced with P
using the CTEQ6L1 PDF set and the Perugia 2011 tune for parton showering modeling. All samples are generated requir-
2The top++2.0 [44] calculation includes the next-to-next-to leading order QCD corrections and resums next-to-leading logarithmic soft gluon terms. The quoted cross-section corresponds to a top quark mass of 172.5 GeV.
ing the presence of a leptonically decaying W boson. The cross-sections multiplied by the branching ratios for the leptonic W decay employed for these processes are 28.4 pb (t-channel) [47], 22.4 pb (Wt production) [48], and 1.8 pb (s-channel) [49], as obtained from NLO+NNLL calculations.
Diboson production is modeled using S
[50] with the CT10 PDF set and the yields are normal- ized to the NLO cross-sections [51].
5 Object definition and event selection
Electron candidates are reconstructed as charged particle tracks in the inner detector associated with energy deposits in the EM calorimeter. They must pass identification criteria based on the shower shape in the EM calorimeter, on track quality, and on the transition radiation observed in the TRT detector. The EM clusters are required to be in the pseudorapidity region
|η| <2.47, excluding the transition region between the barrel and the encdap calorimeters (1.37
<|η|<1.52). They must have a transverse energy E
T >25 GeV. The associated track must have a longitudinal impact parameter
|z0|<2 mm with respect to the primary vertex.
Muon candidates are defined by matching track segments in the muon spectrometer with tracks in the inner detector. The track p
Tis determined through a global fit of the track that takes into account the energy loss in the calorimeters. The track is required to have
|z0|<2 mm and a transverse impact param- eter significance indicating the track is consistent with coming from the hard scatter,
|d0/σ(d0)|
<3.
Muons are required to have p
T >25 GeV and be in the fiducial region
|η|<2.5.
Lepton candidates are required to be isolated to suppress background leptons originating from jets.
The variable “mini-isolation” [52] is introduced and is defined as I
mini = Ptracks
p
trackT /p
lT, where p
lTis the lepton transverse momentum and the sum is over all tracks (excluding the lepton track) that have p
T >0.4 GeV, pass quality cuts and have
∆R(l, track)
<K
T/p
lT. The isolation cone radius decreasing with the increasing p
lTimproves the selection e
fficiency for high-p
Tdecays. The parameter K
Tis set to 10 GeV and the isolation requirement I
mini <0.05 is applied for both electrons and muons.
Jets are reconstructed using the anti-k
talgorithm [21] implemented in the F
J
package [53] with radius parameter R
=0.4 or R
=1.0, using as input calibrated topological clusters [54, 55]. A pile- up correction is applied for small-R jets by estimating the transverse momentum induced by pile-up interactions on an event-by-event basis using the jet area [56] and the median of the transverse momentum distribution density [57] of all jets found by the k
talgorithm [58,59]. The p
Tof small and large-radius jets and the large-R jet mass, obtained from the four-momentum sum of all jet constituents, are calibrated using energy- and
η-dependent correction factors. After this calibration, thep
Tand mass of the jets correspond on average to the ones of the corresponding truth-level jets, which are built from the stable particles produced by the MC event generator [23, 60]. Differences between the small-R jet response in data and MC simulation are evaluated from control samples and corresponding corrections are applied to data. Small-R jets are required to be in the fiducial region
|η| <2.5 and must have p
T >25 GeV.
The jet vertex fraction (JVF) exploits the fraction of tracks associated to the jet coming from the primary vertex and is computed as the summed p
Tof all tracks matched to the jet from the primary vertex divided by the summed p
Tof all tracks matched to the jet. Small-R jets with p
T <50 GeV are rejected when
|JV F| <0.5, to reduce the contribution of jets generated by pile-up interactions. The trimming algorithm [22] with parameters R
sub=0.3 and f
cut=0.05 is applied to large-R jets to suppress the effect of the pile-up and improve background rejection. Trimmed large-R jets are considered for the analysis if
|η|<
2.0 and p
T >300 GeV.
Small-R jets originating from b-quarks are tagged exploiting the long decay time and the large mass
of the b-quark hadrons. Information from the track impact parameters, secondary vertex location and
decay topology are combined in a neural network based algorithm (MV1) [61]. The operating point
corresponds to an overall 70% b-tagging efficiency in t¯ t events, and to a probability to mistag light-flavor
jets of approximately 1%.
Since leptons deposit energy in the calorimeters, an overlap removal procedure is applied in order to avoid double counting of leptons and small-R jets. In order to improve the reconstruction efficiency in the boosted topology, a specific overlap removal procedure has been adopted. First, jets close to electrons, with
∆R(e, jet
R=0.4)
<0.4 are corrected by subtracting the electron four-vector from the jet four-vector and the JVF is recalculated removing the electron track. The new e-subtracted jet is retained if it passes the jet selection criteria listed before, otherwise it is rejected. After this procedure, electrons that are still within
∆R(e, jet
R=0.4)
<0.2 from a small-R jet are removed. The muon-jet overlap removal procedure removes muons that fall inside a cone of
∆R(µ, jet
R=0.4)
<0.04
+10 GeV/p
T,µaround a small-R jet axis.
The missing transverse energy E
missTis computed as the vector sum of the energy of all calorimeter cells. Their energy is corrected on the basis of the associated physics object. The contribution of muons is added using their momentum obtained from the tracking system and the muon spectrometer.
The event selection proceeds as follows. Each event must have a reconstructed primary vertex with five or more associated tracks. The events are required to contain exactly one reconstructed lepton can- didate geometrically matched to the trigger object (where the trigger is defined in Sec. 4). The transverse mass of the lepton and E
missTis defined as m
WT = q2p
leptonTE
missT(1
−cos
∆φ), where∆φis the azimuthal angle between the lepton and E
Tmiss. Events are retained if E
missT >20 GeV and E
missT +m
WT >60 GeV to suppress QCD multijets events.
The selection exploits the fact that the boosted top quark decay products tend to be collimated.
Therefore events are selected by requiring the presence of at least one small-R jet close to the lepton (
∆R(l, jet
R=0.4)
<1.5) and the existence of a reconstructed large-R trimmed jet with mass m
jet>100 GeV.
To improve the rejection of jets originating from QCD radiation from light quark or gluon jets a cut on the k
tsplitting scale [58, 59] of the large-R jets is made. The k
tsplitting scale is calculated by reclustering the large-R jet with the k
t-clustering algorithm, and taking the k
tdistance between the two proto-jets of the final clustering step
√d
12 =min(p
T1,p
T2)
∆R
12. It is expected to have large values for jets containing two hard subjets, as expected in the decay of massive objects. Events are selected if the large-R jet has
√d
12 >40 GeV [24]. The large-R jet must be well separated from the lepton (
∆φ(l,jet
R=1.0)
>2.3) and from the small-R jet associated to the lepton (
∆R(jet
R=1.0,jet
R=0.4)
>1.5).
If more than one large-R jets satisfy these criteria, the one with highest p
Tis considered as the top-jet candidate. Finally, at least one of the two top candidates must be b-tagged. This implies that either the highest p
Tsmall-R jet close to the lepton (
∆R(l, jet
R=0.4)
<1.5) or at least one small-R jet close to the large-R jet (∆ R(jet
R=1.0,jet
R=0.4)
<1.0) are b-tagged
3.
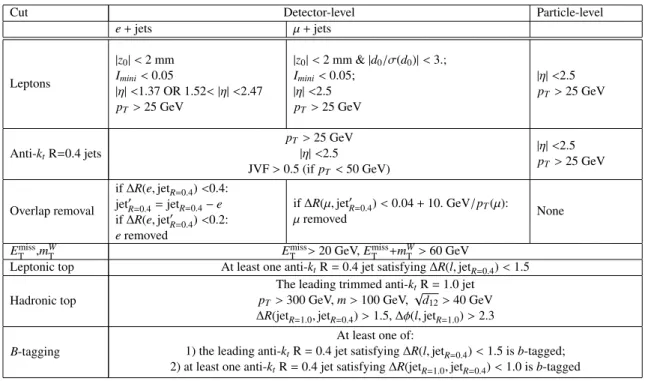
The event selection is summarized in Tab. 1. After these requirements the data sample contains 4148 and 3604 events in the electron and muon channels, respectively. The observed yield is compared to the Standard Model prediction in Sec. 8.
6 Background estimation
W
+jets production represent the largest non-t¯t contribution in the final sample. The strategy to pre- dict this background is to use as a starting point the A
+P
W
+jets samples normalized to theinclusive W boson NNLO cross-section. The normalization and heavy flavor fraction of the W
+jets background have large theoretical uncertainties, and are thus determined from data.
The heavy flavor fraction scale factors correct for the mis-modeling in the generator of the fractions of W production associated di
fferent flavour components (W
+b b, ¯ W
+c¯ c, W
+c). They are estimated in a sample with the same lepton and E
missTselections as the signal selection, but with only two small-R
3Note that the reconstruction of a large-Rjet does not prevent the reconstruction of small-Rjets overlapping with it.
Cut Detector-level Particle-level
e+jets µ+jets
Leptons
|z0|<2 mm Imini<0.05
|η|<1.37 OR 1.52<|η|<2.47
pT >25 GeV
|z0|<2 mm &|d0/σ(d0)|<3.;
Imini<0.05;
|η|<2.5 pT >25 GeV
|η|<2.5 pT >25 GeV
Anti-ktR=0.4 jets
pT>25 GeV
|η|<2.5
JVF>0.5 (ifpT<50 GeV)
|η|<2.5 pT >25 GeV
Overlap removal
if∆R(e,jetR=0.4)<0.4:
jet0R=0.4=jetR=0.4−e if∆R(e,jet0R=0.4)<0.2:
eremoved
if∆R(µ,jet0R=0.4)<0.04+10.GeV/pT(µ):
µremoved None
EmissT ,mWT EmissT >20 GeV,ETmiss+mWT >60 GeV
Leptonic top At least one anti-ktR=0.4 jet satisfying∆R(l,jetR=0.4)<1.5 Hadronic top
The leading trimmed anti-ktR=1.0 jet pT>300 GeV,m>100 GeV,√
d12>40 GeV
∆R(jetR=1.0,jetR=0.4)>1.5,∆φ(l,jetR=1.0)>2.3 B-tagging
At least one of:
1) the leading anti-ktR=0.4 jet satisfying∆R(l,jetR=0.4)<1.5 isb-tagged;
2) at least one anti-ktR=0.4 jet satisfying∆R(jetR=1.0,jetR=0.4)<1.0 isb-tagged
Table 1: Summary of event selections for detector-level and truth particle-level events.
jets and no b-tagging requirements. The b-jet multiplicity, in conjunction with the knowledge of the b- tagging and mistag e
fficiency, is used to extract the heavy flavor fraction in this sample. This information is extrapolated to the signal region using the MC simulation, assuming constant relative rates for the signal and control regions.
The overall W
+jets normalization is obtained by exploiting the expected charge asymmetry in the production of W
+and W
−at a pp collider. This asymmetry is predicted precisely by theory, and other processes in the t¯ t sample are symmetric in charge except for a small contamination from single-top and WZ events which is corrected by MC. The total number of W
+jets events in the sample can thus be estimated with the following equation:
N
W++N
W− =r
MC+1 r
MC−1
!
(D
corr+−D
corr−), (1)
where r
MCis the ratio of the number of events with positive to negative leptons in the MC, and D
corr+and D
corr−are the number of events with positive and negative leptons in the data, respectively. The signal sample has too few events and is too depleted in W
+jets events to apply Eqn. 1 directly. Insteada sample enhanced in W
+jets events is created by dropping theb-tagging,
∆φ(jetR=1.0,l), jet mass and
√
d
12requirements. The obtained scale factors are applied to the normalized W
+jets MC samples. After correction by this scale factor W
+jets events are expected to make up approximately 6% of the total eventyield in the signal region.
QCD multijet events can, in rare instances, mimic the lepton
+jets signature. This background is estimated directly from data by using the matrix-method technique (see e.g. Ref. [62]). A sample enhanced in fake leptons, characterized by non-prompt leptons or jets misidentified as prompt leptons, is obtained by loosening the lepton identification requirements. The number of events with fake leptons in the signal region can be predicted as:
N
QCD=(
−1) f
−
f N
T+f
−
f N
A,(2)
where and f are the efficiencies for leptons that passed the loose selections to also pass the tight (signal) selections, for real and fake leptons respectively, N
Tis the number of events with a tight lepton, and N
Ais the number of events with a loose lepton which failed the tight cuts. The efficiency f is measured using data in fake-enhanced control regions and the rate is extracted from MC and validated in data. QCD multijets events contribute to the total event yield at approximately the percent level.
Single-top, Z
+jets and diboson events, all sub-dominant backgrounds, are estimated from MC gen-erators normalized to the best known theory calculation of their cross-sections. Their corresponding MC samples are described in Sec. 4.
Top quark pair events with both top and anti-top quarks decaying leptonically (including decays to
τ) can sometimes pass the event selection, contributing to approximately 5% of the total event yield. Thefraction of dileptonic t¯ t events in each p
Tbin is estimated using the same MC sample used for the signal modeling (see Sec. 4). Leptonic top quark decays to
τ-leptons in lepton+jetst¯ t events are considered as signal only if the
τlepton decays leptonically.
7 Systematic uncertainties
Systematic uncertainties, which arise from object reconstruction and calibration, MC generator modeling and background estimation, are described below. The propagation of systematic uncertainties through the unfolding procedure is described in Sec. 9.4.
The uncertainty on the large-R jet energy scale (JES), jet mass scale (JMS) and k
tsplitting scale is obtained using two di
fferent data-driven methods. For p
T >800 GeV for JES, and for all p
Tfor the JMS and k
tsplitting scale, the ratio of the large-R jets kinematic variables reconstructed from the calorimeter clusters to inner detector tracks is compared between data and MC. For p
T<800 GeV for JES, the p
Tof large-R jets are compared to the well calibrated p
Tof photons in a large statistics photon
+jets sample. An additional MC-based uncertainty, referred to as large-R JES topology uncertainty, is included to reflect the fact that the jets in these calibration samples have a different response (gluon or light quark jets) than those in t¯ t events (top-jets). The full di
fference between the response of these two types of jets is conservatively assumed as the corresponding systematic uncertainty. The uncertainty on the large-R jet energy resolution (JER) is determined by smearing the jet energy such that the resolution is increased by 20% [63] and evaluating the effect on the final result. The same smearing procedure is applied to determine the uncertainty due to the large-R jet mass resolution (JMR). The uncertainties on the large-R jets JES represent the dominant contribution to the total uncertainty of this measurement, in particular the photon+jet calibration and the topology uncertainties.
The small-R jet energy scale uncertainty is derived using a combination of simulations, test beam data and in situ measurements [55, 64, 65]. Additional contributions from the jet flavour composition, calorimeter response to different jet flavours and pile-up are taken into account. Uncertainties in the jet energy resolution are obtained with an in situ measurement of the jet response asymmetry in di-jet events [66].
The efficiency to tag real and fake b-jets is corrected in Monte Carlo events by applying b-tagging scale factors, extracted in t¯ t and dijet samples, that compensate for the residual di
fference between data and simulation. The associated systematic uncertainty is computed by varying the scale factors within their uncertainty [61, 67, 68]. The b-jet calibration is performed up to p
T=300 GeV; for larger transversemomenta an additional MC-based extrapolation uncertainty, which ranges from 10% to 30% increasing with b-jet p
Tfrom 300 GeV to 1200 GeV, is applied
4.
The lepton reconstruction efficiency in the simulation is corrected by scale factors derived from mea- surements of these e
fficiencies in data using a Z
→l
+l
−enriched control regions. The lepton trigger
4Theb-jetpTdistribution extends to approximately 600 GeV in this analysis.
and reconstruction efficiency scale factors, energy scale and resolution are varied within their uncertain- ties [69, 70].
The uncertainty associated to E
missTis calculated by propagating the energy scale and resolution systematics on all physics objects to the E
missTcalculation. Additional E
missTuncertainties arising from energy deposits not associated with any reconstructed objects are also included [71].
The signal modeling uncertainty, including the parton shower and hadronization models, is evaluated by comparing the result obtained with P
+P
with the ones obtained with MC@NLO
+H
, A
+H
and P
+H
. The largest deviation between all of these alternate t¯ t samples and the nominal P+P sample is symmetrized and used as the signal modeling uncertainty. The modeling of QCD initial and final state radiation (ISR and FSR) is evaluated separately using dedicated A
M
+P
samples with variation of the P
parameters for QCD radiation. In addition, a relative uncertainty of 10% is included on the t¯ t production electroweak correction [34–36], which has an impact of less than 1% on the reported cross-section.
The W
+jets systematic uncertainties due to the overall normalization and the heavy flavor fraction are obtained by varying the data-driven scale factors within their uncertainty. A W
+jets shape uncertainty is also extracted by varying the renormalization and matching scales in A. The W
+jets MC statisticaluncertainty is also taken into account, its contribution to the cross-section uncertainty increases with the top-jet candidate p
Tfrom approximately 1% to 6%. The uncertainty on the fake lepton background is included by varying the definition of loose leptons, changing the selection used to form the control region and propagating the statistical uncertainty of parameterisations of the e
fficiency and the fake rate.
A 50% uncertainty is applied to the normalization of the Z
+jets and diboson backgrounds. The single- top background is assigned an uncertainty associated to the theory calculations used for its normalization [47–49], as well as a shape uncertainty extracted by comparing two MC generators.
8 Data and MC comparison at detector-level
Having evaluated the background and systematic uncertainties, the agreement between the predicted signal and background yields and data is assessed. Tab. 2 gives the number of observed and expected events for each process, where the systematic uncertainties on the background estimates, objects energy scale and reconstruction efficiencies, and MC statistics are taken into account. The prediction is generally found to overestimate the data by approximately one standard deviation (when signal modeling and t¯ t cross-section uncertainties are taken into account, which are not included in the table).
e
+jets µ+jetst¯ t
`+jets4020
±460 3500
±400 t¯ t dilepton 227
±36 210
±26 W
+jets 263
±50 252
±48 single top 136
±27 134
±25
Multijet 91
±17 3
±1
Z
+jets 34
±18 14
±8 Dibosons 22
±11 18
±9 Prediction 4790
±540 4130
±470
Data 4148 3604
Table 2: Observed and expected number of events in the signal e
+jets and
µ+jets samples. The systematic
uncertainties include the background estimates, objects energy scale and reconstruction e
fficiencies, and
MC statistics
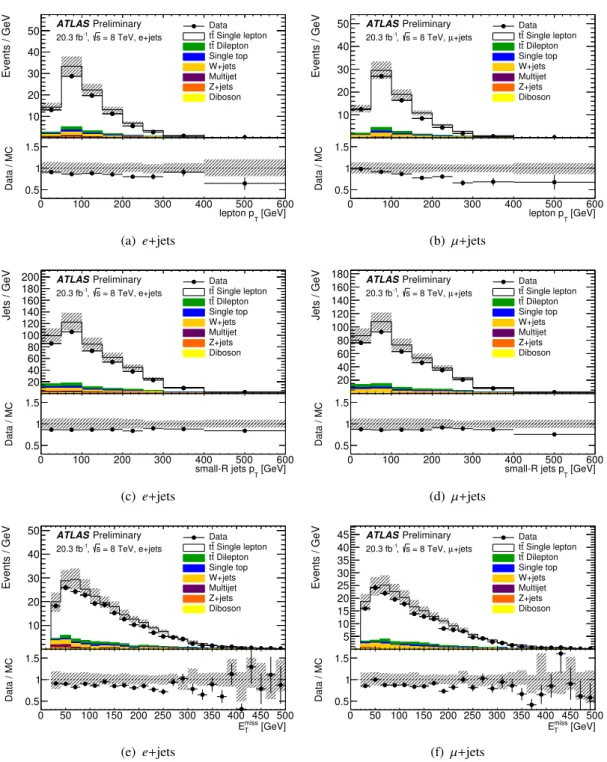
The agreement of the data with the prediction is further tested by studying the distributions of several variables of interest in Fig. 1-2. Each figure shows on the left and right the electron and muon channels, respectively. The systematic uncertainties on the objects energy scale and reconstruction efficiencies, on the background estimates, and from MC statistics are shown. Figure 1 shows the p
Tof the lepton candidate, the p
Tof the selected small-R jet and E
Tmiss. Figure 2 shows kinematic distributions for the leading large-R jet in the event, i.e.
η, mass andp
T. While the prediction generally overestimates the data, as observed already from Tab. 2, the shape of each variable is generally well modelled by the simulation. Exceptions are the p
Tof the candidate lepton and the large-R jet. For these distributions the disagreement increases with p
T, with the simulation overestimating the data by up to approximately 50% in the highest bin. The distribution of the p
Tof the leading large-R jets constitutes the input to the unfolding procedure described below.
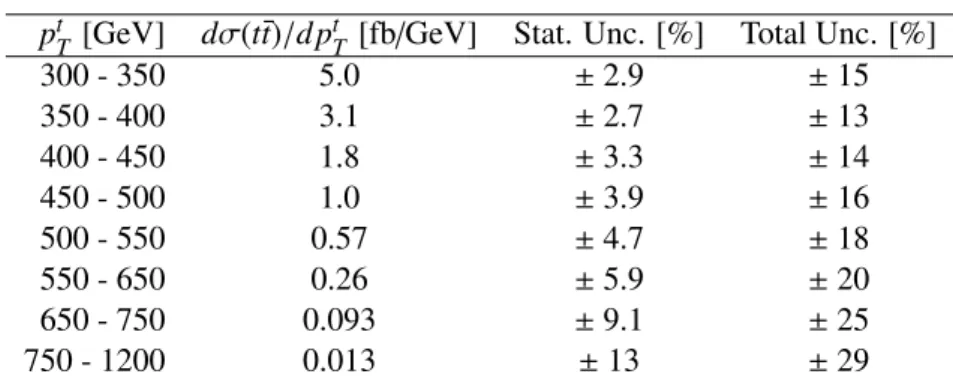
9 Di ff erential cross-section determination
The di
fferential cross-section is measured as a function of the p
Tof the particle-level top-jet candidate, defined as the leading trimmed large-R jet in the event and in a specific fiducial region of phase space close to the event selection. Both the large-R jet and the fiducial region are defined at the particle-level.
The di
fferential cross-section is also measured at the parton-level as a function of the p
Tof the top quark.
The combination of the results of e
+jets and
µ+jets channels is described in Sec. 9.1. To mimimize the corrections of the observed data to the particle level, particles and particle jets are defined in a kinematic phase-space that is close to the experimental selection for observable objects (fiducial region). A second correction extrapolates the result to the full parton-level phase space above top quark p
T >300 GeV.
The definitions are presented in Sec. 9.2. The procedures to correct for the detector inefficiencies and finite resolution from the reconstructed to the particle- and parton-level are presented in Sec. 9.3. The propagation of the systematic and statistical uncertainties through the unfolding procedure, and their results, are discussed in Sec. 9.4.
9.1 Combination of decay channels
A combined
`+jets data sample is built by a logical “OR” of the e
+jets and
µ+jets selections at the detector-level. The MC samples used to derive simulated predictions for signal and backgrounds are also subjected to the combined selection. The resulting combined simulated samples are built according to the proportions dictated by their respective efficiency. The data-driven backgrounds are derived in each channel independently as described in Sec. 6 and added to the combined simulated predictions.
A combined simulated t¯ t sample is used to derive the particle and parton fiducial phase spaces and the associated unfolding corrections described in Sec. 9.3. The uncertainties are evaluated based on the sum of the events. This approach properly accounts for all correlations since e
ffects that are independent between channels (e.g. electron scale factors) are accounted for only in the specific subsample (e.g.
e
+jets events), while common effects (e.g. jet energy scale) affect the full sample, with each channel contributing with the appropriate weight.
This combination method is cross-checked by performing the unfolding in each channel individually
to the
`+jets phase space described in Sec. 9.2 and comparing these alternate cross-section estimates
with the one based on the combined data.
0 100 200 300 400 500 600
Events / GeV
10 20 30 40
50 Datatt Single lepton
Dilepton t t Single top W+jets Multijet Z+jets Diboson ATLASPreliminary
= 8 TeV, e+jets s
-1, 20.3 fb
[GeV]
lepton pT
0 100 200 300 400 500 600
Data / MC 0.5
1 1.5
(a) e+jets
0 100 200 300 400 500 600
Events / GeV
10 20 30 40
50 Data
Single lepton t
t Dilepton t t Single top W+jets Multijet Z+jets Diboson ATLASPreliminary
+jets = 8 TeV, µ s
-1, 20.3 fb
[GeV]
lepton pT
0 100 200 300 400 500 600
Data / MC 0.5
1 1.5
(b) µ+jets
0 100 200 300 400 500 600
Jets / GeV
20 40 60 80 100 120 140 160 180
200 Data
Single lepton t
t Dilepton t t Single top W+jets Multijet Z+jets Diboson ATLASPreliminary
= 8 TeV, e+jets s
-1, 20.3 fb
[GeV]
small-R jets pT
0 100 200 300 400 500 600
Data / MC 0.5
1 1.5
(c) e+jets
0 100 200 300 400 500 600
Jets / GeV
20 40 60 80 100 120 140 160
180 Data
Single lepton t
t Dilepton t t Single top W+jets Multijet Z+jets Diboson ATLASPreliminary
+jets = 8 TeV, µ s
-1, 20.3 fb
[GeV]
small-R jets pT
0 100 200 300 400 500 600
Data / MC 0.5
1 1.5
(d) µ+jets
Events / GeV
10 20 30 40
50 Data
Single lepton t
t Dilepton t t Single top W+jets Multijet Z+jets Diboson ATLASPreliminary
= 8 TeV, e+jets s
-1, 20.3 fb
[GeV]
miss
ET
0 50 100 150 200 250 300 350 400 450 500
Data / MC 0.5
1 1.5
(e) e+jets
Events / GeV
5 10 15 20 25 30 35 40
45 Data
Single lepton t
t Dilepton t t Single top W+jets Multijet Z+jets Diboson ATLASPreliminary
+jets = 8 TeV, µ s
-1, 20.3 fb
[GeV]
miss
ET
0 50 100 150 200 250 300 350 400 450 500
Data / MC 0.5
1 1.5
(f) µ+jets
Figure 1: Distributions of p
Tof the lepton candidates (top), p
Tof selected small-R jets (middle) and
missing E
T(bottom). The distributions for the e
+jets and µ+jets channels are shown on the left andright figures, respectively. The t¯ t prediction is obtained using the nominal P
+P
sample. The
ratio of data and MC prediction is shown in the insets below the plots. The hashed area includes all
the object-related uncertainties (on the jet, lepton and E
Tmiss) and the uncertainties from the background
estimation and MC statistics. The vertical lines indicate the data statistical uncertainty.
Events / 1.0
500 1000 1500 2000 2500 3000 Data
Single lepton t
t Dilepton t t Single top W+jets
Multijet Z+jets Diboson
ATLASPreliminary = 8 TeV s
-1, 20.3 fb
e+jets
top-jet candidate η -2 -1.5 -1 -0.5 0 0.5 1 1.5 2
Data / MC 0.5
1 1.5
(a) e+jets
Events / 1.0
500 1000 1500 2000 2500 3000
Data Single lepton t
t Dilepton t t Single top W+jets
Multijet Z+jets Diboson
ATLASPreliminary = 8 TeV s
-1, 20.3 fb
+jets µ
top-jet candidate η -2 -1.5 -1 -0.5 0 0.5 1 1.5 2
Data / MC 0.5
1 1.5
(b) µ+jets
100 150 200 250 300 350 400
Events / GeV
20 40 60 80
100 Data
Single lepton t
t Dilepton t t Single top W+jets Multijet Z+jets Diboson ATLASPreliminary
= 8 TeV, e+jets s
-1, 20.3 fb
top-jet candidate mass [GeV]
100 150 200 250 300 350 400
Data / MC 0.5
1 1.5
(c) e+jets
100 150 200 250 300 350 400
Events / GeV
10 20 30 40 50 60 70 80
90 Data
Single lepton t
t Dilepton t t Single top W+jets Multijet Z+jets Diboson ATLASPreliminary
+jets = 8 TeV, µ s
-1, 20.3 fb
top-jet candidate mass [GeV]
100 150 200 250 300 350 400
Data / MC 0.5
1 1.5
(d) µ+jets
300 400 500 600 700 800 900 1000 1100 1200
Events / GeV
10-2
10-1
1 10 102
103
104 Data
Single lepton t
t Dilepton t t Single top W+jets Multijet Z+jets Diboson ATLASPreliminary
= 8 TeV, e+jets s
-1, 20.3 fb
[GeV]
top-jet candidate pT
300 400 500 600 700 800 900 1000 1100 1200
Data / MC 0.5
1 1.5
(e) e+jets
300 400 500 600 700 800 900 1000 1100 1200
Events / GeV
10-2
10-1
1 10 102
103
104 Data
Single lepton t
t Dilepton t t Single top W+jets Multijet Z+jets Diboson ATLASPreliminary
+jets = 8 TeV, µ s
-1, 20.3 fb
[GeV]
top-jet candidate pT
300 400 500 600 700 800 900 1000 1100 1200
Data / MC 0.5
1 1.5
(f) µ+jets
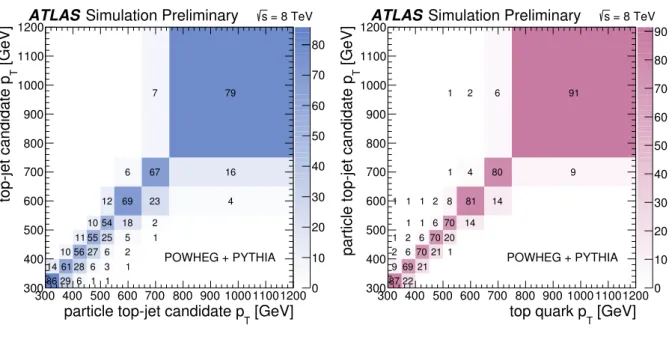
Figure 2: Distributions of
η(top), mass (middle) and p
T(bottom) of the leading selected anti-k
tR
=1.0jets. The distributions for the e
+jets andµ+jets channels are shown on the left and right figures, respec-tively. The t¯ t prediction is obtained using the nominal P
+P
sample. The ratio of data and
MC prediction is shown in the insets below the plots. The hashed area includes all the object-related
uncertainties (on the jet, lepton and E
Tmiss) and the uncertainties from the background estimation and MC
statistics. The vertical lines indicate the data statistical uncertainty.
9.2 Particle-level, parton-level and fiducial region definitions
Particle-level corrections to the data are derived using leptons and jets from simulated t¯ t events that are constructed using particles, with a mean lifetime greater
5than 0.3
×10
−10s, that are directly resulting from pp interactions or from subsequent decays of particles with a shorter mean lifetime.
To define the lepton of the particle-level selection, all leptons (e,
µ,νe,ν
µ,
ντ) from hadron decays are discarded. The (e,
µ,) leptons fromτ-lepton decays are accepted only if the parentτlepton is not a hadron decay product itself. The four-momenta of photons within a cone of
∆R
=0.1 around the electron and muon direction are added to those of the leptons.
Both small-R and large-R jets are reconstructed using all particles except for leptons as selected above (i.e. muons and neutrinos from hadron decays are included in jets) and for any photons associated with the selected electrons or muons. The trimming procedure applied to detector-level jets described in Sec. 5 is also applied to particle-level jets, considering all of their particle-level constituents.
An R
=0.4 jet withp
T >25 GeV and
|η| <2.5 is considered to be “b-tagged” (i.e. initiated by a b-quark) if there exists at least one B-hadron with p
T >5 GeV which is clustered in the jet
6.
The missing transverse momentum magnitude E
missTis calculated from the four-momentum sum of neutrinos not resulting from hadron decays.
Aiming at minimizing the theoretical input to the measurement, the fiducial region is chosen to follow the detector-level event selections closely, including the kinematic requirements on the objects and the requirements on the event topology. In contrast to the detector-level selection, no overlap removal procedure is applied for leptons and jets, as described in Sec. 5 and no isolation requirement is imposed on leptons. Using the particle-level objects defined above, the fiducial region is defined as:
•
exactly one lepton (electron or muon) with p
T >25 GeV,
|η|<2.5.•
E
missT >20 GeV and E
missT +m
WT >60 GeV.
•
at least one R
=0.4 anti-ktjet with p
T >25 GeV and
|η|<2.5 and within
∆R
<1.5 from the lepton.If there is more than one such jet, the one with the largest p
Tis considered to be the leptonic b-jet candidate.
•
at least one R
=1.0 trimmed anti-k
tjet with p
T>300 GeV, mass
>100 GeV,
√d
12 >40 GeV and
|η|<
2, well separated from both the lepton (∆
φ >2.3) and the leptonic b-jet candidate (∆ R
>1.5).
The jet mass is reconstructed from the four-vector sum of the particles constituting the jet. If more than one large-R jet satisfy these criteria, the one with largest p
Tis chosen. The jet passing this selection is referred to as the particle-level top-jet candidate.
•
at least one b-tagged small-R jet such that
∆R(jet
R=1.0,jet
R=0.4)
<1 and
/or the leptonic b-jet can- didate is b-tagged.
The particle-level event selection is summarized in Tab. 1. Fiducial particle-level corrections are deter- mined by using only simulated t¯ t events for which exactly one of the W bosons, resulting from the decay of the t¯ t pair, decays to an electron or a muon either directly or through a
τlepton decay. All other t¯ t events, classified as background in Sec. 6, are not used for this purpose. The cross-section is then mea- sured as a function of the particle-level top-jet candidate as defined above and its transverse momentum is called p
T,ptcl.
For the parton-level, the top quark that decays to a hadronically decaying W boson is considered just before the decay and after QCD radiation, selecting events for which the momentum of such a top
5With this definition charged pions are considered stable and used to build jets.
6TheB-hadrons are not stable and will not contribute to the total four-vector of the jet, only their decay products will.
However they are clustered with their energy set to a negligible value to check that they match the jet geometrically [56].
quark, p
T,parton, is larger than 300 GeV. Parton-level corrections are determined by using only simulated t¯ t events for which exactly one of the W boson decays to an electron or a muon or a
τlepton (including hadronic
τdecays). The correction to the full phase partonic phase space defined above is obtained by accounting for the branching ratio of t¯ t to the
`+jets channel.9.3 Unfolding to particle- and parton-level
The procedure to unfold the distribution of p
T,reco, the p
Tof the detector-level leading trimmed large-R jet, to obtain the di
fferential cross-section as a function of p
T,ptclis comprised of several steps, outlined in:
dσ
tt¯d p
iT,ptcl =N
ptcli∆
X
iL =1
∆
X
iLf
ptcl!recoi Xj