ATLAS-CONF-2014-059 02October2014
ATLAS NOTE
ATLAS-CONF-2014-059
October 2, 2014
Differential top–antitop production cross-section measurements in pp collisions at √
s = 7 TeV as a function of pseudo-top-quark observables in the single-lepton channel using the ATLAS
detector
The ATLAS Collaboration
Abstract
The differential top-quark pair production cross-section is presented in terms of a top-quark proxy observable referred to as the pseudo-top-quark whose dependence on theoretical models is minimal. The pseudo-top-quark observable is defined both in terms of reconstructed objects and stable particles. The measurements are per- formed on
tt¯events in the lepton+jets channel, requiring exactly one lepton and at least four jets with at least two of them tagged as originating from a
b-quark. Themeasurements are performed for hadronic and leptonic pseudo-top-quarks, defined by the
Wboson decays, in the single lepton channel and as a combination of lepton channels. The dataset corresponds to an integrated luminosity of 4.6 fb
−1of proton- proton collisions at
√s= 7
TeV collected by the ATLAS detector at the LHC. The production cross-section is measured as a function of the transverse momentum and rapidity of the hadronic or leptonic pseudo-top-quark as well as the transverse mo- mentum, rapidity and invariant mass of the pseudo-top-quark pair system. The mea- surements are shown after corrections for detector effects and are presented within a kinematic range that closely matches the detector acceptance. Differential cross- section measurements of the pseudo-top-quark variables are compared with several current Monte Carlo models that implement next-to-leading order or leading order multi-leg matrix element calculations.
c
Copyright 2014 CERN for the benefit of the ATLAS Collaboration.
Reproduction of this article or parts of it is allowed as specified in the CC-BY-3.0 license.
1 Introduction
The large number of top quark pair (t¯
t) events produced at the Large Hadron Collider (LHC)has allowed the ATLAS [1] and CMS [2] experiments to perform precision inclusive and dif- ferential cross-section measurements. Both experiments have published measurements of the inclusive
t¯tproduction cross-section in proton-proton (pp) collisions at centre-of-mass energies,
√s, of 7 and 8 TeV [3–7] as well as differential cross-section measurements as a function of the
top-quark transverse momentum (
pT), rapidity (y) and the mass (m
tt¯) and
yof the
tt¯system [8–10]. Precision measurements of
t¯tproduction provide the opportunity to conduct tests of current predictions based on perturbative Quantum Chromodynamics (QCD) and gain direct information on the gluon parton distribution function (PDF) at large momentum fraction [11].
These will lead to improvements in background predictions for Higgs measurements and searches for physics beyond the Standard Model (SM).
This note presents differential
tt¯cross-section measurements using a new definition where the differential variables are constructed from objects that are directly related to detector-level observables. The goal of presenting measurements using these variables is twofold: (i) avoid large extrapolations and minimise model-dependent corrections and (ii) provide information on perturbative QCD (pQCD) at the top-quark scale in an environment where the initial top- quarks do not hadronise. To satisfy these goals, this note presents
tt¯cross-section results in terms of a top-quark proxy observable referred to as the “pseudo-top-quark”. The pseudo-top- quark described in this note is constructed from jets, leptons and missing transverse momentum (E
Tmiss) objects. These objects can be extracted from detector information, or from particles generated after hadronisation by Monte Carlo (MC) simulations. The resulting differential
tt¯cross-sections are obtained from the kinematics of the hadronic or leptonic pseudo-top-quark,
t, at the particle-level (at the truth level in the case of MC simulations, or from reconstructedobjects). The differential cross-sections are measured as a function of the transverse momentum
pT(t)and rapidity
y(t)as well as the transverse momentum
pT(tt), rapidity y(tt)and invariant mass
m(tt)of the pseudo-top-quark pair system,
tt.The operational definition of the pseudo-top-quark includes only the stable particles mea- sured by the ATLAS detector, or inferred from a measurement of
ETmiss. This approach has the advantage that extrapolations using MC models over regions of phase space not measured by the detector are avoided, and the corrections depend less on phenomenological MC models that describe parton shower effects, hadronisation and multi-parton interactions. In particular, at low top-quark
pT, such effects can significantly modify the kinematics of the top-quark pair system.
In the SM, a top-quark decays to a
Wboson and a
b-quark with a branching fraction closeto unity. Experimentally, there are three
t¯tsignatures that correspond to different decay modes
of the
Wbosons. The signal for this study is the single lepton channel. It corresponds to the
case where one
Wboson decays directly or via an intermediate
τdecay into an electron or muon
and at least one neutrino, and the other into a pair of quarks. Such a
t¯tevent is expected
to contain one energetic lepton,
ETmissassociated with a neutrino and at least four jets. The
presence of jets that are associated with
b-hadron decays (b-jets) can be used to reduce SMbackground processes due to the small fraction of heavy flavour jets expected in them. Thus the
most important background to the analysis is the
tt¯di-lepton channel where the
Wboson from
each of the top-quarks decays into an electron or a muon. In this case, a mis-identification of
mainly the electron results in faking the signal process. Other important backgrounds include
single-top-quark production and
Wproduction in association with jets (including
c-quark and b-quark jets).This note is structured as follows. The definition of the pseudo-top-quark together with the particle-level objects are presented in Section 2. A description of the different MC samples featured in the study is found in Section 3. Section 4 provides a short overview of the ATLAS detector. The data and MC event selection is described in Section 5 together with the recon- struction of final state objects. Section 6 covers the treatment and evaluation of systematic uncertainties. Comparisons between data and MC, for the yields and pseudo-top-quark distri- butions before unfolding, are presented in Section 7. A description of the unfolding, the results obtained for data and various MC models and concluding remarks are found in Sections 8, 9 and 10, respectively.
2 Measurement definition
The measurements presented in this note can be compared to MC simulations using matrix element calculations that are interfaced with parton shower and hadronisation models. They are referred to as particle-level predictions. The measurements are defined using descriptions for electron, muon, jet and
EmissTparticle objects, and a pseudo-top-quark algorithm. These description were developed in the context of the TOP Physics LHC Working Group.
Particle objects
Leptons and jets are defined using particles with a mean lifetime
τ > 3× 10⁻¹¹s, directly produced in
ppinteractions or from subsequent decays of particles with a shorter lifetime. Only prompt electrons, muons and neutrinos, not originating from hadrons, are selected. Electron and muon four-vectors are calculated after the addition of any photon four-vectors, not originating from hadron decay, within
∆R = p(∆φ)2+(∆η)2 = 0.1
of their original directions
1associated with the lepton. The
EmissTand associated azimuthal angle is taken from the sum of the neutrino four-vectors, where all neutrinos from
Wboson and
τdecays are included. Jets are defined by the anti-k
talgorithm [12] and a radius parameter of 0.4. The jets include all stable particles except for the selected electrons, muons and neutrinos and any photons within
∆R = 0.1of the selected electrons or muons. The presence of one or more
b-hadrons with
pT >5GeV that are within a jet defines it as a
b-jet. To perform the associationbetween
b-hadrons and jets, theb-hadron energy is scaled to a small value and included withinthe jet clustering [13].
Kinematic range
Electrons, muons and jets are required to have
pT >25GeV and
|η|< 2.5.Events where the electron or muon is within
∆R =0.4of a jet, or two jets are within
∆R= 0.5of each other, are discarded. The fiducial volume was defined by requiring exactly one muon or electron, four or more jets of which at least two are
b-jets, a EmissT >30GeV and a transverse
Wmass
2 mT(W)>35GeV.
Pseudo-top-quark
The pseudo-top-quark is presented in this note as a hadronic and leptonic observable, defined by the decay products of the
Wboson. In the present cross-section definition, the two highest
pTb-jets are assumed to be theb-jets from the top-quark decay. The hadronicW1ATLAS uses a right-handed co-ordinate system with its origin at the nominal interaction point (IP) in the centre of the detector and the z-axis along the beam pipe. The x-axis points from the IP to the centre of the LHC ring, and the y-axis points upward. Cylindrical coordinates(r, φ) are used in the transverse plane, φ being the azimuthal angle around the beam pipe. The pseudorapidity is defined in terms of the polar angleθas η=−ln tan(θ/2).
2mT(W) is defined as q
2pℓTpνT(1−cos(φℓ−φν)), where ℓ and ν refer to the charged lepton (e or µ) and EmissT respectively.
boson is constructed from the remaining two highest
pTjets. The
b-jet with the smallest angularseparation from the electron (muon) is assigned as a decay product of the leptonic pseudo-top- quark. The hadronic pseudo-top-quark is defined from the hadronic
Wboson candidate and the remaining
b-jet. The leptonic Wboson is constructed from the electron (muon) and the
EmissT. Using the world average
Wboson mass [14] and the
ETmiss( associated with the W decay neutrino), the
pzof the neutrino can be constrained:
(Eℓ+Eν)2−(px,ℓ+ px,ν)2−(py,ℓ+ py,ν)2−(pz,ℓ+pz,ν)2=m2W
where the subscript
ℓrefers to the electron or muon and
mWis the
Wboson mass. Assuming massless neutrinos, the
pz,νof the neutrino is taken from the solution of the resulting quadratic equation.
pz,ν = −b± √
b2−4ac 2a
where
a=E2ℓ− p2z,ℓ b=−2k pz,ℓ c=E2ℓp2T,ν−k2
and
k= m2W−m2ℓ
2 +pT,ℓ·pT,ν
If both solutions are real, the solution with the smallest magnitude of
pzis chosen. In cases where
(b2−4ac)is less than zero, the neutrino
pzis taken as:
pz,ν =− b 2a
Given the value of
pz,ν, the leptonic pseudo-top-quark is formed from the combination of the leptonic
Wboson and the assigned
b-jet. The observables extracted from the pseudo-top-quarkfour vectors are used in the measurement to define, for example, the
pT, the rapidity and the mass.
The three different definitions are referred to in the following sections.
•
A parton-level top-quark is the truth-level top-quark selected before it decays but after any radiative emissions.
•
A particle-level pseudo-top (hadronic and leptonic) is defined by stable truth-level particles within the described acceptance.
•
A reconstructed psuedo-top (hadronic and leptonic) is evaluated with the use of reconstructed- level objects measured in the detector.
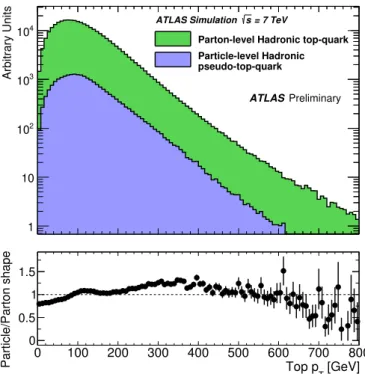
Figure 1 compares the parton-level
pTdistribution of the top-quark with the particle-level
pTdistribution of the pseudo-top-quark. The two distributions are evaluated for the same
integrated luminosity, using the powheg+pythia Monte Carlo generator (section 3). Firstly
the effect of the detector acceptance at the particle-level can be inferred from the difference
between the number of top-quarks defined at the parton-level and particle-level. The ratio
of the normalised distributions illustrates the shape difference. The larger phase space of the
parton-level distribution results in a softer
pTdistribution when compared with the pseudo-
top-quark distribution where fiducial cuts are applied. In addition, with increasing
pT, the
decay products tend to be more localised due to their large boost and this also contributes to a
difference between the two shapes.
Arbitrary Units
1 10 102
103
104
Parton-level Hadronic top-quark pseudo-top-quark
Particle-level Hadronic = 7 TeV s ATLAS Simulation
Preliminary ATLAS
[GeV]
Top pT
0 100 200 300 400 500 600 700 800
Particle/Parton shape
0 0.5 1 1.5
Figure 1: Monte Carlo study showing the parton-level hadronic top-quark
pTdistribution (green), and the truth particle-level hadronic pseudo-top-quark
pTdistribution (blue) within the fiducial region. The distributions are evaluated for the same fixed integrated luminosity.
The ratio shown in the lower plot is evaluated using normalised distributions to emphasise the difference in shape between the two distributions.
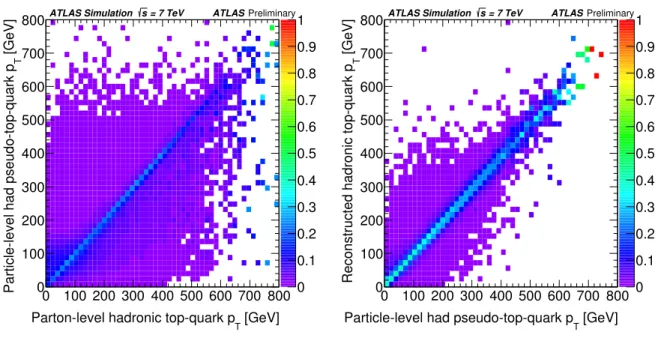
Using the same Monte Carlo sample, Figure 2 (a) shows the correlation between the parton- level truth
pTdistribution and the evaluated particle-level hadronic pseudo-top-quark
pT. De- spite the strong correlation, there remains a significant bin migration in the region populated by the majority of top-quarks. The correlation is significantly enhanced if the hadronic pseudo-top- quark
pTis compared to the
pTof the top-quark determined from reconstructed objects as shown in Figure 2 (b). Nevertheless the kinematics of the pseudo-top-quark are still well correlated to the one from the top-parton as demonstrated in Figure 2 (a). They will be further affected by a change in the modelling of
t¯tproduction thus making any measurement extrapolated to the parton-level model-dependent.
3 Monte Carlo simulation
Monte Carlo simulation samples were generated to correct the measurements for detector effects
and to compare with the corresponding fully corrected distributions in data. The production of
tt¯events was modelled using the powheg [15], mc@nlo [16] and alpgen [17] generators, where the
powheg and mc@nlo use next-to-leading order (NLO) matrix element calculations interfaced
with parton showers and alpgen implements a leading order (LO) multi-leg calculation for up
to five additional partons, which are subsequently matched to parton showers [18]. A common
feature between the samples, unless stated otherwise, is the generation of the underlying event
and parton shower which is either performed by pythia (v6.425) [19] or by herwig (v6.520) [20]
[GeV]
Parton-level hadronic top-quark pT
0 100 200 300 400 500 600 700 800 [GeV] TParticle-level had pseudo-top-quark p 0
100 200 300 400 500 600 700 800
0 0.1 0.2 0.3 0.4 0.5 0.6 0.7 0.8 0.9
= 7 TeV 1
s
ATLAS Simulation ATLASPreliminary
(a)
[GeV]
Particle-level had pseudo-top-quark pT
0 100 200 300 400 500 600 700 800 [GeV] TReconstructed hadronic top-quark p
0 100 200 300 400 500 600 700 800
0 0.1 0.2 0.3 0.4 0.5 0.6 0.7 0.8 0.9
= 7 TeV 1
s
ATLAS Simulation ATLASPreliminary
(b)
Figure 2: (a) Monte Carlo study showing the correlation between the parton-level top-quark
pTand the truth particle-level hadronic pseudo-top-quark
pT. (b) Monte Carlo study showing the correlation between the truth particle-level hadronic pseudo-top-quark
pTand the hadronic pseudo-top-quark
pTevaluated from reconstructed objects. In each case the correlation has been normalised to all the events within a horizontal bin.
together with jimmy (v4.31) [21].
A nominal powheg sample was generated using the version powheg -hvq p4 [22], with the ct10nlo PDF [23] and their default factorisation and renormalisation scales. The powheg matrix-element calculation was interfaced with pythia, using the “C” variant of the Peru- gia 2011 tunes [24] and the corresponding cteq6l1 PDF [25]. This sample is referred to as
“powheg+pythia”in the text. An additional powheg sample was generated for the comparison of parton shower and fragmentation models. It was interfaced with herwig together with jimmy for the multiple-parton interaction model using the AUET2 tune [26] (“ powheg + herwig ”). To evaluate the importance of the gluon PDF on the final corrected distributions, an alternative powheg sample was produced with the herapdf15nlo PDF [27] (“powheg(HERA)+pythia”).
This PDF set is based on HERA I data together with the inclusion of the precise high
Q2prelimi- nary HERA II data and is in good agreement with early
Wand
Zboson production measurements at the LHC [28].
To compare the powheg predictions, alternative samples were generated with mc@nlo (v4.01) with the ct10nlo PDF set and its default renormalisation and factorisation scales.
mc@nlo was interfaced to herwig and jimmy, using the AUET2 tune (“mc@nlo+herwig”).
Both powheg and mc@nlo include leading logarithmic (LL) predictions for two or more addi-
tional partons. To assess the importance of matrix element calculations for additional partons
and test multi-leg models for inclusive spectra, the alpgen [17] generator (v2.13) was used
together with the cteq6l1 PDF and associated strong coupling constant,
αS(mZ)=0.129. Theproduced processes correspond to the LO matrix-elements for
tt¯with zero to four exclusive and
five inclusive associated partons and
tt¯+bb¯and
tt¯+c¯cstates at its default renormalisation and
factorisation scale. The alpgen samples were interfaced with herwig and jimmy, using the
MLM parton-jet matching scheme [17] with a matching scale of 20 GeV. The exclusive heavy- flavour samples were combined with the inclusive samples, after the removal of overlapping events (“ alpgen + herwig ”) .
Both the NLO and LO multi-leg MC models have higher-order correction uncertainties that can be expressed in terms of initial-state radiation (ISR) and final-state radiation (FSR) vari- ations. alpgen (v2.14) was used to generate
tt¯samples with the cteq5l PDF [29] and the pythia parton shower. Nominal and shifted ISR/FSR samples were produced using a nominal value
αS(mZ)=0.129and modified with a change of the renormalisation scale by a factor of 2.0 (0.5) for the higher (lower) values. The
αSwas varied by the same factor in the matrix-element calculation and pythia, where the pythia “Perugia 2011 radHi” and “Perugia 2011 radLo” were used. These samples are referred to as “alpgen+pythia(α
SUp)” and “alpgen+pythia(α
SDown)” in the discussion that follows. The selected
αSvalues were found to produce variations that are similar to the uncertainty band of the
tt¯additional jet-veto variables
f(Q0)and
f(Qsum)described in Ref. [30].
The effect of colour reconnection was estimated by generating a powheg+pythia sample in which no colour reconnection was allowed within pythia , using the “noCR” Perugia 2011 tune [24].
The
t¯tcross-section for
ppcollisions at
√s= 7 TeVwas calculated to be
σt¯t = 177+−1011pb for
mt = 172.5GeV. This calculation was carried out at next-to-next-to-leading order (NNLO) in QCD including resummation of next-to-next-to-leading logarithmic (NNLL) soft gluon terms [31–
36] with top++ (v2.0) [37]. All
t¯t-MC samples were generated with mt = 172.5GeV and were normalised to the theoretical NNLO+NNLL cross-section prediction.
For the simulation of background processes, samples of
Wand
Zbosons with zero to four exclusive and five inclusive associated partons were generated with alpgen (v2.13), cteq6l1 PDF and the herwig parton shower. In addition to the inclusive jet-flavour processes, separate samples of
Wbb¯+jets,Wcc¯+jets,Wc+jetsand
Zbb¯+jetsmatrix-element processes were generated and the overlap between them removed. The normalisation of the
W+jetssamples were determined from data as described in section 5.3. The
Z+jetssamples were normalised to the cross-section obtained from a NLO calculation with mcfm [38] using the mstw2008nlo PDF.
A sample of
t-channel single top-quark decays was generated using theacermc generator [39]
(v3.8), whereas mc@nlo was used to generate
Wt-channel ands-channel processes. Each of thesesamples were normalised according to an approximate NNLO calculation for the
t[40],
s[41] and
Wtchannels [42]. Diboson events (WW,
WZ, ZZ) were produced usingherwig and normalised to the cross-section obtained from a NLO calculation with mcfm using the mstw2008nlo PDF.
To properly simulate the LHC environment, additional inelastic
ppinteractions were gener- ated with pythia using the AMBT1 tune and then overlaid on top of the hard-processes. The MC events were weighted such that the distribution of generated mean number of
ppcollisions (
hµi) matched that of the data-taking period. The particles from additional interactions were added before the detector simulation, but were not used within the particle-level measurement definition described in section 2.
The response of the detector to the generated events was determined by a full geant4 [43]
simulation of the ATLAS detector [44]. This was performed for all samples except for the ISR/FSR variations, colour reconnection and powheg+herwig MC samples. For those samples a faster simulation which parametrises the ATLAS calorimeter response was used instead [44].
To allow a comparison, nominal samples matching the variations also used this parametrised
calorimeter simulation.
4 The ATLAS detector
The ATLAS detector [1] is a general purpose detector that covers nearly the entire solid angle around one of the
ppinteraction points of the LHC [45]. It is composed of an inner tracking de- tector (ID), covering a range of
|η|<2.5, surrounded by a superconducting solenoid that providesa 2 T magnetic field, high granularity electromagnetic (EM) and hadronic sampling calorimeters and a muon spectrometer (MS) that incorporates a system of air-core superconducting toroid magnets. The ID comprises a silicon pixel detector, a silicon microstrip detector (SCT), and a transition radiation tracker (TRT). The EM calorimeter is composed of a liquid-argon (LAr) active medium and lead absorbers. The hadronic calorimeter is constructed from iron absorber and scintillating tiles in the central pseudorapidity range of
|η| < 1.7, whereas the end-cap andforward regions are instrumented with LAr calorimeters for both electromagnetic and hadronic energy measurements up to
|η|=4.9. The MS toroid magnets are arranged with an eight-fold az-imuthal coil symmetry around the calorimeters. Three stations of muon spectrometer chambers consisting of high precision drift tubes and fast thin gap and resistive plate chambers provide respectively a muon momentum measurement and a muon trigger.
Data are selected from inclusive
ppinteractions using a three-level trigger system. A hardware-based first-level trigger is used to initially reduce the trigger rate to approximately 75 kHz. The detector readout is then available for two stages of software-based (higher-level) triggers. In the second level, partial object reconstruction is carried out to improve the selection and at the last level, the event filter, a full online event reconstruction is made to finalise the event selection. During the 2011 run period, the selected event rate for all triggers following the event filter was approximately 300 Hz.
5 Data sample and event selection
Data were selected from the full 2011 data-taking period during which the ATLAS sub-detector systems were fully operational. The resulting data set corresponds to an integrated luminosity of
4.59±0.08fb
−1[46]. During this data-taking period, the LHC delivered an instantaneous luminosity that was sufficiently high to produce several
ppinteractions within the same bunch crossing (in-time pileup). Interactions in adjacent bunch crossings also influenced the detector and readout signals in the selected bunch crossing. The mean number of in-time pileup inter- actions,
hµi, was measured by averaging over all
ppbunch crossings. The average value of
hµiwas approximately five at the beginning of the data-taking period and as high as eighteen by the end of the 2011 run.
5.1 Object reconstruction
Primary vertices were formed from tracks reconstructed in the ID. The selected primary vertex was required to include at least five reconstructed tracks satisfying
pT > 0.5GeV and to be consistent with the
ppbeam-collision region in the transverse plane. In the cases where more than one primary vertex with at least five tracks were reconstructed, the vertex with the highest
Pp2Twas chosen and assumed to be associated with the hard-process.
Electron candidates were identified as electromagnetic energy deposits (clusters) matched to
a reconstructed track in the ID [47]. Selected electrons were required to pass tight identification
criteria, using the track information and calorimeter shower-shape variables. To reduce the
residual acceptance of multijet-background events, electrons were required to be isolated within
both the calorimeter and ID. The calorimeter isolation was defined using a cone of radius
∆R=0.2around the electron direction. The transverse energy sum of the clusters found in the cone was
calculated and required to be less than 10% of the electron transverse energy, after excluding the cells associated with the electron cluster and correcting for leakage from the electron cluster.
The track-based isolation was calculated using the summed track-
pTwithin a
∆R = 0.3cone around the electron direction and was required to be less than 10% of the electron track
pT. Electrons were selected in the range
|η|<2.47, excluding the barrel/end-cap transition region of 1.37<|η|<1.52. The electron channel event selection required the reconstruction of one electronwith
pT >25GeV associated to the selected primary vertex. Electrons with
pT >15GeV were used within the object overlap removal discussed later in this section and to remove events with two or more leptons as discussed in section 5.2.
Muon candidates were required to be composed of a reconstructed track in the MS combined with a track in the ID [48]. Track quality criteria were used to reduce the multijet-background and select a sample with improved
pTresolution. Reconstructed tracks were required to have a hit in the innermost pixel layer if expected from the track trajectory, at least one pixel hit if expected, at least six SCT hits if expected and no more than two missing hits along the track trajectory within the pixel and SCT detector subsystems. Muons crossing the TRT were required to have a hit pattern consistent with a well-reconstructed track.
To further reduce the multijet background, muons were required to be isolated within the calorimeter and ID. The calorimeter isolation was determined using a
∆R=0.2cone around the direction of the muon and was required to be less than 4 GeV. The ID isolation was determined with a
∆R=0.3one around the direction of the muon and was required to be less than 2.5 GeV.
The muon channel event selection required the reconstruction of one muon with
pT > 25GeV associated to the selected primary vertex. Muons with
pT > 15GeV were used to define an additional lepton veto discussed in section 5.2. Both types of muons were selected within
|η|<2.5.Topological clusters [49] were formed from calorimeter energy deposits. Jets were recon- structed from these clusters by using the anti-k
talgorithm [12] and a radius parameter of 0.4.
The jets were calibrated using the EM+JES scheme described in [50] to correct for energy losses due non-compensation in the calorimeter, un-instrumented material and detector sub-systems in front of the calorimeter. The jet energy was corrected for the effect of additional
ppcollisions in MC and data. The energy of the jet required further corrections whose applied factors depended on the energy and
ηof the jet with the aim to match the energy of jets of MC particles with
τ >0.3×10⁻¹⁰
s, after the exclusion of neutrinos and muons. Differences between data and MC
simulations were evaluated [51], using the
pTbalance between high-p
Tjets and well measured physics objects, in events with a
Zboson or a photon and a recoiling jet. The calibrated jets were required to satisfy
pT > 25GeV and be within the range
|η| < 2.5. Jets associated withlarge energy deposits from additional
ppinteractions were removed by requiring that the
pTsum of the reconstructed tracks matched with the jet and the selected primary vertex was at least 75% of the total
pTsum of all tracks associated to the jet. This quantity is referred to as the jet vertex fraction (JVF). Jets satisfying
pT>50GeV were always accepted and jets having no associated tracks were also accepted.
The MV1 algorithm [52] was used to select jets associated with
b-hadron decays. Thealgorithm combines several tagging algorithms into a single neural-network-based discriminant.
Jets were identified as
b-jets by using a MV1 discriminant requirement relating to a 70% taggingefficiency for jets with
pT > 20GeV in simulated
tt¯events. The corresponding rejection factor for jets originating from light-quarks or gluons was found to be approximately 130.
The azimuthal angle and magnitude of
ETmisswere reconstructed from the vector sum of the transverse momenta of the reconstructed objects (electrons, muons, jets) as well as the transverse energy deposited in calorimeter cells not associated with these objects, within the range
|η|<4.9.The object classification scheme for the electrons, muons and jets used to calculate
EmissTwas
chosen to be the same as the object definitions used in this analysis. Calorimeter cells not associated with an object were calibrated at the electromagnetic scale before being added to
EmissT. This calibration scheme is similar to the one described in Ref. [53].
Electron and jet objects were reconstructed using separate algorithms that were run in- dependently. Jets were reconstructed from topological clusters as described above, with no distinction made between identified electron and jet energy deposits within the electromagnetic and hadronic calorimeters. Jets associated with an electron energy deposit were discarded using angular matching. For each electron, the jet with an axis closest to that of the electron axis, within the range
∆R<0.2, was discarded. To remove muons from heavy-flavour decays, muonswere discarded if the muon was found to be within the range
∆R<0.4of a jet axis, where any jet with JVF greater than 0.75 was considered. To perform a similar isolation requirement for electrons, any electron within the range
∆R<0.4of a selected jet axis was discarded, where only the jets not associated with electron energy deposits were considered.
5.2 Event selection
Data were collected by requiring either a high-
pTelectron trigger, based on calorimeter energy deposits, shower shape and track quality constraints, or a high-p
Tmuon trigger that included a reconstructed track in the MS matched with a track in the ID. The electron trigger
pTthreshold was either 20 GeV or 22 GeV, depending on the data-taking period, whereas the muon trigger
pT
threshold remained at 18 GeV for the duration of the data taking.
The selected events were required to contain at least one reconstructed primary vertex. A small number of events were rejected that included one or more jets of
pT>20GeV with energy that was identified as being from noise in the calorimeter electronics, from non-pp collision background sources or cosmic-ray showers. Events where an identified electron and muon shared the same reconstructed track in the ID were also removed.
Events were classified in the electron (muon) channel by the presence of one electron (muon) with
pT > 25GeV, no additional electron or muon with
pT > 15GeV and at least four recon- structed jets with
pT > 25GeV and
|η| < 2.5where at least two were identified as
b-jets. Toreduce the multijet background,
ETmiss > 30GeV and
mT(W) > 30GeV were also required. To reduce the effects of jet merging and migrations within the jet
pTordering with respect to the jets described in section 2, events with a pair of reconstructed jets within
∆R<0.5were vetoed.
5.3 Estimation of backgrounds
The dilepton
tt¯final states constitute the most important background to this analysis, followed by single top quark production,
Wboson production in association with jets (including charm and bottom quarks) and multijet production (excluding top-quarks). In comparison,
Z+jetsand diboson production processes constitute very small background components.
The powheg+pythia MC generator was used to generate single-lepton and di-lepton
t¯tdecays. The fraction of dilepton events that remained after applying the full event selection was removed from the data, as a bin-by-bin correction factor on the data (see section 8). Contri- butions from single top quark,
Z+jetsand diboson (WW,
WZ, ZZ) production were evaluatedusing corresponding MC samples and theoretical cross-sections for these processes, as discussed in section 3.
The overall normalisation of the
W+jetsMC sample was determined in the data via a lepton
charge asymmetry measurement described in Ref. [8]. The production of
Wbosons at the LHC
is charge-asymmetric, due to valence and sea quark distributions for protons. Most of the other
background processes result in lepton charge distributions that are symmetric. The numbers of
events with positive and negatively charged leptons were measured in the data and are referred to as
Nℓ+and
Nℓ−, respectively. A MC simulation was used to estimate the charge asymmetric single top quark background and to subtract that from the values of
Nℓ+and
Nℓ−. The
W+jetsnormalisation was then extracted from:
NW++NW− = rMC+1
rMC−1(Nℓ+−Nℓ−)
(1)
where
rMC≡ σ(ppσ(pp→→WW+−))is determined in MC for the signal region kinematic cuts and
NW+(N
W−) is the number of
W+(W
−) events. The
W+jetsnormalisation was determined using the event selection of this analysis, but without the
b-tagging requirement. The values of (NW++NW−) were independently determined for
W+4jet and
W+≥5jet events. The normalisation was separately obtained for each of the MC systematic uncertainty evaluations listed in section 6.
The normalisation of the heavy-flavour fractions within the
W+jetssample was determined by measuring the number of
W+2jet events, without a
b-tagging requirement and with therequirement of at least one
b-tag. To make this measurement, the charge asymmetry techniquedescribed above was applied to both sets of selected events. The number of events that have one or more
b-tag is related to the number of events before the b-tagging requirement, the b-tagging probability and the flavour fractions in the
W+jetssample. The simulated heavy-flavour fractions (Wb
b¯+jets,Wcc¯+jetsand
Wc+jets) were determined with the fractionWcc/Wb¯ b¯taken from simulation. The process used the number of events after requiring at least one
b-tag wherethe overall normalisation of
W+jetsevents was fixed using the values previously determined using the charge asymmetry method. The heavy-flavour fractions were then extrapolated from the
W+2jet selection to
W+≥5jet events using the heavy-flavour fractions of the MC simulation.
Multijet production processes have a large cross-section and can be accepted as signal events due to material interactions, electromagnetic shower fluctuations and heavy-flavour decays. In the electron channel, jets and electrons from photon conversions can mimic an isolated electron from a
Wboson decay. In the muon channel, the background is dominated by the decay of heavy- flavour hadrons to muons. A matrix method [54] was implemented in the electron channel, by defining a sample without an isolation requirement and with a looser electron identification selection. The fraction of background events was normalised using events satisfying
ETmiss <20
GeV. The multijet background in the muon channel was determined using two separate matrix methods: a low
mT(W)background region and a background event sample in which the selected muon had a high impact parameter with respect to the primary vertex. The probability of accepting a background event was taken as the average of the two methods. The low
EmissTand
mT(W)regions do not contain leptons from
Wboson decays. Muons that have a high impact parameter are primarily from heavy-flavour hadron decays. Both background samples are expected to be unbiased, and to have comparable statistics.
6 Systematic uncertainties
The effect of systematic uncertainties due to theoretical uncertainties and detector effects are determined for each bin of the measured observables. The systematic uncertainties are evaluated by varying each source of uncertainty by increasing or decreasing it by one standard deviation.
This effect is propagated through the event selection, unfolding and correction procedure. Differ-
ences with respect to the nominal case are determined separately for the upward and downward
variations for each bin, observable and channel. The total systematic uncertainty, for each bin,
is calculated by adding each individual systematic contributions in quadrature.
The measurements are dominated by systematic uncertainties due to the signal and back- ground modelling, and experimental effects as described below. The propagation of the uncer- tainties through the correction procedure and the uncertainties associated with the combination of the electron and muon channel are discussed in sections 8.2 and 8.3 respectively.
Signal modelling
The uncertainty due to the choice of MC generator was determined by comparing mc@nlo+herwig and alpgen+herwig while the colour reconnection modelling uncertainty was estimated through the comparison between the nominal powheg + pythia sample and the associated MC sample where the colour reconnection had been disabled in pythia.
The modelling of the parton shower and hadronisation uncertainty was evaluated by cal- culating the relative difference between alpgen + pythia
tt¯MC and the alternative alp- gen+herwig sample.
The evaluation of the uncertainty due to the choice of PDF was obtained using the NNPDF 2.0 [55], MSTW2008nlo90cl, and CTEQ66 [56] PDF sets. An envelope of uncertainty bands was determined for each set using the procedure prescribed for LHC studies [57] from which an overall uncertainty was obtained.
The uncertainty associated with the modelling of additional QCD radiation accompanying the
t¯tsystem was calculated by comparing the alpgen+pythia sample to ones with varied radiation settings presented in section 3. The variation was achieved by changing the normali- sation scale associated with
αSconsistently in the hard matrix element as well as in the parton shower. The level of radiation through parton showering [58] was adjusted to encompass the ATLAS measurement of additional jet activity in
tt¯events [30]. The uncertainty is estimated as the maximum difference between the specialised samples and the nominal with the uncertainty being symmetrical.
Background modelling
The individual experimental uncertainties were used to calculate the uncertainty on the size of background processes whose contribution was determined by MC. This resulted in an uncertainty on the background subtraction. This comprises all the backgrounds except for
W+jets and multijet.For the muon channel the shape uncertainty on the multijet background was calculated from the difference between the mean and individual shapes when the fake rates and real rates were varied separately within their uncertainties resulting in a 20% normalisation uncertainty. In the electron channel, as well as changing the rates, the uncertainty was estimated by varying the maximum
ETmissrequirement for the background selection region between 15 and 25 GeVand relaxing the
b-tag selection to one or greater. This resulted in a 50% normalisation uncertainty.For the background contribution due to
W+jets, the overall uncertainty on the charge asym-metry normalisation method (section 5.3) and the uncertainty on the flavour fractions are sep- arately determined.
The total background uncertainty is evaluated by adding in quadrature each of the different background uncertainty contributions. The uncertainty resulting from background subtraction is obtained by varying the background by this amount.
Experimental uncertainties
The experimental uncertainties refer to the MC simulation modelling of the detector performance for each of the reconstructed objects. These uncertainties affect the MC signal and background predictions, changing the numbers of events accepted.
The jet energy scale (JES) systematic uncertainty [51] arises from the necessary correction
from the initial calorimeter response at the EM scale to the energy of the hadronic jets [50].
It is a main contributor to the overall systematic uncertainty in all distributions acting on the signal efficiency and bin migration. In the central region of the detector
(|η|<1.7)it varies from 2.5% to 8% as a function of jet
pTand
ηas estimated from in situ measurements of the detector response [51]. It incorporates uncertainties from the jet energy calibration, calorimeter response, detector simulation, and the modelling of the fragmentation and underlying event, as well as other choices in the MC generation. Additional sources of uncertainty were also estimated, the main contributions are the intercalibration of the forward region detector response from the central regions of the detector, effects from the correction of additional
ppinteractions, jet flavour composition,
b-jet JES calibration and the presence of close-by jets. Uncertainties dueto different detector-simulation configurations used in the analysis and in the calibration were added as one additional uncertainty parameter (“relative non-closure”). The JES uncertainty was evaluated using a total of 21 individual components.
The jet energy resolution (JER) has been found to be well modelled in simulation. Two independent in situ methods were used to measure the JER from calorimeter observables taking advantage of the transverse momentum balance in events containing jets with large
pT. The two methods, sensitive to different sources of systematics, are used to measure the resolution which MC simulation describes within 10% for jets whose
pTfall within the 30-500 GeV range [59].
The jet reconstruction efficiency is also well modelled by the simulation and the uncertainty was evaluated by randomly removing jets in the simulation within the uncertainty of jet re- construction efficiency measured in data [51]. The uncertainties due to the JVF requirement was determined from studies of
Z →ee+jets events by varying scale factors associated with thehard-scatter jet selection efficiency and pile-up rejection efficiency.
The uncertainties related to the MC modelling of the lepton trigger, reconstruction and identification efficiency were evaluated by comparing high purity events featuring leptons in data and simulation. These include
Z→ee/Z→µµand
W →eνevents in data and simulation, while
tt¯were also included in the simulation studies [47]. Similar studies were also performed for the lepton energy and momentum scales and resolutions. Because of the orthogonal lepton requirement between channels, the electron uncertainty affects only the electron channel, and similarly for the muon channel. The electron uncertainty is approximately double the muon uncertainty. In both cases the uncertainty is small and with little variation between bins.
The uncertainty on
EmissTis determined by propagating all the uncertainties associated with the energy resolution scale of leptons and jets into the calculation of
EmissT. Two extra sources of uncertainty included originate from the calorimeter cells not associated with any physics objects and the pile-up modelling.
The systematics associated with tagging jets as originating from
b-quarks are separated intothree categories. These are the efficiency of the tagging algorithm (b-quark tagging efficiency), the efficiency with which jets originating from
c-quarks are tagged (c-quark tagging efficiency)and the rate that jets from light flavour are tagged (misidentified tagging efficiency). The efficiencies were estimated from data and parametrised as a function of
pTand
η[52, 60]. The systematics arise from factors used to correct the differences between simulation and data in each of the categories. The uncertainties in the simulation modelling of the
b-tagging performancewere assessed by studying
b-jets in dileptonictt¯events [61]. The
b-tagging efficiency is one of themain contributors to the overall systematic uncertainty which tends to slightly increase with
pT. The
c-quark efficiency uncertainty is approximately constant at≈2% while the misidentification uncertainty contributes at the percent level for all distributions.
The last experimental uncertainty evaluated is due to the measurement of the integrated
luminosity. This is dominated by the accuracy of the beam separation scans and has an asso-
ciated uncertainty of 1.8% [46] that was assigned to each bin of the distributions and the MC
background predictions.
7 Reconstructed yields and distributions
A summary of the number of selected data events, background contributions and total predictions is given in table 1. Dilepton
t¯tevents constitute the largest background to the
t¯tsingle-lepton signal of the double
b-tag event selection of this analysis. Also important is the background fromsingle top quark production. The
W+jetsand multijet backgrounds are smaller in comparison.
Yields
Source
e+jets (
±stat.±syst.) µ+jets (
±stat.±syst.) tt¯(single-lepton)
7810±20±600 9400±22±700tt¯
(dilepton)
570± 5± 60 670± 6± 60Single-top-quark
430± 6± 50 500± 7± 50 W+jets 260±15±110 360±18±130Multijet
130±16± 70 56± 4± 11Z+jets 52± 4± 13 28± 3± 7
Diboson
7± 1± 1 7± 1± 1Expectation
9270±31±600 11050±30±700Observed
8791 10690Table 1: The number of selected events from data, MC simulation and data-driven background estimates, in the electron and muon channels. The yields of MC samples that are not constrained by fits to data shown are normalised to an integrated luminosity of 4.6 fb
−1. The uncertainties specific to the
t¯tMC (ISR, generator, fragmentation, etc.) are not included within the
t¯t(single- lepton and dilepton) uncertainties given in this table.
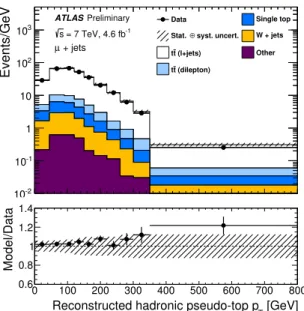
The reconstructed distributions for the muon channel of the
pT(t),y(t),y(tt)and
m(tt)observ-
ables, where
trefers to the hadronic or leptonic pseudo-top-quark, are shown in figure 3. The
predicted number of events using powheg+pythia with the “C” variant of the Perugia 2011
tunes agrees with the observed data within all regions, except for a small number of bins where
the data have a large statistical uncertainty. The data are shown using bin sizes that correspond
to one standard deviation resolution in the hadronic variables, except in the highest bins where
the bin width is increased to reduce the statistical uncertainty.
Events/GeV
10-2
10-1
1 10 102
103
Data Single top
syst. uncert.
Stat. ⊕ W + jets (l+jets)
t
t Other
(dilepton) t t + jets
µ
Preliminary ATLAS
= 7 TeV, 4.6 fb-1
s
[GeV]
Reconstructed hadronic pseudo-top pT
0 100 200 300 400 500 600 700 800
Model/Data
0.6 0.8 1 1.2 1.4
(a)
Events/Rapidity
1 10 102
103
104
105
106
107
Data Single top
syst. uncert.
Stat. ⊕ W + jets (l+jets)
t
t Other
(dilepton) t t + jets
µ
Preliminary ATLAS
= 7 TeV, 4.6 fb-1
s
t| Reconstructed hadronic pseudo-top |y
0 0.5 1 1.5 2 2.5
Model/Data
0.6 0.8 1 1.2 1.4
(b)
Events/Rapidity
1 10 102
103
104
105
106
107
Data Single top
syst. uncert.
Stat. ⊕ W + jets (l+jets)
t
t Other
(dilepton) t t + jets
µ
Preliminary ATLAS
= 7 TeV, 4.6 fb-1
s
tt| Reconstructed |y
0 0.5 1 1.5 2 2.5
Model/Data
0.6 0.8 1 1.2 1.4
(c)
Events/GeV
0 10 20 30
Data
syst. uncert.
Stat. ⊕ (l+jets) t t
(dilepton) t t Single top W + jets Other
+ jets µ
Preliminary ATLAS
= 7 TeV, 4.6 fb-1
s
[GeV]
Reconstructed mtt
0 500 1000 1500 2000 2500
Model/Data
0.6 0.8 1 1.2 1.4
(d)
Figure 3: The muon channel reconstructed pseudo-top-quark (a) hadronic
pT, (b) hadronic
rapidity, (c)
y(tt)and (d)
m(tt)distributions. Signal and background processes are shown in
different colours, with “Other”including the small backgrounds from diboson, multijet and
Z+jets
production. The data are compared with predictions from background models and expected
yields from simulated
tt¯events generated using powheg+pythia with the “C” variant of the
Perugia 2011 tunes family. The error bars on the data points show the statistical uncertainty
on the data, whereas the shaded band shows the total systematic and statistical uncertainty on
the predicted yields.
8 Corrections for detector effects and channel combinations
Each of the reconstructed pseudo-top-quark observables was corrected for the effects of detector efficiencies and resolution and presented within the kinematic range defined in section 2. The kinematic range of this measurement is close to the acceptance of the reconstructed object and event selections, such that model dependencies from regions of phase space outside of the acceptance are minimised. Section 8.1 describes the correction procedure, section 8.2 describes the propagation of the statistical and systematic uncertainties to the final distributions, and section 8.3 describes the combination of the electron and muon channel results.
8.1 Correction procedure
Each of the reconstructed pseudo-top-quark observables were corrected to the kinematic region defined in section 2 by implementing:
xipart = fpart!recoi ·X
j
Mpart,ireco,j· fmisassignj · freco!partj ·(xjreco−Nbgndj )
(2)
where
xjrecois the reconstructed observable in bin
j, Nbgndis the number of background events discussed in section 5.3,
freco!partcorrects for events that pass the reconstruction-level event selection but fail the particle-level event selection,
fmisassignis the correction factor for mis- assigned events, where the event includes a reconstructed pseudo-top-quark not corresponding to any at particle-level. This was determined using an angular maching between the components of the pseudo-top-quarks. Reconstructed and particle-level jets (
jet/jet′) and leptons (l/l
′) were considered matched if they satisified
∆R(jet, jet′) < 0.35and
∆R(l,l′) < 0.02. These cuts werefound to be fully efficient for leptons and close to 100% for jets.
Mrecopartis a response matrix applied iteratively using Bayesian unfolding [62],
fpart!recois an efficiency correction factor to correct for events that fulfil the particle-level event selection requirements but fail the reconstruction-level event selection and
xipartis the fully corrected particle-level observable in bin
i. The numberof background events
Nbgndand the correction factors
freco!partand
fmisassignare functions of the reconstruction-level pseudo-top-quark observable
xjreco. The correction factor
fpart!recois a function of the particle-level pseudo-top-quark observable
xipart. To evaluate the cross-section in bin
i, it is in addition necessary to take account of the luminosity and bin width.The same correction factor strategy was applied to each of the distributions
pT(t), y(t),y(tt), pT(tt), and m(tt). Each of the bin-by-bin correction factors were found to be similar for