CERN-PH-EP-2011-124
Measurement of the pseudorapidity and transverse momentum dependence of the elliptic flow of charged
particles in lead-lead collisions at √
s
NN= 2.76 TeV with the ATLAS detector
The ATLAS Collaboration
Abstract
This paper describes the measurement of elliptic flow of charged particles in lead-lead collisions at √
s
NN= 2.76 TeV using the ATLAS detector at the Large Hadron Collider (LHC). The results are based on an integrated lumi- nosity of approximately 7 µb
−1. Elliptic flow is measured over a wide region in pseudorapidity, |η| < 2.5, and over a broad range in transverse momentum, 0.5 < p
T< 20 GeV. The elliptic flow parameter v
2is obtained by correlating individual tracks with the event plane measured using energy deposited in the forward calorimeters. As a function of transverse momentum, v
2(p
T) reaches a maximum at p
Tof about 3 GeV, then decreases and becomes weakly dependent on p
Tabove 7–8 GeV. Over the measured pseudorapidity region, v
2is found to be only weakly dependent on η, with less variation than observed at lower beam energies. The results are discussed in the context of previous measurements at lower collision energies, as well as recent results from the LHC.
Keywords: LHC, ATLAS, Heavy Ions, Elliptic Flow
1. Introduction
The measurement of collective phenomena in nuclear collisions at high en- ergies has been a subject of intensive theoretical and experimental studies.
Anisotropic flow, which manifests itself as a large anisotropy in the event-by- event azimuthal angle distribution of produced particles, is generally understood to be a consequence of the spatial anisotropy of the initial energy deposition from nucleon-nucleon collisions in the overlap of the colliding nuclei. Anisotropies in the initial energy density are converted into final state momentum anisotropies via strong rescattering processes which induce pressure gradients, following the laws of relativistic hydrodynamics. Consequently, azimuthal anisotropies are sensitive to the initial state and its subsequent dynamical evolution.
arXiv:1108.6018v3 [hep-ex] 18 Jan 2012
Anisotropic flow is commonly studied by measuring the Fourier coefficients (v
n) of the azimuthal angle distributions of the emitted particles. The second harmonic, v
2, referred to as “elliptic flow”, is the most extensively studied as it most directly relates the anisotropic shape of the overlap of the colliding nuclei to a corresponding anisotropy of the outgoing momentum distribution (for a review, see Ref. [1]). Elliptic flow has been measured over a wide range of energies, collision systems, and collision centralities by all of the RHIC heavy ion experiments [2, 3, 4, 5] and several experiments at lower energies (see Ref. [1]).
Predictions for v
2at the LHC energy varied widely, covering all possibilities from a strong rise, no change, or even a decrease of v
2[6] relative to lower energy collisions. Measurements of v
2for inclusive charged-particles from the ALICE experiment [7] indicate that, integrated over p
T, it increases by about 30% from RHIC to LHC energies. However, ALICE also observed that v
2(p
T) for inclusive charged particles was identical with RHIC results for the same collision centrality (or impact parameter) up to p
T= 4 GeV. This implies that the observed rise is driven primarily by an increase in the average transverse momentum with the higher collision energy.
In this letter, we present a measurement of the elliptic flow of charged parti- cles in lead-lead collisions at √
s
NN= 2.76 TeV with the ATLAS detector at the LHC. The elliptic flow is measured in the pseudorapidity region |η| < 2.5 over the full azimuthal range 0 < φ < 2π, for transverse momenta
10.5 < p
T< 20 GeV. This allows stringent tests of the applicability of hydrodynamics in the LHC energy regime, and provides information on the transition between low p
T, where hydrodynamics is expected to dominate, and higher p
T, where particle production is expected to stem from the fragmentation of jets modified by the hot, dense medium [8].
2. ATLAS detector and trigger
The ATLAS detector [9] is well suited for measurements of azimuthal an- isotropies over a large pseudorapidity range. The relevant detectors for this analysis are the inner detector (ID) and forward calorimeter (FCal). The ID is contained within the 2 T field of a superconducting solenoid magnet, and mea- sures the trajectories of charged particles in the pseudorapidity region |η| < 2.5 and over the full azimuthal range. The precision silicon tracking detectors con- sist of pixel detectors (Pixel) and a semiconductor microstrip tracker (SCT).
In the “barrel” region, these are arranged on cylindrical layers surrounding the beam pipe, while in the “endcap” regions they are mounted on disks perpendic- ular to the beam axis. A charged particle typically traverses three layers of the
1ATLAS uses a right-handed coordinate system with its origin at the nominal interaction point (IP) in the centre of the detector and the z-axis along the beam pipe. The x-axis points from the IP to the centre of the LHC ring, and theyaxis points upward. Cylindrical coordinates (r, φ) are used in the transverse plane,φbeing the azimuthal angle around the beam pipe. The pseudorapidity is defined in terms of the polar angleθasη=−ln tan(θ/2).
Transverse momentum and energy are defined aspT=psinθandET=Esinθ, respectively.
Pixel detector and four double-sided layers of the SCT. The silicon detectors are surrounded by a transition radiation tracker (TRT), composed of drift tubes and covering up to |η| = 2.
The FCal covers a pseudorapidity range 3.2 < |η| < 4.9. It uses tungsten and copper absorbers with liquid argon as the active medium, with a total thickness of about 10 interaction lengths. This analysis uses the energy deposition in the entire FCal for the centrality determination, while for the reaction plane measurement only the energy deposition in the first sampling layer of the FCal (Layer 1) is used, as doing this was found to minimize the effect of fluctuations on the reaction plane measurement.
The trigger system has three stages, the first of which (Level-1) is hardware- based, while the later stages (Level-2 and Event Filter [9]) are based on software algorithms. The minimum-bias Level-1 trigger used for this analysis requires sig- nals in either the two sets of minimum-bias trigger scintillator (MBTS) counters, covering 2.1 < |η| < 3.9 on each side of the experiment, or the two zero-degree calorimeters (ZDC), each positioned at |z| = 140 m relative to the centre of the detector, detecting neutrons and photons with |η| > 8.3. The ZDC Level-1 trigger thresholds were set just below the single neutron peak on each side. The MBTS trigger was configured to require at least one hit above threshold from each side of the detector. A Level-2 timing requirement on signals from the MBTS was then imposed to remove beam backgrounds, while the ZDC had no further requirements beyond the Level-1 decision. The Event Filter was not needed for the minimum-bias triggering and was run in pass-through mode.
3. Event selection and reconstruction
The lead-lead data set analysed here corresponds to an integrated luminos- ity of approximately L
int= 7 µb
−1. Three main event selection requirements were applied offline to reject both non-collision backgrounds and Coulomb pro- cesses, in particular highly-inelastic photonuclear events. First, an offline event selection required a time difference |∆t| < 3 ns between the positive and neg- ative η MBTS counters as well as a reconstructed vertex in order to suppress non-collision backgrounds. Second, a coincidence of the ZDCs at forward and backward pseudorapidities was required in order to reject a variety of back- ground processes, while maintaining high efficiency for non-Coulomb processes.
Finally, in this analysis only events with a vertex with |z
vtx| < 10 cm were used.
Simulations show the vertex algorithm to be essentially 100% efficient for the event sample considered here. Pile-up events, defined as additional minimum bias events in the same bunch crossing, are expected to be present at the 10
−4level and so are negligible. In total, approximately 4 × 10
7events passed the selection criteria.
Tracks were reconstructed within the full acceptance of the inner detector.
To improve the reliability of the ID track reconstruction in the tracking environ-
ment in heavy ion collisions, the track quality requirements are more stringent
than those defined for proton-proton collisions [10]. Tracks are required to have
at least eight hits in the SCT, at least two Pixel hits and a hit in the Pixel layer
closest to the interaction point. A track must have no missing Pixel hits and at most one missing SCT hit, where such hits are expected. Finally, the trans- verse and longitudinal impact parameters with respect to the vertex (|d
0| and
|z
0sin θ|) were each required to be less than 1 mm. These additional require- ments were made to improve the purity of the track sample. The inefficiency of this selection is driven by the loss due to hadronic interactions in the detector material, which increases with |η| [10]. This results in an additional inefficiency of approximately 15% at |η| > 1 compared to the central region of the detector.
However, the results shown here are found to be insensitive to the absolute tracking efficiency (discussed below), and the effect of the efficiency decrease at high |η| is minimized when measurements are performed in limited transverse momentum and pseudorapidity intervals.
The tracking performance has been studied in detail by comparing data to Monte Carlo simulations based on the HIJING event generator [11] and a full GEANT4 [12] simulation of the detector [13]. In general the simulated distributions of the number of Pixel and SCT hits on tracks describe the data well, particularly after reweighting the simulated momentum distribution to account for the differences in the charged particle spectrum reconstructed in data and HIJING. Monte Carlo calculations show that the tracking efficiency for charged hadrons in this analysis is about 72% near η = 0 in central collisions, lower than in proton-proton collisions due to the more stringent requirements and the higher occupancy in the SCT. Fake tracks from random combinations of hits are generally negligible, e.g. reaching only 0.1% in |η| < 0.3 for the highest multiplicity collisions, although the rate of fake tracks increases slightly with increasing |η|.
4. Data analysis
In order to systematically select various geometries of the initial state, the data were analysed in centrality intervals defined by selections on FCal ΣE
T, the total transverse energy deposited in the FCal (always stated at the electromag- netic energy scale, which does not correct for the response of the calorimeter to hadrons). These intervals are expressed in percentiles of the total inelastic non- Coulomb lead-lead cross section (0–10%, 10–20%,..., 70–80%) with the most central interval (0-10%) corresponding to the 10% of events with the largest FCal ΣE
T. The measured FCal ΣE
Tdistribution for a subset of the data (with L
intapproximately 200 mb
−1), taken with a less restrictive primary trigger than used for the bulk of the data and used for the calibration procedure described below, is shown divided into centrality intervals in Fig. 1.
To establish the fraction f of the total non-Coulomb inelastic cross section selected by our trigger and event selection criteria, we have performed a convo- lution of FCal ΣE
Tdistributions measured in proton-proton data at √
s = 2.76
TeV with a full Monte Carlo Glauber calculation [14]. The calculation assumes
the number of effective proton-proton collisions per lead-lead event, N, scales
according to the “two-component model” (from e.g. Ref [15]). This model
[TeV]
ET
Σ FCal
0 1 2 3 4
]-1 [TeVTEΣ/d evt)dN evt(1/N
10-4
10-3
10-2
10-1
1
70-80% 60-70% 50-60% 40-50% 30-40% 20-30% 10-20% 0-10%
Data
Model ATLAS
=2.76 TeV sNN
Pb+Pb
= 200 mb-1
Lint
Figure 1: Measured FCal ΣET distribution divided into 10% centrality intervals (black).
Proton-proton data at√
s = 2.76 TeV, convolved with a Glauber Monte Carlo calculation withx= 0.088 (grey), as described in the text.
combines the number of participants (N
part, the number of nucleons which in- teract inelastically at least once) and the number of binary collisions (N
coll) as N = (1 −x)
Npart2+ xN
coll. In this approach, the only free parameter is x, which controls the relative contribution of N
partand N
coll. The best description of the data is found to be for x = 0.088. The value of f and its uncertainty is estimated by systematically varying the effect of trigger and event selection inefficiencies as well as backgrounds in the most peripheral FCal ΣE
Tinterval to achieve the best agreement between the measured and simulated distributions. Using this analysis of the FCal ΣE
Tdistribution, the fraction of the total cross section sampled by the trigger and event selection has been estimated to be 98%, with an uncertainty of 2%. This is similar to estimates given in a previous ATLAS publication [16]. The FCal ΣE
Tranges defined from this subsample have been found to be stable for the full data set, both by counting the number of events and by measuring the average number of reconstructed tracks in each interval.
The 20% of events with the smallest FCal ΣE
Tare not included in this analysis, due to the relatively large uncertainties in determining the appropriate selection criteria.
The final state momentum anisotropy can be quantified by studying the Fourier decomposition of the azimuthal angle distribution [17]:
E d
3N dp
3= 1
p
Td
3N
dφdp
Tdy = 1 2πp
TE p
d
2N
dp
Tdη 1 + 2
∞
X
n=1
v
ncos [n(φ − Ψ
n)]
!
, (1)
where y, p
Tand φ are the rapidity, transverse momentum, and azimuthal angle
of final-state charged particle tracks and Ψ
ndenotes the azimuthal angle of the n-th order reaction plane. In more peripheral events, Ψ
2is close to Φ
RP, the reaction plane angle, defined by the impact parameter ( ~b, the vector separation of the barycentres of the two nuclei) and the beam axis (z). In more central events, Ψ
2primarily reflects fluctuations in the initial-state configurations of colliding nucleons. This analysis was confined to the second Fourier coefficient (n = 2), v
2≡ hcos [2(φ − Φ
RP)]i, where angular brackets denote an average first over particles within each event relative to the eventwise reaction plane, and then over events.
In this analysis, the n = 2 event plane is determined from the data on an event-by-event basis, according to the scheme outlined in Ref. [17]:
Ψ
2= 1 2 tan
−1P E
T,itowerw
isin(2φ
i) P E
T,itowerw
icos(2φ
i)
!
, (2)
where sums run over tower transverse energies E
Ttoweras measured in the first sampling layer of the forward calorimeters, with each tower covering ∆η ×∆φ = 0.1 × 0.1. The tower weights, w
i= w
i(φ
i, η
i), are used to correct for local variations in detector response. They are calculated in narrow ∆η slices (∆η = 0.1) over the full FCal η range in such a way as to remove structures in the uncorrected φ distributions of E
Ttowerin every ∆η slice. The final results of this analysis are found to be insensitive to the weighting, and results obtained with all w
i= 1 were consistent with those reported here, and well within the systematic uncertainties estimated below.
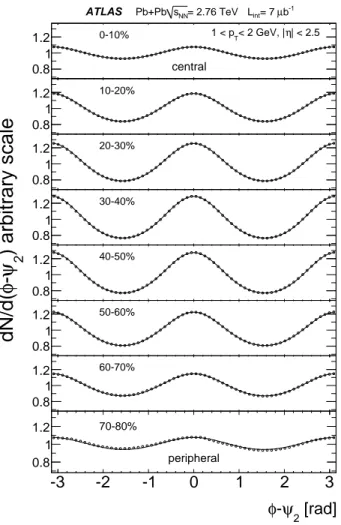
The correlation of individual track azimuthal angles with the estimated event plane is shown in Fig. 2 for tracks with p
T= 1 − 2 GeV. There is a clear sinu- soidal modulation at all centralities. The modulation is largest in the 20–50%
centrality intervals, and decreases for the more central and peripheral events. In the centrality intervals where the correlation is strongest, the correlation does not follow a perfect 1 + α cos(2φ) form, indicating significant contributions from higher order harmonics. However, in this letter we rely on the orthogonality of the Fourier expansion and do not extract the other coefficients. To verify that this does not bias the measurement, we have extracted v
2from a fit containing all Fourier components v
nup to n = 6, and found v
2values consistent with the results extracted below. The odd amplitudes are found to be consistent with zero, as expected when measuring odd harmonic functions relative to Ψ
2[17].
The measured values of v
2are generally underestimated because of the finite experimental resolution in extracting the event plane angle. The event plane resolution correction factor, R, was obtained using the subevent technique, also described in Ref. [17]. Two “subevents” are defined in each event, one each in the forward and backward η directions. For the measurement of the event plane using the FCal, the first sampling layer on the positive η side was selected as subevent “P”, with a corresponding subevent “N ” formed for negative η.
The resolution correction for the event plane measured by each subevent was
calculated as a function of FCal ΣE
Taccording to the formula R(ΣE
T) =
q
cos[2(Ψ
N2− Ψ
P2)]
, (3)
where angular brackets denote an average over all events in a FCal ΣE
Tinterval.
The left panel of Fig. 3 shows the distribution of the difference Ψ
P2− Ψ
N2. The right panel shows the FCal ΣE
Tdependence of the resolution correction for the event plane determined using the full FCal Layer 1 as well as a reduced- acceptance version used in the systematic studies discussed below.
The final, resolution-corrected, v
2is calculated in intervals of centrality, η and p
Tas
v
2(η, p
T) = 1 N
tottrkevents
X
j
1 R(ΣE
T)
tracks
X
i
c
icos [2(φ
i− Ψ
N/P2,j)], (4)
where N
tottrkdenotes the total number of the reconstructed tracks in a given centrality, η and p
Trange, and the c
iare weights similar to the w
ifor tracks, designed to flatten the φ distribution in a small ∆η slice. For Ψ
N/P2,j(the event plane for event j) we take the event plane measured in the opposite η hemisphere (i.e. “P ” at positive η, or “N ” at negative η) to each track with azimuthal angle φ
i. Using the track in the opposite hemisphere maximizes the pseudorapidity gap between the reaction plane estimate and the v
2estimate (|∆η| > 3.2), minimizing potential non-flow correlations between them.
The systematic uncertainty on v
2as a function of p
T, η and centrality was evaluated by varying several different aspects of the analysis procedure.
• The resolution correction was changed by limiting the FCal acceptance to a smaller range in pseudorapidity.
• Tighter tracking requirements were applied (both |d
0| and |z
0sin θ| less than 0.5 mm, instead of the nominal 1 mm requirement).
• Results were compared using negatively and positively charged tracks.
• Results were compared between v
2measured at positive and negative pseu- dorapidities.
• Results were studied as a function of time during the heavy ion run.
Additional sources of systematic uncertainties were examined, including the
following: Deviations from zero of hsin(2[φ − Ψ
2])i, which are sensitive to resid-
ual biases in the reaction plane determination and detector non-uniformities,
were measured. Monte Carlo studies were performed based on HIJING, with
a special procedure applied to the generated particle azimuthal angles so as
to simulate elliptic flow (from Ref. [17]), with a magnitude extrapolated from
RHIC data. Deviations from the flow induced at the generator level were ob-
tained by applying the same analysis procedure to the simulated data as with
Centrality 0-10% 40-50%
pT [GeV] 0.8-0.9 2.4-2.7 8-10 0.8-0.9 2.4-2.7 8-10 Smaller η acceptance of event
plane determination
0.6 1.2 5.7 0.7 0.7 2.0
Residual deviation from zero of sine terms
0.7 0.6 0.4 0.5 0.7 1.2
Varying tracking cuts 0.4 0.1 1.7 0.1 <0.1 0.2
Negative vs positive tracks 0.5 0.3 3.3 0.3 0.1 1.6
Asymmetry with respect to η reflection
0.1 0.1 0.2 <0.1 <0.1 0.1
Time dependence 0.2 0.2
Monte Carlo reconstruction 1.2 1.2 1.2 0.3 0.3 0.3
Total systematic error 1.6 1.9 6.9 1.0 1.0 2.9
Table 1: Principal systematic uncertainties (stated as a percentage of the value ofv2) on the v2measurement for threepTintervals and two centrality intervals, all for|η|<1.
real data. The event plane determined from the reconstructed tracks was also investigated as an independent cross-check on the FCal reaction plane. In this case, for the tracks with positive (negative) η the event plane determined in the negative (positive) η subevent was used. The uncertainty in the fraction of the total inelastic cross section sampled by our trigger and event selection criteria gives an overall scale uncertainty on v
2, ranging from 1% in central events up to 5% in peripheral events.
Deviations in individual contributions from the baseline results have been quantified as relative systematic uncertainties on v
2(in percent), which are listed in Table 1 for several centrality and p
Tintervals, all for |η| < 1. The different components have been added in quadrature and expressed as 1σ point- to-point systematic uncertainties. Note that the somewhat large increase in the scale of the uncertainties from moderate to high p
Tcan be partly attributed to the limited track statistics at high p
T. It should also be pointed out that the systematic uncertainties only include those associated with the measurements themselves; no attempt is made to disentangle the potential contributions from non-flow effects, since their nature is not yet fully understood.
5. Results
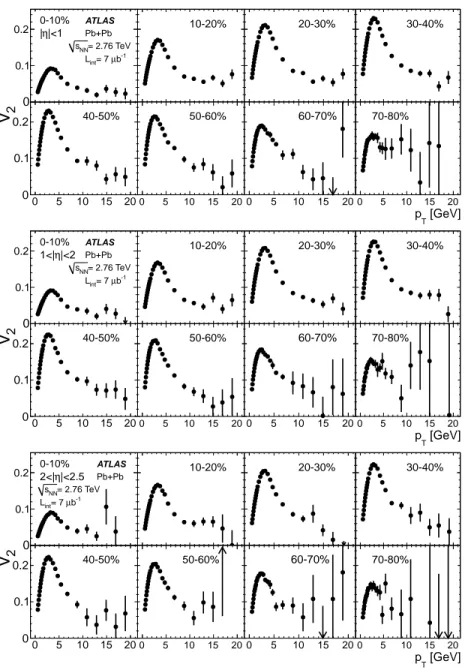
The top panel of Fig. 4 shows the v
2dependence on p
Tfor eight 10% cen- trality intervals and for tracks with |η| < 1. It is observed that all centrality intervals show a rapid rise in v
2(p
T) up to p
T= 3 GeV, a decrease out to 7–8 GeV, and then a weak p
T-dependence beyond 9–10 GeV. The same trends are also seen for 1 < |η| < 2 (Fig. 4 middle) and 2 < |η| < 2.5 (Fig. 4 bottom).
The pseudorapidity dependence of v
2is shown in Fig. 5. The top row shows
the centrality and η dependence of v
2(η, p
T) for five p
Tintervals, which char-
acterize the trend shown in Fig. 4, and the four most-central intervals. The
bottom row shows the same information for the four most-peripheral intervals.
It is observed that v
2depends very weakly on η over the measured pseudora- pidity region. In the two lowest p
Tintervals, below 1.2 GeV, v
2drops by about 5–10% over the range |η| = 0 − 2.4. At higher transverse momenta, a decrease on the order of few percent can be seen, although, due to the large point-to- point errors, a flat η dependence cannot be excluded. This is in contrast to the strong variation in v
2(η) observed by the PHOBOS experiment at √
s
NN= 200 GeV [18], which drops by approximately 30% between η = 0 and η = 2.5.
Fig. 6 shows v
2(p
T) for |η| < 1 in the 40–50% centrality interval compared to data from the LHC (ALICE, from Ref. [7]) as well as from RHIC (STAR [19]
and PHENIX [20]) with a centre-of-mass energy a factor of nearly 14 lower. The ALICE and STAR data are shown for the second cumulant v
2{2}, which gives results closest to the event-plane method used in this analysis. The PHENIX data are obtained with a similar method as ATLAS, but with v
2measured only for identified π
0hadrons, detected through their two-photon decay mode. It is observed that all of the data sets are quite similar as a function of p
T, both at lower p
T(ALICE and STAR) and even at higher p
T, within the limited statisti- cal precision of the PHENIX data. The observation of similar v
2at low p
Thas been noted recently [7], and has been reproduced using hydrodynamical simula- tions assuming the same shear viscosity to entropy density ratio but initialized at a higher energy density. However, the similarities at high p
Twill require additional theoretical study to see if they are consistent with the differential energy loss of jets in the hot, dense medium.
6. Conclusions
Elliptic flow measurements in lead-lead collisions at √
s
NN= 2.76 TeV ob- tained with the ATLAS detector are presented for an integrated luminosity of approximately 7 µb
−1. These results represent the first measurement of v
2over a broad range in η and p
Tat the LHC energy. As a function of transverse mo- mentum, at all |η|, v
2rises rapidly up to p
T= 3 GeV, decreases somewhat less rapidly out to p
T= 7–8 GeV, and then varies weakly out to 20 GeV. Over the measured pseudorapidity region, |η| < 2.5, v
2is found to be only weakly depen- dent on η, with less variation than observed at lower beam energies. Comparison of the 40–50% interval with lower energy data shows little change both at low and high p
T. These results provide strong constraints on models which aim to describe the dynamical evolution of the system created in ultra-relativistic heavy ion collisions.
7. Acknowledgements
We thank CERN for the efficient commissioning and operation of the LHC during this initial heavy ion data taking period as well as the support staff from our institutions without whom ATLAS could not be operated efficiently.
We acknowledge the support of ANPCyT, Argentina; YerPhI, Armenia;
ARC, Australia; BMWF, Austria; ANAS, Azerbaijan; SSTC, Belarus; CNPq
and FAPESP, Brazil; NSERC, NRC and CFI, Canada; CERN; CONICYT, Chile; CAS, MOST and NSFC, China; COLCIENCIAS, Colombia; MSMT CR, MPO CR and VSC CR, Czech Republic; DNRF, DNSRC and Lund- beck Foundation, Denmark; ARTEMIS, European Union; IN2P3-CNRS, CEA- DSM/IRFU, France; GNAS, Georgia; BMBF, DFG, HGF, MPG and AvH Foundation, Germany; GSRT, Greece; ISF, MINERVA, GIF, DIP and Benoziyo Center, Israel; INFN, Italy; MEXT and JSPS, Japan; CNRST, Morocco; FOM and NWO, Netherlands; RCN, Norway; MNiSW, Poland; GRICES and FCT, Portugal; MERYS (MECTS), Romania; MES of Russia and ROSATOM, Rus- sian Federation; JINR; MSTD, Serbia; MSSR, Slovakia; ARRS and MVZT, Slovenia; DST/NRF, South Africa; MICINN, Spain; SRC and Wallenberg Foun- dation, Sweden; SER, SNSF and Cantons of Bern and Geneva, Switzerland;
NSC, Taiwan; TAEK, Turkey; STFC, the Royal Society and Leverhulme Trust, United Kingdom; DOE and NSF, United States of America.
The crucial computing support from all WLCG partners is acknowledged gratefully, in particular from CERN and the ATLAS Tier-1 facilities at TRIUMF (Canada), NDGF (Denmark, Norway, Sweden), CC-IN2P3 (France), KIT/GridKA (Germany), INFN-CNAF (Italy), NL-T1 (Netherlands), PIC (Spain), ASGC (Taiwan), RAL (UK) and BNL (USA) and in the Tier-2 facilities worldwide.
References
[1] S. A. Voloshin, A. M. Poskanzer and R. Snellings, arXiv:0809.2949 [nucl- ex].
[2] I. Arsene et al., BRAHMS Collaboration, Nucl. Phys. A757 (2005) 1.
[3] K. H. Ackermann et al., STAR Collaboration, Phys. Rev. Lett. 86 (2001) 402.
[4] B. B. Back et al., PHOBOS Collaboration, Nucl. Phys. A757 (2005) 28.
[5] K. Adcox et al., PHENIX Collaboration, Nucl. Phys. A757 (2005) 184.
[6] N. Armesto (ed.) et al., J. Phys. G35 (2008) 054001.
[7] K. Aamodt et al., ALICE Collaboration, Phys. Rev. Lett. 105 (2010) 252302.
[8] ATLAS Collaboration, Phys. Rev. Lett. 105 (2010) 252303.
[9] ATLAS Collaboration, JINST 3 (2008) S08003.
[10] ATLAS Collaboration, Phys. Lett. B688 (2010) 21.
[11] M. Gyulassy and X-N. Wang, Comput. Phys. Comm. 83 (1994) 307.
[12] S. Agostinelli et al., Nucl. Instr. Meth. A506 (2003) 250.
[13] ATLAS Collaboration, Eur. Phys. J. C70 (2010) 823.
[14] M. L. Miller, K. Reygers, S. J. Sanders, P. Steinberg, Ann. Rev. Nucl. Part.
Sci. 57 (2007) 205-243.
[15] D. Kharzeev, M. Nardi, Phys. Lett. B507 (2001) 121-128.
[16] ATLAS Collaboration, Phys. Lett. B697 (2011) 294.
[17] A. M. Poskanzer and S. A. Voloshin, Phys. Rev. C58 (1998) 1671.
[18] B. B. Back et al., PHOBOS Collaboration, Phys. Rev. C72 (2005) 051901.
[19] J. Adams et al., STAR Collaboration, Phys. Rev. C72 (2005) 014904.
[20] A. Adare et al., PHENIX Collaboration, Phys. Rev. Lett. 105 (2010)
142301.
ATLAS Pb+Pb sNN= 2.76 TeV Lint= 7 µb-1
-3 -2 -1 0 1 2 3
0.8 1
1.2 0-10%
central
| < 2.5 η
< 2 GeV, | 1 < pT
-3 -2 -1 0 1 2 3
0.8 1
1.2 10-20%
-3 -2 -1 0 1 2 3
0.8 1
1.2 20-30%
-3 -2 -1 0 1 2 3
0.8 1
1.2 30-40%
-3 -2 -1 0 1 2 3
0.8 1
1.2 40-50%
-3 -2 -1 0 1 2 3
0.8 1
1.2 50-60%
-3 -2 -1 0 1 2 3
0.8 1
1.2 60-70%
[rad]
ψ
2φ -
-3 -2 -1 0 1 2 3
0.8 1
1.2 70-80%
peripheral
) arbitrary scale
2ψ - φ dN/d(
Figure 2: Distribution of the azimuthal angle of individual tracks relative to the measured event plane, in eight centrality intervals. These distributions are meant to illustrate the observed correlation relative to the event plane, and are not used in the quantitative estimates ofv2. The curve is a fit to 1 +P
n2vncos(nφ) up ton= 6.
[rad]
N
ψ2
-
P
ψ2
-1.5 -1 -0.5 0 0.5 1 1.5
Number of events
0 2000 4000 6000 8000 10000 12000
| < 4.8 η 3.2 < |
| < 4.8 η 4.0 < |
ATLAS Pb+Pb sNN= 2.76 TeV 20 - 30%
[TeV]
ET
Σ FCal
0 1 2 3 4
R
0 0.2 0.4 0.6 0.8 1
| < 4.8 η 3.2 < |
| < 4.8 η 4.0 < |
20-30%
ATLAS
= 2.76 TeV sNN
Pb+Pb
Figure 3: (left) Distribution of the difference between the event planes at positive and negativeηobtained using Layer 1 FCal towers, both with full and half acceptance. (right) FCal ΣETdependence of the resolution correction for event planes from Layer 1 FCal towers in full acceptance (full symbols) and half acceptance (open symbols).
0 5 10 15 20
2
v
0 0.1
0.2 40-50%
0 5 10 15 20
0 0.1 0.2 0-10%
|<1 η
|
ATLAS Pb+Pb
= 2.76 TeV sNN
b-1 µ int= 7 L
0 5 10 15 20
0 0.1
0.2 10-20%
0 5 10 15 20
0 0.1
0.2 20-30%
0 5 10 15 20
0 0.1
0.2 30-40%
0 5 10 15 20
0 0.1
0.2 50-60%
0 5 10 15 20
0 0.1
0.2 60-70%
[GeV]
pT
0 5 10 15 20
0 0.1
0.2 70-80%
0
0 5 10 15 20
2
v
0 0.1
0.2 40-50%
0 5 10 15 20
0 0.1 0.2 0-10%
|<2 η 1<|
ATLAS Pb+Pb
= 2.76 TeV sNN
b-1 µ int= 7 L
0 5 10 15 20
0 0.1
0.2 10-20%
0 5 10 15 20
0 0.1
0.2 20-30%
0 5 10 15 20
0 0.1
0.2 30-40%
0 5 10 15 20
0 0.1
0.2 50-60%
0 5 10 15 20
0 0.1
0.2 60-70%
[GeV]
pT
0 5 10 15 20
0 0.1
0.2 70-80%
0
0 5 10 15 20
2
v
0 0.1
0.2 40-50%
0 5 10 15 20
0 0.1 0.2 0-10%
|<2.5 η 2<|
ATLAS Pb+Pb
= 2.76 TeV sNN
b-1 µ int= 7 L
0 5 10 15 20
0 0.1
0.2 10-20%
0 5 10 15 20
0 0.1
0.2 20-30%
0 5 10 15 20
0 0.1
0.2 30-40%
0 5 10 15 20
0 0.1
0.2 50-60%
0 5 10 15 20
0 0.1
0.2 60-70%
[GeV]
pT
0 5 10 15 20
0 0.1
0.2 70-80%
0
Figure 4: Elliptic flow v2(pT) as a function of pT for eight 10% centrality intervals, for pT from 0.5 to 20 GeV, and for three ranges in pseudorapidity (|η|< 1, 1<|η|<2 and 2<|η|<2.5). Error bars show statistical and systematic uncertainties added in quadrature.
The arrows indicate where the value ofv2 does not fit within the chosen plot scale, due to large statistical fluctuations.
-2 0 2
0 0.1 0.2
< 0.7 GeV 0.5 < pT
0-10%
10-20%
20-30%
30-40%
-2 0 2
0 0.1 0.2
< 1.2 GeV 0.8 < pT
-2 0 2
0 0.1 0.2
< 4 GeV 2 < pT
-2 0 2
0 0.1 0.2
< 7 GeV 4 < pT
-2 0 2
0 0.1 0.2
< 20 GeV 9 < pT ATLAS
Pb+Pb
= 2.76 TeV sNN
b-1
µ
int= 7 L
-2 0 2
2
v
0 0.1 0.2
40-50%
50-60%
60-70%
70-80%
-2 0 2
0 0.1 0.2
-2
η
0 20 0.1
0.2 30-40%
-2 0 2
0 0.1
0.2 30-40%
-2 0 2
0 0.1 0.2
0
Figure 5: Pseudorapidity dependence ofv2(pT, η) for 0.5< pT<20 GeV in fivepTintervals and 10% centrality intervals. Error bars show statistical and systematic uncertainties added in quadrature.
[GeV]
p T
0 5 10 15 20
2 v
0 0.1 0.2
0.3
ATLAS h± Pb+Pb sNN=2.76 TeV 40-50%=2.76 TeV 40-50%
sNN
Pb+Pb h±
ALICE
=200 GeV 40-60%
sNN
Au+Au h±
STAR
=200 GeV 40-50%
sNN
Au+Au π0
PHENIX
Figure 6: v2vs. pTat|η|<1 in the 40–50% centrality interval, compared to previous exper- imental data: ALICEv2{2}[7] for inclusive charged particles, PHENIX [20]v2 for identified π0, and STAR data onv2{2}for inclusive charged particles for the 40–60% interval [19].


![Figure 6: v 2 vs. p T at |η| < 1 in the 40–50% centrality interval, compared to previous exper- exper-imental data: ALICE v 2 {2}[7] for inclusive charged particles, PHENIX [20] v 2 for identified π 0 , and STAR data on v 2 {2} for inclusive charged par](https://thumb-eu.123doks.com/thumbv2/1library_info/4025182.1542050/16.918.244.677.407.718/centrality-interval-compared-previous-inclusive-particles-identified-inclusive.webp)
