KEK preprint 2020-04
Measurement of the Branching Fraction of the Decay B
+→ π
+π
−`
+ν
`in Fully Reconstructed Events at Belle
C. Beleño,
9A. Frey,
9I. Adachi,
13, 10H. Aihara,
74D. M. Asner,
2H. Atmacan,
6T. Aushev,
15R. Ayad,
69P. Behera,
20J. Bennett,
41F. Bernlochner,
1V. Bhardwaj,
17T. Bilka,
4J. Biswal,
27G. Bonvicini,
78A. Bozek,
50M. Bračko,
38, 27T. E. Browder,
12M. Campajola,
25, 45D. Červenkov,
4P. Chang,
49A. Chen,
47K. Chilikin,
33K. Cho,
30Y. Choi,
67D. Cinabro,
78S. Cunliffe,
7N. Dash,
18F. Di Capua,
25, 45J. Dingfelder,
1Z. Doležal,
4T. V. Dong,
8S. Eidelman,
3, 53, 33D. Epifanov,
3, 53J. E. Fast,
55T. Ferber,
7B. G. Fulsom,
55R. Garg,
56V. Gaur,
77N. Gabyshev,
3, 53A. Garmash,
3, 53A. Giri,
19P. Goldenzweig,
28Y. Guan,
6O. Hartbrich,
12K. Hayasaka,
52H. Hayashii,
46W.-S. Hou,
49K. Inami,
44A. Ishikawa,
13, 10M. Iwasaki,
54W. W. Jacobs,
21H. B. Jeon,
32Y. Jin,
74K. K. Joo,
5C. Kiesling,
39B. H. Kim,
62D. Y. Kim,
65K.-H. Kim,
80S. H. Kim,
11Y.-K. Kim,
80T. D. Kimmel,
77K. Kinoshita,
6P. Kodyš,
4S. Korpar,
38, 27D. Kotchetkov,
12P. Križan,
34, 27R. Kroeger,
41P. Krokovny,
3, 53T. Kuhr,
35R. Kulasiri,
29R. Kumar,
59A. Kuzmin,
3, 53Y.-J. Kwon,
80K. Lalwani,
37S. C. Lee,
32L. K. Li,
22Y. B. Li,
57L. Li Gioi,
39J. Libby,
20K. Lieret,
35D. Liventsev,
77, 13T. Luo,
8J. MacNaughton,
42C. MacQueen,
40M. Masuda,
73T. Matsuda,
42M. Merola,
25, 45K. Miyabayashi,
46G. B. Mohanty,
70T. J. Moon,
62T. Mori,
44M. Mrvar,
23M. Nakao,
13, 10N. K. Nisar,
58S. Nishida,
13, 10S. Ogawa,
71H. Ono,
51, 52P. Oskin,
33P. Pakhlov,
33, 43G. Pakhlova,
15, 33S. Pardi,
25H. Park,
32S. Patra,
17T. K. Pedlar,
36R. Pestotnik,
27L. E. Piilonen,
77T. Podobnik,
34, 27E. Prencipe,
16M. T. Prim,
28A. Rostomyan,
7N. Rout,
20G. Russo,
45D. Sahoo,
70Y. Sakai,
13, 10S. Sandilya,
6A. Sangal,
6T. Sanuki,
72V. Savinov,
58G. Schnell,
81, 82C. Schwanda,
23A. J. Schwartz,
6B. Schwenker,
9Y. Seino,
52K. Senyo,
79M. E. Sevior,
40M. Shapkin,
24J.-G. Shiu,
49B. Shwartz,
3, 53A. Sokolov,
24E. Solovieva,
33M. Starič,
27Z. S. Stottler,
77J. F. Strube,
55T. Sumiyoshi,
76W. Sutcliffe,
1M. Takizawa,
63, 14, 60K. Tanida,
26F. Tenchini,
7M. Uchida,
75T. Uglov,
33, 15S. Uno,
13, 10P. Urquijo,
40S. E. Vahsen,
12R. Van Tonder,
1G. Varner,
12K. E. Varvell,
68C. H. Wang,
48E. Wang,
58M.-Z. Wang,
49P. Wang,
22X. L. Wang,
8M. Watanabe,
52E. Won,
31X. Xu,
64W. Yan,
61S. B. Yang,
31H. Ye,
7Y. Yusa,
52Z. P. Zhang,
61V. Zhilich,
3, 53and V. Zhukova
33(The Belle Collaboration)
1
University of Bonn, 53115 Bonn
2
Brookhaven National Laboratory, Upton, New York 11973
3
Budker Institute of Nuclear Physics SB RAS, Novosibirsk 630090
4
Faculty of Mathematics and Physics, Charles University, 121 16 Prague
5
Chonnam National University, Gwangju 61186
6
University of Cincinnati, Cincinnati, Ohio 45221
7
Deutsches Elektronen–Synchrotron, 22607 Hamburg
8
Key Laboratory of Nuclear Physics and Ion-beam Application (MOE) and Institute of Modern Physics, Fudan University, Shanghai 200443
9
II. Physikalisches Institut, Georg-August-Universität Göttingen, 37073 Göttingen
10
SOKENDAI (The Graduate University for Advanced Studies), Hayama 240-0193
11
Department of Physics and Institute of Natural Sciences, Hanyang University, Seoul 04763
12
University of Hawaii, Honolulu, Hawaii 96822
13
High Energy Accelerator Research Organization (KEK), Tsukuba 305-0801
14
J-PARC Branch, KEK Theory Center, High Energy Accelerator Research Organization (KEK), Tsukuba 305-0801
15
Higher School of Economics (HSE), Moscow 101000
16
Forschungszentrum Jülich, 52425 Jülich
17
Indian Institute of Science Education and Research Mohali, SAS Nagar, 140306
18
Indian Institute of Technology Bhubaneswar, Satya Nagar 751007
19
Indian Institute of Technology Hyderabad, Telangana 502285
20
Indian Institute of Technology Madras, Chennai 600036
21
Indiana University, Bloomington, Indiana 47408
22
Institute of High Energy Physics, Chinese Academy of Sciences, Beijing 100049
23
Institute of High Energy Physics, Vienna 1050
24
Institute for High Energy Physics, Protvino 142281
25
INFN - Sezione di Napoli, 80126 Napoli
26
Advanced Science Research Center, Japan Atomic Energy Agency, Naka 319-1195
27
J. Stefan Institute, 1000 Ljubljana
28
Institut für Experimentelle Teilchenphysik, Karlsruher Institut für Technologie, 76131 Karlsruhe
arXiv:2005.07766v2 [hep-ex] 25 Apr 2021
29
Kennesaw State University, Kennesaw, Georgia 30144
30
Korea Institute of Science and Technology Information, Daejeon 34141
31
Korea University, Seoul 02841
32
Kyungpook National University, Daegu 41566
33
P.N. Lebedev Physical Institute of the Russian Academy of Sciences, Moscow 119991
34
Faculty of Mathematics and Physics, University of Ljubljana, 1000 Ljubljana
35
Ludwig Maximilians University, 80539 Munich
36
Luther College, Decorah, Iowa 52101
37
Malaviya National Institute of Technology Jaipur, Jaipur 302017
38
University of Maribor, 2000 Maribor
39
Max-Planck-Institut für Physik, 80805 München
40
School of Physics, University of Melbourne, Victoria 3010
41
University of Mississippi, University, Mississippi 38677
42
University of Miyazaki, Miyazaki 889-2192
43
Moscow Physical Engineering Institute, Moscow 115409
44
Graduate School of Science, Nagoya University, Nagoya 464-8602
45
Università di Napoli Federico II, 80055 Napoli
46
Nara Women’s University, Nara 630-8506
47
National Central University, Chung-li 32054
48
National United University, Miao Li 36003
49
Department of Physics, National Taiwan University, Taipei 10617
50
H. Niewodniczanski Institute of Nuclear Physics, Krakow 31-342
51
Nippon Dental University, Niigata 951-8580
52
Niigata University, Niigata 950-2181
53
Novosibirsk State University, Novosibirsk 630090
54
Osaka City University, Osaka 558-8585
55
Pacific Northwest National Laboratory, Richland, Washington 99352
56
Panjab University, Chandigarh 160014
57
Peking University, Beijing 100871
58
University of Pittsburgh, Pittsburgh, Pennsylvania 15260
59
Punjab Agricultural University, Ludhiana 141004
60
Theoretical Research Division, Nishina Center, RIKEN, Saitama 351-0198
61
University of Science and Technology of China, Hefei 230026
62
Seoul National University, Seoul 08826
63
Showa Pharmaceutical University, Tokyo 194-8543
64
Soochow University, Suzhou 215006
65
Soongsil University, Seoul 06978
66
University of South Carolina, Columbia, South Carolina 29208
67
Sungkyunkwan University, Suwon 16419
68
School of Physics, University of Sydney, New South Wales 2006
69
Department of Physics, Faculty of Science, University of Tabuk, Tabuk 71451
70
Tata Institute of Fundamental Research, Mumbai 400005
71
Toho University, Funabashi 274-8510
72
Department of Physics, Tohoku University, Sendai 980-8578
73
Earthquake Research Institute, University of Tokyo, Tokyo 113-0032
74
Department of Physics, University of Tokyo, Tokyo 113-0033
75
Tokyo Institute of Technology, Tokyo 152-8550
76
Tokyo Metropolitan University, Tokyo 192-0397
77
Virginia Polytechnic Institute and State University, Blacksburg, Virginia 24061
78
Wayne State University, Detroit, Michigan 48202
79
Yamagata University, Yamagata 990-8560
80
Yonsei University, Seoul 03722
81
University of the Basque Country UPV/EHU, 48080 Bilbao
82
IKERBASQUE, Basque Foundation for Science, 48013 Bilbao
We present an analysis of the exclusive
B+ →π+π−`+ν`decay, where
`represents an electron
or a muon, with the assumption of charge-conjugation symmetry and lepton universality. The
analysis uses the full
Υ(4S)data sample collected by the Belle detector, corresponding to 711 fb
−1of integrated luminosity. We select the events by fully reconstructing one
Bmeson in hadronic
decay modes, subsequently determining the properties of the other
Bmeson. We extract the signal
yields using a binned maximum-likelihood fit to the missing-mass squared distribution in bins of the
invariant mass of the two pions or the momentum transfer squared. We measure a total branching
fraction of
B(B+→π+π−`+ν`) = [22.7+1.9−1.6(stat)±3.5(syst)]×10−5, where the uncertainties are
statistical and systematic, respectively. This result is the first reported measurement of this decay.
PACS numbers: 12.15.-y, 13.20.He, 13.20.-v, 14.40.Nd Keywords:
I. INTRODUCTION
The reported measurements of exclusive semileptonic b → u`ν
`decays, with ` either a muon or electron, do not saturate the inclusive charmless semileptonic b → u`ν
`decay rate. Summing up all observed exclu- sive modes, only about 25% of the inclusive rate can be accounted for [1]. The remaining modes pose a sizeable source of systematic uncertainty on inclusive and exclu- sive semileptonic b → u`ν
`measurements or in decays in which such processes constitute important backgrounds.
The absolute value of the Cabibbo-Kobayashi-Maskawa (CKM) matrix element |V
ub| [2, 3] can be precisely deter- mined by combining measured branching fractions with predictions for the total rate. Three direct methods are considered as mature at the present time: first, combin- ing the measured branching fraction of B → π`¯ ν
`with lattice quantum chromodynamics (QCD) information to determine |V
ub| and the non-perturbative form factors in a global fit [1, 4]; second, measurement of the inclusive charmless semileptonic branching fraction, which is com- bined with calculations of the decay rate at NNLO in QCD plus non-perturbative parameters, determined in global fits to b → c semileptonic decays [1, 4]; and last, combining the measured ratio of branching fractions of Λ
b→ p`¯ ν
`and Λ
b→ Λ
c`¯ ν
`with lattice QCD informa- tion to extract the ratio |V
ub|/|V
cb| [5]. The determi- nations from the exclusive and inclusive approaches are only marginally compatible, resulting in a difference more than two standard deviations [6]. A fourth method is the indirect determination of |V
ub| with combining angles and other measurements characterizing the unitarity triangle.
This indirect method is carried out by such groups as CKMfitter [7] and UTfit [8]. The values determined in these fits favor the exclusive result.
In this paper, we present the first measurement of the branching fraction of the exclusive channel B
+→ π
+π
−`
+ν
`, where ` represents electrons and muons, and charge-conjugation symmetry and lepton universality are assumed. This channel is of particular interest, as the π
+π
−system receives contributions from nonresonant and various resonant states, giving rise to a rich spectroscopy of the system. In this manner, it can serve as a probe to inspect the internal structure of light mesons decaying to a charged-pion pair, given that in semileptonic decays the hadronic and leptonic currents can be treated independently because the lat- ter are not affected by the strong force [9]. Measure- ments of branching fractions of this decay will improve the calculation of the B → ππ form factors, which are an essential hadronic input for other processes such as the rare flavor-changing-neutral-current decay B → ππ`
+`
−and to hadronic decays such as B → πππ [10, 11]. The resonant channel B
+→ ρ
0`
+ν
`, which contributes to the
B
+→ π
+π
−`
+ν
`final state, has been measured by the CLEO [12], Belle [13, 14], and BaBar [15] collabora- tions. All these results focus on reconstructing the res- onant ρ
0final state and do not measure the full π
+π
−invariant-mass spectrum. The exclusive measurement of the B
+→ π
+π
−`
+ν
`decay presented in this paper ex- tends these previous studies. Furthermore, more pre- cise knowledge of the nonresonant π
+π
−contributions will help improve future measurements of the ρ
0final state [16]. With the rapid progress of lattice QCD, we are hopeful that the measured B
+→ π
+π
−`
+ν
`branch- ing fraction and future measurements at Belle II will pro- vide a new avenue to determine |V
ub|, which is expected to reach a precision at the 2% level [17].
II. DETECTOR, DATA SET, AND MONTE CARLO SIMULATION
The Belle detector is a large-solid-angle magnetic spec- trometer consisting of a silicon vertex detector (SVD), a 50-layer central drift chamber (CDC), an array of aero- gel threshold Cherenkov counters (ACC), a barrel-like ar- rangement of time-of-flight scintillation counters (TOF), and an electromagnetic calorimeter comprised of CsI(Tl) crystals (ECL) located inside a superconducting solenoid coil that provides a 1.5 T magnetic field. An iron flux- return located outside of the coil is instrumented to de- tect K
L0mesons and to identify muons (KLM). The de- tector is described in detail elsewhere [18].
We use the entire Belle Υ(4S) data sample of 711 fb
−1collected at the KEKB asymmetric-energy e
+e
−collider [19]. The sample contains (772 ± 11) × 10
6e
+e
−→ Υ(4S) → B B ¯ events. The Belle detector used two inner detector configurations in the course of the ex- periment. The first arrangement consisted of a 2.0-cm- radius beampipe, and a three-layer silicon vertex detector used to collect a sample of 152 × 10
6B B ¯ pairs, while the second comprised a 1.5-cm-radius beampipe, a four-layer silicon detector, and a small-cell inner drift chamber em- ployed to record the remaining 620 × 10
6B B ¯ pairs [20].
Monte Carlo (MC) simulated samples are generated
using the EvtGen [21] package, and the response of the
detector is modeled using GEANT3 [22]. We account
for final-state radiation (FSR) effects from charged par-
ticles by using the PHOTOS package [23, 24]. A sample
of Υ(4S) → B B ¯ events, where the B meson decays en-
tirely via the dominating quark-level transition b → cW
(generic B decays), was generated with a size equivalent
to ten times the integrated luminosity of the data sam-
ple. Continuum events of the form e
+e
−→ q¯ q, where
q denotes u, d, s, or c quarks, were simulated using
PYTHIA6.4 [25] in a sample containing six times the in-
tegrated luminosity of the data sample. Charmless rare
B decays, occurring among others via loop transitions
such as b → s quark transition or via radiative decays, are generated with a sample size corresponding to 50 times the integrated luminosity of the data sample.
The signal B
+→ π
+π
−`
+ν
`sample is produced with the phase-space (PHSP) model of EvtGen, to make sure that every point in phase space is populated, in- dependent of whether or not it can be reached by an intermediate resonance. Given that branching frac- tion estimations for the B
+→ π
+π
−`
+ν
`decay in the entire phase space are not available from either lat- tice QCD or QCD sum-rule calculations, we assumed a branching fraction of 31.7 × 10
−5according to ref- erence [26] using |V
ub|/|V
cb| = 0.083 ± 0.006 [5]. We generate 100 million B B ¯ events, with one B me- son decaying generically and the other through the B
+→ π
+π
−`
+ν
`channel. Various exclusive semilep- tonic decays proceeding through the Cabibbo-suppressed transition b → u`ν
`at quark level were produced with a sample size equivalent to 20 times the integrated lumi- nosity of the data. This sample contains the following de- cays: B
+→ π
0`
+ν
`, B
+→ η`
+ν
`, B
+→ η
0`
+ν
`, B
+→ ω`
+ν
`, B
+→ a
0(980)
0`
+ν
`, B
+→ a
1(1260)
0`
+ν
`, B
+→ a
2(1320)
0`
+ν
`, B
+→ b
1(1235)
0`
+ν
`, B
+→ f
1(1285)`
+ν
`, B
+→ f
20(1525)`
+ν
`, B
0→ ρ
−`
+ν
`, B
0→ π
−`
+ν
`, B
0→ a
0(980)
−`
+ν
`, B
0→ a
1(1260)
−`
+ν
`, B
0→ a
2(1320)
−`
+ν
`, and B
0→ b
1(1235)
−`
+ν
`. These decays are generated using form factor calculations from ISGW2 [27] and light-cone sum rules (LCSR) [28]. We do not consider an inclusive component since the V
ubgenerator [29], used to model this contribution, incor- rectly describes nonresonant states in the entire phase space. High-multiplicity mass terms that can contribute to the nonresonant component come from decays such as B
+→ π
+π
−π
0`
+ν
`and B
+→ π
+π
−π
0π
0`
+ν
`. How- ever, after simulating these processes with the PHSP gen- erator and examining their contributions after the full se- lection, they are found to be negligible and thus are not considered further in this analysis.
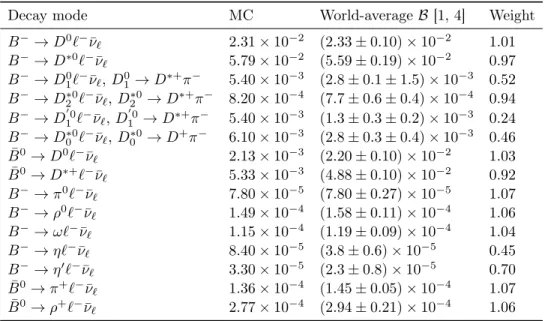
We set the branching fractions of the decays B → D`ν
`, B → D
∗`ν
`, B → D
1`ν
`, B → D
10`ν
`, B → D
∗2`ν
`, B → D
0∗`ν
`, and of the known exclusive charmless semileptonic B decays to the latest experimental av- erages [1]. We reweight the Caprini-Lellouch-Neubert (CLN)-based form factors [30] of the decays B → D
(∗)`ν
`to the recent world-average values [4], and the form fac- tors of the B → D
∗∗`ν
`decay according to the model of Leibovich-Ligeti-Stewart-Wise (LLSW) [31]. We also correct the MC for the efficiency of particle identification of charged tracks, derived from studies using control sam- ples for known processes, as described later in the section about systematic uncertainties associated to the detector simulation. These corrections depend on the kinematics of the particles involved.
III. EVENT SELECTION
This analysis employs a full reconstruction tech- nique [32] based on the NeuroBayes neural-network pack- age [33], in which we reconstruct one B meson (B
tag) stemming from the Υ(4S) resonance in 1104 hadronic modes. This tagging technique allows one to determine the properties of the other B meson (B
sig) from kinematic constraints via conservation laws. Subsequently, we re- construct the B
sigusing the rest of the event, except for the neutrino, which is invisible to the detector.
To filter B B ¯ events from non-hadronic background such as two-photon, radiative Bhabha, and τ
+τ
−pro- cesses, we implement a selection based on charged-track multiplicity and the total visible energy [34]. Afterward, to reject continuum events, we add 18 modified Fox- Wolfram [35] moment variables to the NeuroBayes neural network used in the reconstruction of the B
tag. The out- put classifier o
cstagof the algorithm ranges from zero to unity, with higher values indicating a higher probabil- ity of correctly reconstructing a B meson with low con- tamination of continuum events. We retain candidates with ln o
cstag> −4.9 to ensure good quality of the B
tagcandidate. This requirement is optimized using a figure- of-merit N
S/ √
N
S+ N
B, where N
Sand N
Bare the ex- pected number of events from MC for signal and back- ground, respectively. With this selection criterion, we attain a tag-side efficiency of 0.1% and a tag-side purity of around 23% for charged B mesons reconstructed with the full hadronic tagging algorithm. Differences in the tagging efficiency between data and MC have been eval- uated in reference [14]; they depend on the value of the network output and the B
tagreconstructed channel. We take an event-by-event correction factor from this study, derived from a control sample of B → D
(∗)`ν decays on the signal side, to account for these discrepancies.
We require the beam-constrained mass, M
bc=
q
E
beam2−
~ p
Btag2
, to be greater than 5.27 GeV [36]. Here, E
beamand p ~
Btagare the beam energy and the three-momentum of the B
tagcandidate in the Υ(4S) frame, respectively. We select only charged B
tagcandidates since the signal mode only involves charged B mesons.
The charged particles and neutral clusters in the event
not associated with the B
tagcandidate are used in the
reconstruction of the B
sigcandidate. Due to the mag-
netic field inside the detector, charged particles with low
momenta spiral inside the CDC and may lead to multiple
track candidates for the same particle. A pair of tracks
is regarded as duplicated if they have momenta trans-
verse to the beam direction below 275 MeV, with a small
momentum difference (below 100 MeV) and an opening
angle either below 15
◦(same charges) or above 165
◦(op-
posite charges). Once such a pair is identified, the track
with the smaller value of the quantity (5 × |dr|)
2+ |dz|
2is kept, with |dr| and |dz| denoting the distance of clos-
est approach of a given track to the interaction point
(IP) in the plane perpendicular to the beam direction, or along the beam direction, respectively. This criterion was optimized using simulated tracks. In addition, we impose that all selected tracks satisfy |dr| < 0.4 cm and
|dz| < 2.0 cm.
We identify charged hadrons using the ionization en- ergy loss dE/dx in the CDC, the time-of-flight in the TOF, and the Cherenkov light in the ACC [37]. The selection of charged pions in this analysis has an identifi- cation efficiency of 85% and a kaon misidentification rate of 13%.
In this analysis, we only consider events with a sin- gle charged-lepton candidate on the signal side. Elec- tron candidates are identified based on the ratio of the ECL energy to that of the CDC track, the ECL shower shape, the position matching between the CDC track and the ECL cluster, the energy loss in the CDC, and the response of the ACC [38]. Furthermore, we re- quire electrons to have a minimum momentum of 0.3 GeV in the laboratory frame. Muon candidates are selected using their penetration range and transverse scattering in the KLM [39], and requiring a minimum momentum of 0.6 GeV in the laboratory frame. In the momen- tum region relevant to this analysis, the average electron (muon) identification efficiency is about 87% (89%), and the probability of misidentifying a pion as an electron (muon) is 0.15% (1.3%). We veto charged leptons from photon conversion in the detector material and from J/ψ and ψ(2S) decays if the lepton candidate, when combined with an oppositely charged particle, gives an invariant mass M
``satisfying the following conditions: M
``< 0.1 GeV, M
``∈ [3.00, 3.15] GeV, or M
``∈ [3.60, 3.75] GeV.
We reconstruct photons as clusters in the ECL not linked to a track in the CDC. To reject low-energy pho- tons originating from background caused by the beam circulation, we require a minimum energy of 50 MeV, 100 MeV, and 150 MeV in the barrel, the forward endcap, and the backward endcap of the ECL, respectively. We reconstruct neutral pions from pairs of photons with an invariant mass in the range 120-150 MeV. The photons forming a neutral pion candidate are rejected from the one to be linked to a charged track. In electron events, we take into account possible Bremsstrahlung from the elec- tron by searching for low-energy photons (E
γ< 1 GeV) within a 5
◦cone around the lepton direction. If such a photon is found, it is merged with the electron and the sum of the momenta is taken to be the lepton momen- tum. If there is more than one photon candidate, only the nearest photon is merged with the electron.
IV. SIGNAL SELECTION AND BACKGROUND SUPPRESSION
After applying the above criteria, we reconstruct the signal decay B
+→ π
+π
−`
+ν
`from the tracks not as- sociated with B
tag−. In this manner, we require exactly three tracks on the signal side, the two charged pions
and the lepton. Given that the neutrino is invisible to the detector, we infer its four-momentum from the miss- ing momentum of the event, defined as
P
miss= P
Υ(4S)− P
B±tag
− P
`∓− P
π+− P
π−, (1) where P
iis the four-momentum of particle i = Υ(4S), B
tag−, `, π
+, π
−. We determine the missing-mass squared, M
miss2= P
miss2, to separate semileptonic de- cays from other processes. For correctly reconstructed semileptonic decays, M
miss2sharply peaks at 0, whereas other processes have a shoulder typically at positive val- ues.
At this point in the reconstruction, the dominant back- ground processes come from semileptonic B decays to charmed mesons whose kinematic distributions resem- ble those of the signal. To suppress this background, we train a boosted decision tree (BDT) to recognize B
+→ π
+π
−`
+ν
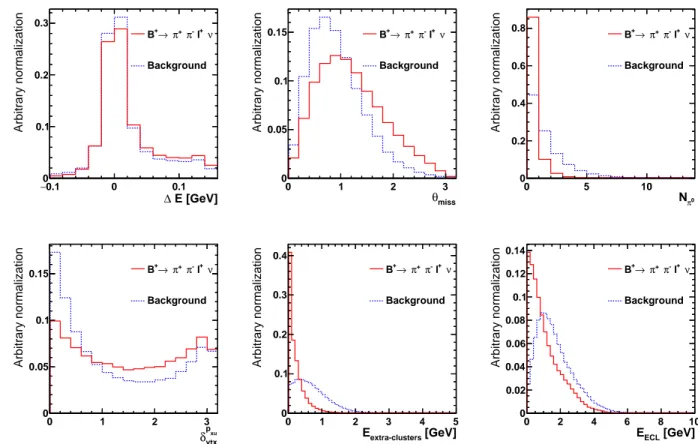
`decays and identify B-meson decays into other final states. This BDT is coincidentially also effective against other backgrounds such as continuum, rare and charmless semileptonic B decays. A statisti- cally independent two sets of MC samples for signal and background are prepared. One set is used to train BDT with the stochastic gradient boosting approach from the TMVA software package [40], which combines the bag- gings and boosting algorithms. Another one set is used for validation of the training. The following input vari- ables are used:
1. ∆E
sig: the difference between the beam and the B
sigmeson energies in the center-of-mass system (c.m.), which is calculated using the B
tagmeson,
∆E
sig= −∆E
tag= −(E
beam− E
Btag).
2. θ
miss: the polar angle of the missing momentum in the laboratory frame.
3. N
π0: the multiplicity of π
0candidates on the signal side.
4. δ
pvtxxu: the angle between the signal-side π
+π
−mo- mentum and the vector connecting the IP and the π
+π
−decay vertex calculated in the laboratory frame. The distance of the π
+π
−-system to the IP for charmless intermediate states is smaller than that for two-track pairs associated with D
0and K
S0mesons. Thus the angle δ
pvtxxuis useful in reducing these background processes.
5. E
extra-clusters: the total c.m. energy of photons within the barrel region not associated with either the B
tagor B
sigcandidates.
6. E
ECL: the sum of the clusters in the ECL from
the whole event not matching tracks and that pass
the energy thresholds for photons. This calcula-
tion also includes ECL clusters made by photons
that were incorrectly associated with a track and
E [GeV]
0.1 ∆
− 0 0.1
Arbitrary normalization
0 0.1 0.2 0.3
ν l+
π-
π+
→ B+
Background
θmiss
0 1 2 3
Arbitrary normalization
0 0.05 0.1
0.15 B+→π+π- l+ν
Background
π0
N
0 5 10
Arbitrary normalization
0 0.2 0.4 0.6
0.8 B+→π+π- l+ν
Background
pxu
δvtx
0 1 2 3
Arbitrary normalization
0 0.05 0.1
0.15 B+→π+π- l+ν Background
[GeV]
extra-clusters
E
0 1 2 3 4 5
Arbitrary normalization
0 0.1 0.2 0.3 0.4
ν l+
π-
π+
→ B+
Background
[GeV]
EECL
0 2 4 6 8 10
Arbitrary normalization
0 0.02 0.04 0.06 0.08 0.1 0.12 0.14
ν l+
π-
π+
→ B+
Background
FIG. 1: Shape comparison of the input variables of the BDT before the selection on O
BDTfor simulated signal and background events.
that satisfy E9/E25 > 0.94. The E9/E25 variable quantifies the transverse shower shape in the ECL, defined as the ratio of energy deposited in the 3 ×3 array of crystals centered on the track to that in the corresponding 5 ×5 array of crystals. This vari- able is suitable to separate overlapping hits in the ECL crystals caused by hadronic interaction with charged tracks and photons. For photons E9/E25 peaks at one, whereas for charged tracks it tends to have lower values.
Distributions of the above variables for signal and back- ground (with arbitrary normalizations) are shown in Fig. 1.
We choose a selection criterion on the BDT output classifier by optimizing a figure-of-merit N
S/ √
N
S+ N
B. The distributions of the BDT classifier O
BDTfor the sig- nal, B-meson decays to charm mesons and other back- grounds, as well as the selection criterion (O
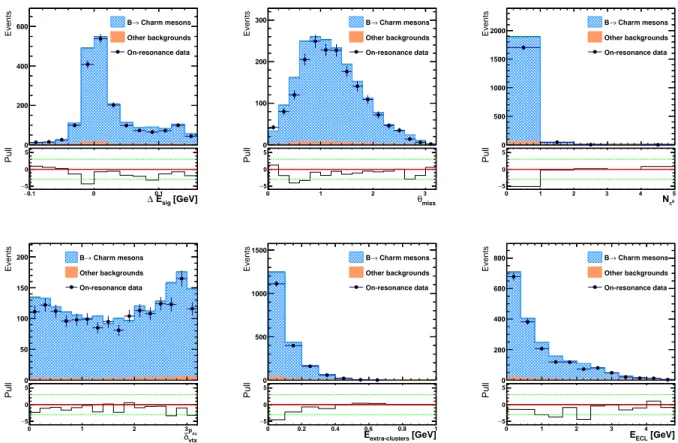
BDT> 0.52), are shown in Fig. 2. We validate the description of the variables used in the BDT using the sideband of the missing-mass squared distribution, defined as M
miss2>
2 GeV
2. These distributions are shown in Fig. 3.
OBDT
−1 −0.5 0 0.5 1
Arbitrary normalization
0 0.02 0.04
0.06 B+→π+π-l+ν
charm decays
→ B
Other background
FIG. 2: Shapes of the BDT output for the signal and the major background processes, as predicted by MC.
The vertical line shows the minimum requirement on this variable, obtained from optimizing a figure-of-merit N
S/ √
N
S+ N
B.
V. SIGNAL EXTRACTION
We perform a binned extended maximum-likelihood fit
to the M
miss2spectrum using histogram templates derived
from MC simulation to determine the signal yields. We
use a bin width of 0.2 GeV
2in the range [−1.0, 6.0] GeV
2.
Because of the negligible contribution of the continuum,
E [GeV]
0.1 ∆
− 0 0.1
Events
0 200 400
600 B→ Charm mesons
Other backgrounds On-resonance data
[GeV]
Esig 0.1 ∆
− 0 0.1
Pull
−5 0 5
θmiss
0 1 2 3
Events
0 100 200
300 B→ Charm mesons
Other backgrounds On-resonance data
θmiss
0 1 2 3
Pull
−5 0 5
π0
N
0 1 2 3 4 5
Events
0 500 1000 1500 2000
Charm mesons
→ B
Other backgrounds On-resonance data
π0
0 1 2 3 4 N5
Pull
−5 0 5
pxu
δvtx
0 1 2 3
Events
0 50 100 150
200 B→ Charm mesons
Other backgrounds On-resonance data
pxu
δvtx
0 1 2 3
Pull
−5 0
5 Eextra-clusters [GeV]
0 0.2 0.4 0.6 0.8 1
Events
0 500 1000 1500
Charm mesons
→ B
Other backgrounds On-resonance data
[GeV]
extra-clusters
0 0.2 0.4 E0.6 0.8 1
Pull
−5 0
5 EECL [GeV]
0 1 2 3 4
Events
0 200 400 600
800 B→ Charm mesons
Other backgrounds On-resonance data
[GeV]
EECL
0 1 2 3 4
Pull
−5 0 5
FIG. 3: Distributions of the input variables of the BDT in the sidebands of the missing-mass squared, after the selection on O
BDT. The shaded histogram shows the contribution from B decays to charm mesons, while the solid histogram shows the contributions from other processes. The pull values are presented underneath each plot to display the difference of the data relative to the MC. The MC are normalized to the corresponding integrated luminosity.
b → u`ν, and rare b → s decay processes, we combine these into a single component and fix their event yields to the MC expectation (referred to as fixed background in the following). We thus distinguish among three com- ponents in our fit:
1. the signal B
+→ π
+π
−`
+ν
`,
2. B → X
c`ν, where X
cis a charm meson, and 3. the fixed background,
where yields of the first two components are floated in the fit.
To allow for a B
+→ π
+π
−`
+ν
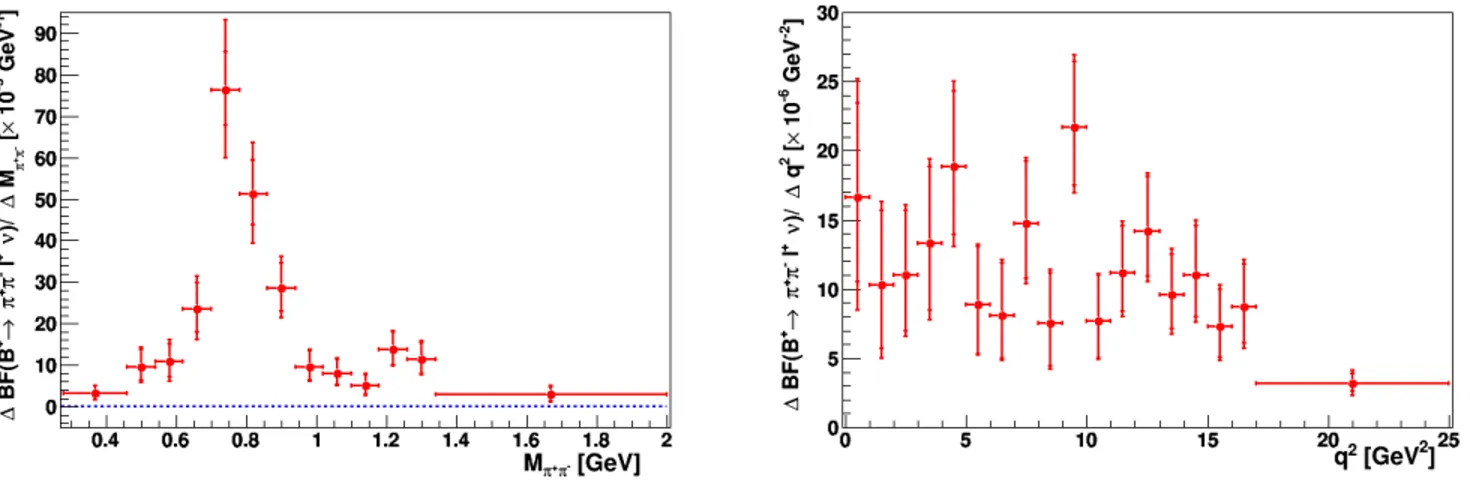
`decay-model- independent interpretation of the result, we analyze the measured yields in bins of M
ππ= p
(P
π++ P
π−)
2and q
2= (P
`+ P
ν`)
2using three fit configurations. The min- imum value for M
ππcorresponds to twice the mass of a charged pion, that is 0.28 GeV, whereas the maxi- mum value is about the mass of the B
±meson, which is approximately 5.28 GeV. On the other hand, q
2ranges from 0 GeV
2to approximately 25 GeV
2. The first configuration employs a fit of the dipion invariant- mass spectrum, referred to as 1D(M
ππ) in the follow-
ing. In the second configuration, abbreviated as 2D, we carry out a two-dimensional analysis and measure par- tial branching fractions in bins of M
ππand q
2. Finally, in the third configuration we perform the measurement in bins of q
2, and denote this configuration as 1D(q
2).
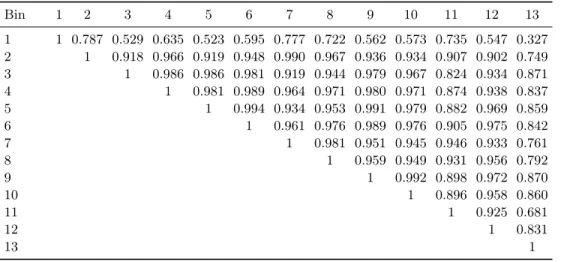
We use 13 bins in the 1D(M
ππ) configuration, consisting of 11 bins with a uniform width in the dipion mass of 80 MeV, and two additional bins corresponding to the low dipion mass (M
π+π−< 0.46 GeV) and the high di- pion mass (M
π+π−> 1.34 GeV) regions. In the 1D(q
2) configuration, we employ 17 bins with a uniform width of 1 GeV
2and an additional bin accounting for the re- gion q
2> 17 GeV
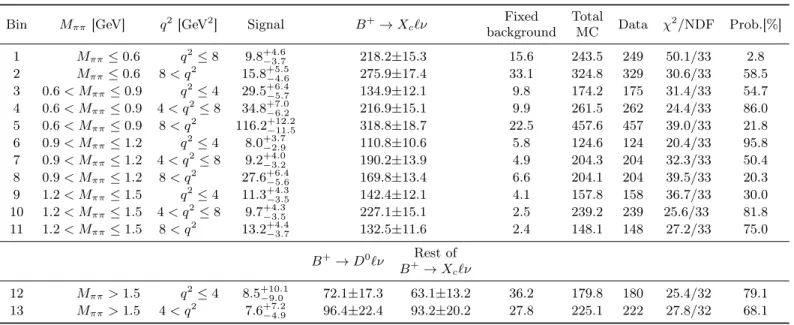
2. In the 2D configuration, we em- ploy five bins of 300 MeV in the dipion mass and, de- pending on the size of the data sample for these regions, we split the q
2spectrum into either two or three bins.
Hence, for M
π+π−< 0.6 GeV we use q
2≤ 8 GeV
2and
q
2> 8 GeV
2; for M
π+π−> 1.5 GeV we use q
2≤ 4 GeV
2and q
2> 4 GeV
2. For the remaining M
π+π−bins,
we separate q
2into three regions: q
2≤ 4 GeV
2,
4 < q
2[GeV
2] ≤ 8, and q
2> 8 GeV
2. For the highest
bin in the 1D(M
ππ) configuration (M
π+π−> 1.34 GeV),
we separate the B → X
c`ν background into two com-
2] [GeV
2
Mmiss
0 2 4 6
) 2 Events/(0.2 GeV
0 10 20
30
M
π+π-≤ 0.62 GeV
2] [GeV
2
Mmiss
0 2 4 6
Pull
−20
2 0 2 4 M2miss [GeV2] 6
) 2 Events/(0.2 GeV
0 20 40 60 80 100
0.94 GeV
≤
π-
π+
0.62 GeV < M
2] [GeV
2
Mmiss
0 2 4 6
Pull
−20 2
2] [GeV
2
Mmiss
0 2 4 6
) 2 Events/(0.2 GeV
0 20 40 60 80 100 120
> 0.94 GeV
π-
π+
M
2] [GeV
2
Mmiss
0 2 4 6
Pull
−20 2
ν l
+π
-π
+→ B
+ν l
+X
c→ B
Fixed background Data
FIG. 4: Projection of the 1D(M
ππ) configuration fit results in the M
miss2distribution (points with error bars) in three regions of the dipion mass as labeled: (upper left) low-mass region (M
π+π−≤ 0.62 GeV), (upper right) around the ρ
0meson (0.62 GeV < M
π+π−≤ 0.94 GeV) and (lower left) high-mass region (M
π+π−> 0.94 GeV). The fit components are shown as the colored histograms as given in the lower right. The pull values are presented underneath each plot to display the accuracy of the fit relative to the data. The peaking structure in the fixed background around the signal region in the high dipion mass range is due to the B
+→ D ¯
0(π
+π
−)`
+ν
`decay.
ponents: one containing B meson decays to D
0mesons as a cross-feed (B → D
0`ν), and another involving the remaining charmed mesons (rest of B → X
c`ν). The decay B
+→ D ¯
0`
+ν
`with D
0→ π
+π
−also peaks at M
miss2≈ 0 GeV
2in the dipion mass (M
π+π−) region from 1.85 GeV to 1.88 GeV, with relatively small con- tamination from other processes. In this mass window, we measure B(B
+→ D ¯
0`
+ν
`) = (2.83 ± 0.54)%, where the uncertainty is only statistical, and the result is com- patible with the world average B(B
+→ D ¯
0`
+ν
`)
PDG= (2.33 ± 0.10)% [1]. We fix this component in MC ac- cording to the measured event yield in data and add it to the fixed background shape and yield. The detector resolution for the dipion mass and q
2are about 4 MeV and 5 × 10
−2GeV
2, respectively. These values are sig- nificantly smaller than the bin sizes used in our measure- ment, and hence no additional corrections to account for migrations between the reconstructed bins are applied.
Figure 4 shows the projection of the fit results in the 1D(M
ππ) configuration in three regions of the di- pion mass: a low-mass region (M
π+π−≤ 0.62 GeV),
an intermediate-mass region dominated by the ρ
0me-
son (0.62 < M
π+π−[GeV] ≤ 0.94), and a high-mass re-
gion (M
π+π−> 0.94 GeV) where we can also observe
contributions from the B
+→ D ¯
0(π
+π
−)`
+ν
`decay. Ta-
bles I, II, and III present the fit results for every bin
in the three configurations. In these tables, we provide
the χ
2value and number of degrees of freedom to verify
the goodness of fit, following the χ
2calculation of Baker
and Cousins [41], which applies to fits derived from a
maximum-likelihood method where the data obey Pois-
son statistics. The fit procedure was validated by gener-
ating an ensemble of pseudoexperiments using the fitted
number of signal and background events in each of the
bins. No bias in the coverage of the reported uncertain-
ties was observed. The recovered central values show
a small bias, which we include into the systematic un-
certainties (discussed in the next section). To validate
our measurement, we used control samples following a
selection procedure similar to that implemented for the
signal. For that purpose, we study four channels in the
B
+→ D ¯
0`
+ν
`decay, with the D
0meson reconstructed
as a combination of two charged hadrons and the possi- bility to include a neutral pion: K
−π
+, K
−K
+, π
+π
−π
0and K
−π
+π
0. The measured branching fractions are in agreement with the world averages [1].
VI. SYSTEMATIC UNCERTAINTIES
The sources of systematic uncertainties considered in this analysis fall into three categories: those related to detector performance, those due to the modeling of the signal and background processes, and uncertainties asso- ciated with the fitting procedure. In most cases, we esti- mate the systematic uncertainties by varying each fixed parameter in the simulation by one standard deviation up and down (±1σ) and repeating the fit to the M
miss2dis- tribution. We then take the relative difference between the signal yield from the nominal fit and that with the parameter varied as the ±1σ systematic uncertainty. We calculate these uncertainties separately for each bin in our measurement.
A. Signal and background modeling
The sources of uncertainties related to the modeling of physical processes include the lack of precise knowledge of hadronic form factors that describe a specific decay, and the relative contributions of background processes.
To assess the systematic uncertainty arising from the sig- nal modeling, we compare the signal reconstruction effi- ciency calculated for each bin in M
ππ, q
2, or (M
ππ, q
2), using the phase space B
+→ π
+π
−`
+ν
`and other B semileptonic channels with an intermediate resonance de- caying to a π
+π
−pair. As these channels simulate the same final state, the resulting efficiencies should be sim- ilar. Nonetheless, resonances do not span as much of the domain in the phase space as an inclusive simula- tion since they have a finite width; hence their cover- age in the dipion mass is essentially limited to the in- terval [M
R− 2Γ
R, M
R+ 2Γ
R], with M
Rthe nominal mass of the resonance and Γ
Rits decay width. The range of q
2varies with the resonant state as the maxi- mum value depends on the mass of the resonance through q
2max= (M
B−M
R)
2, where M
Bis the mass of the B me- son. We thus simulate semileptonic B decays with four intermediate resonances covering the phase space of the B
+→ π
+π
−`
+ν
`decay, namely f
0(500), ρ
0, f
2(1270), and ρ
0(1450), and produce these with the phase space and ISGW2 [27] models. Furthermore, we use form fac- tors from light-cone sum rule (LCSR) calculations for the B
+→ ρ
0`
+ν
`and the B
+→ f
2(1270)`
+ν
`decays according to references [28] and [42], respectively. We calculate the root mean square error between the nom- inal efficiency (phase space B
+→ π
+π
−`
+ν
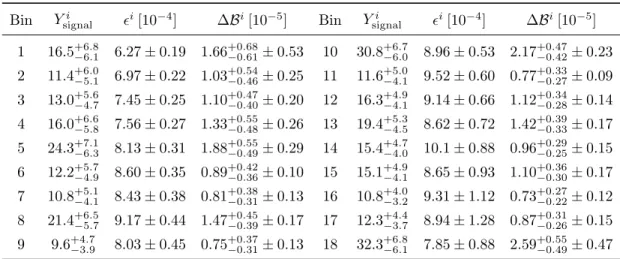
`) and the resonant models valid for a given bin as the system- atic uncertainty due to signal modeling. In addition, we also consider the finite size of the sample used to esti-
mate the signal reconstruction efficiency. We include this (statistics-based) error in the systematic uncertainty due to reconstruction efficiency. The values of the efficiencies used for this assessment are presented in the appendix in Tables A.1, A.2, and A.3 for the 1D(M
ππ), 1D(q
2), and 2D fit binning configurations, respectively.
Given that the continuum background is almost negli- gible after the selection, we compare the continuum MC with the off-resonance data using a loose selection to as- sign the uncertainty due to the description of this process.
Consequently, we determine an asymmetric variation in the continuum normalization (
+50%−20%) and repeat the fit with these changes. Contributions from rare decays are also very small. To evaluate their effect on our measure- ment, we carried out 1000 pseudoexperiments (using the same prescription described in the previous section) with and without this component. The systematic uncertainty is then derived from the difference in mean values from both ensembles for each bin. To assess the impact of the background shape on the calculation of the branch- ing fraction, we reweight a specific decay in the MC with another model. Specifically, we adjust the CLN-based form factors [30] of the B → D
∗`ν
`decays in the MC to the new world-average values [4]. Similarly, we reweight the form factors for the B → D
∗∗`ν
`decays from the ISGW2 [27] to the LLSW model [31]. In both cases, we add in quadrature the change in the branching fraction due to variation of each form factor to obtain a total un- certainty associated with these sources. The B → π`ν
`and B → ω`ν
`were generated in the MC with LCSR form factors taken from reference [28]. We reweight the B → ω`ν
`form factors to the calculation of [43] and use the difference in efficiencies compared to the nom- inal sample as the uncertainty. The B → π`ν
`form factors are reweighted to the Bourrely-Caprini-Lellouch model [44], which combines information from the mea- sured spectra, light-cone sum rules (valid at low q
2) and lattice QCD (valid at high q
2), and the same procedure to calculate the uncertainty is used. We also reweight the form factors of the B → η
(0)`ν
`decay from the ISGW2 [27] and LCSR models according to [45]. Other exclusive charmless semileptonic B decays considered in this analysis were generated with the ISGW2 model. As they do not have well-established form factors derived from QCD calculations, we compare their shapes with those produced using the phase space and FLATQ2 gen- erators [21, 46].
We correct the branching fractions of the B → (D
(∗,∗∗), π, η
(0), ω)`ν
`decay modes according to the world-averages [1] and vary these values within their measured uncertainties as presented in Table IV.
For the unmeasured exclusive charmless semileptonic B
decays, we assign a ±100% uncertainty in the variation
of the branching fraction. We modify the contribution of
the secondary leptons relative to the total uncertainty in
the measurement of the branching fraction of the decay
chain B
+→ X
c¯`
+ν
`with X
¯c→ `
−+ anything. To
consider the effect of the BDT selection on our result,
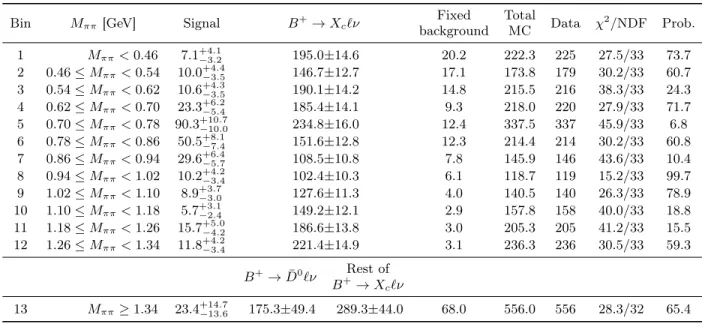
TABLE I: Event yields for the signal and background processes in the B
+→ π
+π
−`
+ν decay obtained from an extended binned maximum-likelihood fit to the M
miss2distribution in bins of M
π+π−. The χ
2, the number of degrees of freedom (NDF) and the probability of the fit (Prob.) are provided. The χ
2calculation is based on the
Baker-Cousins method [41].
Bin
Mππ[GeV] Signal
B+→Xc`νFixed
background Total
MC Data
χ2/NDFProb.
1
Mππ<0.467.1
+4.1−3.2 195.0±14.620.2 222.3 225 27.5/33 73.7 2
0.46≤Mππ<0.5410.0
+4.4−3.5 146.7±12.717.1 173.8 179 30.2/33 60.7 3
0.54≤Mππ<0.6210.6
+4.3−3.5 190.1±14.214.8 215.5 216 38.3/33 24.3 4
0.62≤Mππ<0.7023.3
+6.2−5.4 185.4±14.19.3 218.0 220 27.9/33 71.7
5
0.70≤Mππ<0.7890.3
+10.7−10.0 234.8±16.012.4 337.5 337 45.9/33 6.8
6
0.78≤Mππ<0.8650.5
+8.1−7.4 151.6±12.812.3 214.4 214 30.2/33 60.8 7
0.86≤Mππ<0.9429.6
+6.4−5.7 108.5±10.87.8 145.9 146 43.6/33 10.4 8
0.94≤Mππ<1.0210.2
+4.2−3.4 102.4±10.36.1 118.7 119 15.2/33 99.7 9
1.02≤Mππ<1.108.9
+3.7−3.0 127.6±11.34.0 140.5 140 26.3/33 78.9 10
1.10≤Mππ<1.185.7
+3.1−2.4 149.2±12.12.9 157.8 158 40.0/33 18.8 11
1.18≤Mππ<1.2615.7
+5.0−4.2 186.6±13.83.0 205.3 205 41.2/33 15.5 12
1.26≤Mππ<1.3411.8
+4.2−3.4 221.4±14.93.1 236.3 236 30.5/33 59.3
B+→D¯0`ν
Rest of
B+→Xc`ν