ATLAS-CONF-2012-120 15August2012
ATLAS NOTE
ATLAS-CONF-2012-120
August 14, 2012
Measurement of the charged particle spectra in Pb + Pb collisions at
√ s
NN= 2.76 TeVwith the ATLAS detector at the LHC
The ATLAS Collaboration
Abstract
The ATLAS experiment at the LHC has measured the production of charged hadrons in Pb+Pb collisions at
√sNN =
2.76 TeV as a function of transverse momentum (p
T) in the range 0.5–150 GeV and in the pseudorapidity range of
±2.5. The charged particle spectrameasured at di
fferent pseudorapidities are consistent with each other within the statistical and systematic uncertainties. The ratio of the central to peripheral events measured in the 0-5% and 60-80% centrality classes and scaled by the number of binary nucleon-nucleon collisions shows a suppression of charged hadrons by a factor of 5 at
pT=7 GeV. At higher
pTthe ratio increases with transverse momentum up to the highest measured
pT.
c
Copyright 2012 CERN for the benefit of the ATLAS Collaboration.
Reproduction of this article or parts of it is allowed as specified in the CC-BY-3.0 license.
1 Introduction
The study of inclusive charged hadron production at high transverse momentum ( p
T) is a way to under- stand the properties of the hot dense matter created in heavy ion (HI) collisions at high energy. The start of the LHC operation with heavy ions in 2010 made it possible to study HI collisions in a new energy regime with the help of the most modern particle detectors. The first results from the LHC experiments showed that the jets emerging from the medium created in such collisions do not retain their full en- ergy [1, 2]. Measurement of fully-reconstructed jets by the ATLAS experiment [3] revealed a factor of two suppression of jet yields in central collisions with respect to peripheral ones. These results indicate that high-energy partons su
ffer significant energy loss traversing the medium created in HI collisions.
Recent results from the CMS experiment studying photon-jet correlations [4] are a first step towards directly measuring the parton energy loss in HI collisions.
Important information about the parton energy loss mechanism can be obtained by studying jet frag- mentation. The first results from the LHC experiments [3, 5, 6] do not show significant modification of the fragmentation function for large longitudinal jet momentum fractions carried by the charged parti- cles. Measuring inclusive hadron production at high p
Toriginating from parton fragmentation is another approach to address the mechanism by which hard partons lose energy traversing the medium [7, 8]. The first results from the LHC experiments [9–11] established that the degree of particle suppression at the LHC is larger than measured at RHIC [12–15]. At p
Tof 6–7 GeV the suppression reaches a factor of 5 at
√s
NN =200 GeV and a factor of 7 at
√s
NN =2.76 TeV. At higher p
Tthe suppression diminishes as indicated by the RHIC data, and measured by the LHC experiments. Several theoretical models [16–18]
describe the behavior of the data at high transverse momentum. Some models suggest that the degree of suppression at very high p
Tshould saturate at a value below unity, while others predict that it will go back to a value of one.
The suppression in hadron production can be measured as a ratio of yields per nucleon-nucleon inter- actions in “head-on” HI collisions (collisions with small impact parameter) relative to those measured in p
+p collisions. The p
+p spectra can be approximated by the most glancing HI collisions. Heavy ions are extended objects, which impinge on each other with a random impact parameter, and thus collide with different degrees of overlap. This degree of overlap is referred to as the “centrality” of the collision.
Collisions with complete overlap are called central events, and as the distance between nuclear barycen- ters increases, the events become more and more peripheral. This note describes a measurement of the ratio of normalized yields in central and peripheral collisions as defined by the following equation:
R
CP= hNcolli(P) hNcolli(C)(1/N
evt,C)d
2N
C/dηdpT(1/N
evt,P)d
2N
P/dηdpT.(1)
Here
hNcolli(P) and
hNcolli(C) are the number of binary nucleon-nucleon collisions calculated for periph- eral and central collisions, respectively, as presented in section 3. A nucleon from one ion can interact with more than one nucleon of the other ion.
hNcollicounts the average number of nucleon-nucleon inter- actions. (1/N
evt,C)d
2N
C/dηd pTand (1/N
evt,P)d
2N
P/dηd pTare the di
fferential yields of charged particles per event for central and peripheral collisions, respectively.
This note presents a high statistics measurement of the charged hadron spectra and of R
CPin the mo- mentum range 0.5
<p
T <150 GeV in Pb
+Pb collisions using data obtained by the ATLAS experiment in the 2010 and 2011 HI physics runs of the LHC at
√s
NN =2.76 TeV.
2 The ATLAS detector
The measurements presented in this paper were performed using the ATLAS inner detector (ID),
calorimeter, muon spectrometer, trigger, and data acquisition systems [19]. The ID measures charged
particles within the pseudorapidity interval
|η| <2.5
1using a combination of silicon pixel detectors (Pixel), silicon microstrip detectors (SCT), and a straw tube transition radiation tracker (TRT), all im- mersed in a 2 T axial magnetic field. All three detector systems are composed of a barrel and two symmetrically placed end-cap sections. The Pixel is composed of three layers of sensors with nominal pixel size 50
µm×400
µm. The SCT barrel section contains four layers of double-sided modules with80
µm pitch sensors, while the end-caps consists of nine layers of double-sided modules with radial stripshaving a mean pitch of 80
µm. The two sides of each layer in both the barrel and the end-caps have arelative stereo angle of 40 mrad. The TRT contains up to 73 (160) layers of staggered straws interleaved with fibers (foils) in the barrel (end-cap). Charged particles with p
T &0.5 GeV and
|η|<2.5 will typi- cally traverse three layers of silicon pixel detectors, four layers of double-sided microstrip sensors, and 36 straws.
The calorimeter system consists of a liquid argon (LAr) electromagnetic (EM) calorimeter covering
|η|<
3.2, a steel-scintillator sampling hadronic calorimeter covering
|η|<1.7, a LAr hadronic calorimeter covering 1.5
< |η| <3.2, and two LAr forward calorimeters (FCal) covering 3.1
< |η| <4.9. The hadronic calorimeter has three longitudinal sampling layers and a
∆η×∆φgranularity of 0.1
×0.1 for
|η|<
2.5 and 0.2
×0.2 for 2.5
<|η|<4.9
2. The EM calorimeters are longitudinally segmented into three compartments with an additional pre-sampler layer. The EM calorimeter has a granularity that varies with layer and pseudorapidity, but which is generally much finer than that of the hadronic calorimeter. The middle sampling layer, which typically has the largest energy deposit in EM showers, has a granularity of 0.025
×0.025 over
|η|<2.5.
The minimum-bias trigger scintillator (MBTS) counters are located at a distance of 3.56 m along the beamline from the centre of the ATLAS detector, covering 2.1
< |η| <3.9 on each side. Each MBTS counter consists of 16 scintillating pads. The signals from the pads were used as an input to the trigger system in the 2010 run and the time di
fference between the two sides of MBTS was used to select good events in both the 2010 and 2011 runs.
The zero degree calorimeters (ZDC), each positioned at
|z| =140 m from the centre of the ATLAS detector, detect neutrons and photons with
|η| >8.3. The ZDC signals are used by the trigger systems.
The ZDC trigger thresholds were set just below the single neutron peak on each side.
The selection of events is done in several steps. First, an event has to fire a hardware-based level-1 (L1) trigger. The L1 trigger selects events with energy deposition in the calorimeters above a preset level, or events with signals from the ZDC. Such events are further processed by software-based high- level trigger. In the 2011 run the high-level trigger (HLT) performed full event reconstruction in relevant detector subsystems to select events. In the 2010 run no HLT was used.
3 Datasets
This analysis uses datasets collected with the ATLAS detector in the 2010 and 2011 Pb
+Pb runs of the LHC at
√s
NN =2.76 TeV. Only runs that passed standard run quality selection criteria were accepted.
In the 2010 run all events were collected with a minimum bias (MB) trigger requiring a coincidence of the ZDC signals on both sides of the ATLAS detector. In 2011, data were collected using several di
fferent trigger chains, called “streams”. The most relevant ones for this analysis are the “Minimum Bias” stream
3and the “Hard Probes” (HP) stream. Events selected for analysis in the 2011 MB stream
1ATLAS uses a right-handed coordinate system with its origin at the nominal interaction point (IP) in the centre of the detector and thez-axis along the beam pipe. Thex-axis points from the IP to the centre of the LHC ring, and theyaxis points upward. Cylindrical coordinates (r, φ) are used in the transverse plane,φbeing the azimuthal angle around the beam pipe. The pseudorapidity is defined in terms of the polar angleθasη=−ln tan(θ/2).
2An exception is the third sampling layer that has a segmentation of 0.2×0.1 up to|η|=1.7.
3Only events triggered by the MB trigger, satisfying MB event selection criteria were used in the analysis of the Minimum Bias stream, therefore the acronym MB applies to both stream and trigger.
satisfy one of the two following criteria: (1) events were accepted if the transverse energy deposition in the calorimeters E
Texceeded 50 GeV at L1; (2) events with lower E
T, in which the ZDC fired on both sides, were accepted if an ID track was reconstructed in the event.
The HP stream contains events satisfying different triggers designed to select various signatures of hard scattering processes. This analysis uses events collected with the jet triggers. At L1 they require an energy deposition of E
T >20 GeV in the calorimeters or the coincidence of the ZDC signals. Such events were analyzed by the high-level trigger using a jet finding algorithm after underlying event subtraction.
All events containing an R
=0.2 reconstructed anti-k
tjet [20] with online estimated E
Tof at least 20 GeV were accepted.
Due to the increased luminosity delivered by the LHC in 2011 compared to 2010, the ATLAS detector observed much higher Pb
+Pb collision rates. Only a fraction of the MB triggers were recorded. This fraction changed during the data taking depending on instantaneous luminosity, chosen such that at the highest luminosity the bandwidth of the data acquisition system was sufficient to record all the HP stream.
This allowed all jet-triggered events with E
T >20 GeV to be recorded even at the highest luminosity.
As the luminosity decreased with time, all available bandwidth of the data acquisition was filled up with MB events.
All events in both runs were required to satisfy the MB event selection requirements: to have a timing signal coincidence,
|∆t|, between the MBTS satisfying
|∆t|
<3 ns and an event vertex reconstructed by the ID tracking system within
|z|<150 mm of the centre of the ATLAS detector.
After selection, approximately 5.1
×10
7MB events were analyzed in the 2010 data sample and a similar number of events in the 2011 MB stream sample. In 2011, 1.26
×10
7events satisfying jet trigger conditions were analyzed in the HP stream. The total number of MB events sampled by the jet trigger in the 2011 run was 9.98
×10
8. The integrated luminosity corresponds to approximately 7
µb−1in 2010 and approximately 0.14 nb
−1in 2011, estimated online. The three data samples described here are referred to in the text as 2010MB, 2011MB and 2011HP.
A Monte Carlo simulation (MC) is used to correct for the track reconstruction e
fficiency loss. The correction requires the simulation of tracks at high p
Tin the environment of high detector occupancy.
The high- p
Ttracks are generated by the PYTHIA event generator [21]. Five samples of
√s
=2.76 TeV p
+p hard scattering, approximately one million events each, were produced in five intervals of transverse momentum of outgoing partons in the 2
→2 hard-scattering, with boundaries of 17, 35, 70, 140, 280 and 560 GeV. The high-p
Ttracks must be embedded in the underlying event environment of soft tracks from the HI collision; this underlying event was produced using different techniques for the 2010 and 2011 data analyses.
In the 2010 data analysis the environment of Pb+Pb collisions was simulated using 10
6 √s
NN =2.76 TeV MB events produced by the HIJING event generator [22] with default parameters except for the disabling of jet quenching. To simulate the e
ffects of elliptic flow in Pb
+Pb collisions, a parametrized centrality-,
η- andp
T-dependent cos 2φ modulation based on previous ATLAS measurements [23] was imposed on the particles after generation. The detector response to the resulting MC events was evaluated using GEANT4 [24] configured with geometry and digitization parameters matching those of the 2010 Pb+Pb run [25].
In the 2011 run a separate stream was recorded during the data taking containing MB events without zero suppression. Those events were used as the underlying events by embedding them in the simulated hard-scattering events generated by PYTHIA. Approximately 3
×10
6events evenly spread during the time of the run were recorded in this separate data stream. To best cover the range of track p
Tincluded in the HP stream, the PYTHIA sample with hard-scattering boundaries from 140–280 GeV was used, and the resulting track p
Tspectrum reweighed to that observed in the data.
Data and simulated samples used in this analysis are listed in Table 1. A comparison between fully
corrected 2010MB and 2011MB samples show agreement over the entire p
Trange. Residual discrepan-
cies are accounted for by the systematic uncertainties.
Data
Year Stream Trigger MB Sampled Recorded
2010 MB MB 5.1
×10
75.1
×10
72011 MB MB 9.98
×10
85.1
×10
72011 HP Jet E
T>20 GeV 9.98
×10
81.26
×10
7Simulation
Year Underlying event Events Hard Scattering Total Events
2010 HIJING MC 10
6PYTHIA 5
×10
62011 Data overlay 3
×10
6PYTHIA 5
×10
6Table 1: Data and MC samples used in the analysis. For the MC the MB events were reused multiple times with different events from the PYTHIA sample.
The event centrality is estimated using the total transverse energy (
PE
T) measured at the electro- magnetic scale by the FCal. A detailed study with a Glauber Monte Carlo model [26] convoluted with
p
+p data at
√s
NN =2.76 TeV has been used to estimate the fraction of the Glauber total cross section measured using event selection cuts as f
=(98
±2)%. Using this fraction, the data are binned in 5% and 10% centrality event classes specified below. In this note the “peripheral” centrality class from Eq. 1 is chosen to be 60-80% and all of the rest of the classes are referred to as varying degrees of “central”.
The mean numbers of participating nucleons
hNparti, as well as the mean number of binary collisionsbetween them,
hNcolli, are estimated for each centrality class with the same Glauber calculation. Thevalues are shown in Table 2, with uncertainties determined by varying the nuclear density parameters, as well as f , used in the Glauber calculation. The last column of Table 2 also shows the ratio of
hNcolliin all centrality classes to the
hNcolliin the most peripheral 60-80% centrality class.
Centrality
hNparti hNcolli hNhNcolli(C)colli(60−80%)
[%] value syst. value syst. syst. [%] value syst. [%]
0-5 382 2 1683 130 7.7 63.6 11.7
5-10 330 3 1318 99 7.5 56.7 11.4
10-20 261 4 923 68 7.4 34.9 10.5
20-30 186 4 559 41 7.3 21.1 11.3
30-40 129 4 322 24 7.4 12.2 7.9
40-50 85.6 3.5 173 14 8.1 6.5 6.1
50-60 53.0 3.5 85.1 8.3 9.8 3.2 3.8
60-80 22.6 2.3 26.5 3.5 13.2 1 0
Table 2: Centrality classes used in this analysis. The mean number of participants
hNparti, mean num-ber of binary collisions
hNcolli, and the hNcolliratios to the most peripheral 60-80% centrality class as
estimated using a Glauber Monte Carlo model. The uncertainties (“syst.”) are dominated by systematic
e
ffects and further discussed in [27].
4 Track selection
The analysis of the charged particle spectra presented in this note is done with respect to a reference of primary charged particles with a mean lifetime
>0.3
×10
10s directly produced in the interaction of lead nuclei or a charged particle coming from subsequent decays of particles with a shorter lifetime [28]. All other particles are considered secondary. Tracks produced by these categories of particles are referred to in the text as primary and secondary tracks respectively. An exception is made for muons and electrons coming from the decays of W and Z bosons, whose contributions are excluded from the results. A spuri- ous association of hits in the detector layers coming from di
fferent particles resulting in a reconstructed track is considered a fake track.
Charged-particle tracks are reconstructed using the ATLAS ID system in the pseudorapidity region
|η|<
2.5 and over full azimuth. The minimum p
Tof reconstructed tracks is 0.5 GeV. The main challenge of this analysis comes from the abundance of particles produced in the HI collisions. They result in increased occupancies in the ID subsystems causing a deterioration of the ID tracking performance in central HI collisions.
The decrease of the tracking performance under high occupancy manifests itself in three di
fferent ways: a decrease of the tracking efficiency; an incorrect reconstruction of the track momentum vector;
the production of fake tracks, i.e. tracks composed of randomly associated hits in the detector layers. All of these phenomena are addressed in this section.
4.1 Modelling of track parameters
The three different subsystems experience the occupancy increase in HI collisions at a different level. The number of fired channels in the Pixel detector remains low, at a level below 1% even in the 0-5% most central collisions. The corresponding number for the SCT detector is below 10%, while the occupancy in the TRT channels reaches 90%. To account for this challenge the settings for the track reconstruction in Pb+Pb collisions were modified from those used in p
+p reconstruction [29, 30], giving larger weight to the hits in the Pixel and the SCT detectors, and making reconstruction more robust against fake track production. All tracks reconstructed in HI collisions are seeded from these two subsystems; TRT-seeded tracks are not used. The TRT is effective in peripheral collisions, but its contribution to the momen- tum reconstruction diminishes with increased centrality. The remainder of this section demonstrates the performance of the Pixel and SCT detectors in the environment of Pb+Pb collisions.
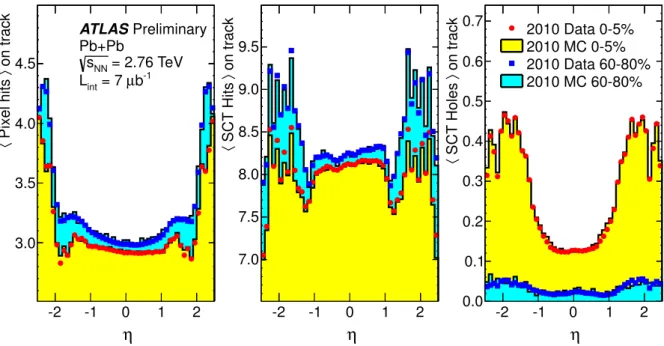
The MC used in this analysis reproduces the centrality dependence of the track parameters which define the quality of the track. Figure 1 shows the three most important features of the reconstructed tracks. On the left is the number of hits in the Pixel detector associated with a reconstructed track as a function of track rapidity. The middle panel shows the same for the SCT detector, and the right panel shows the number of SCT “holes”. A hole appears on a track if a hit, predicted by the track trajectory, is not found in the detector layer. The prediction takes into account the detector geometry and the detector active areas. In HI data processing, tracks with holes in the Pixel detector are rejected at earlier stages by the ID track reconstruction.
As can be seen from the figure the agreement between the data and simulation is very good. All three parameters shown in Fig. 1 are sensitive to the momentum distribution of the tracks, therefore the MC sample was re-weighted in p
Tto match the distributions measured in the data. A charged particle typically traverses three layers of Pixel detectors and four layers of double-sided SCT sensors. The
η-dependence of the average number of hits on Pixel and SCT detectors in the two left panels of Fig. 1 show relatively weak centrality dependence, whereas the number of SCT holes increases significantly with centrality. This trend shows the e
ffect of occupancy on the SCT pattern recognition algorithm. A
“hole” on a track may appear if a hit in the SCT is assigned to another track. The fake track rejection in
HI collisions requires no hit sharing between tracks. An increased number of holes in the SCT detector
η
-2 -1 0 1 2
ontrack〉Pixelhits〈
3.0 3.5 4.0 4.5
Preliminary ATLAS
Pb+Pb
= 2.76 TeV sNN
b-1
µ
int= 7 L
η
-2 -1 0 1 2
ontrack〉SCTHits〈
7.0 7.5 8.0 8.5 9.0 9.5
η
-2 -1 0 1 2
ontrack〉SCTHoles〈
0.0 0.1 0.2 0.3 0.4 0.5 0.6
0.7 2010 Data 0-5%
2010 MC 0-5%
2010 Data 60-80%
2010 MC 60-80%
Figure 1: Left to right: Average numbers of Pixel hits per track, average number of SCT hits per tracks and average number of SCT holes per track, measured in 0-5% central (blue squares) and 60-80% pe- ripheral collisions (red circles) as a function of
η. The 2010 data are compared to the MC shown withfilled histograms for the same centrality classes.
is an indication of the deterioration of the track quality. Tracks where an SCT hole is present are rejected from the analysis. This results in a decrease of the track reconstruction efficiency which needs to be accounted for with centrality dependent correction functions. Due to the very good agreement between the data and simulation, demonstrated by Fig. 1, a relatively small systematic uncertainty can be assigned to the centrality dependence of the correction functions. This is addressed in sections 5 and 7.
4.2 Cuts on the pointing to the primary event vertex
In addition to the cuts on the quality of reconstructed tracks, one can use cuts which select tracks pointing back to the primary event vertex (PV) to select well-reconstructed primary tracks. The event PV determi- nation [31] requires at least three tracks to be reconstructed in an event, passing the selection described in [30]. Due to the low pile-up in HI collisions only one (or no) PV is reconstructed in each event. For each track the reconstruction software determines the distance of closest approach of the track to the PV in the transverse (d
0) and longitudinal (z
0sin
θ) directions. It also estimates the uncertainty on theseparameters,
σd
0and
σz
0sin
θfor each measured track, based on its reconstructed p
Tand
η. Figure 2shows scatter-plots of the d
0parameter versus p
Tunder several di
fferent conditions. The distributions of z
0sin
θare very similar and therefore not shown.
Panel a) shows the d
0versus p
Tscatter-plot obtained in the most peripheral 60-80% class of events for all tracks reconstructed in the 2010MB and 2011MB samples. The tracks are required to have zero SCT holes. The average
|d0|decreases with increasing momentum of the tracks. At very high p
Tit approaches the geometric limit of about 10
µm defined by the size of the Pixel detector resolution. Atlow p
T <2 GeV and large
|d0|a significant fraction of tracks comes from charged particles produced in weak decays (mainly K
0Sand
Λ0) inside the ID system. At higher p
T, the region with
|d0|exceeding a hundred microns is empty. Panel a) is similar to the ATLAS performance seen in the 2012 p
+p runs at
√
s
=8 TeV and represents stable ID tracking performance, with a reliable measurement of the track p
T[mm]
0d
-4 -3 -2 -1 0
1 2 3 4
[GeV]
pT
1 10 102
[GeV]
pT
1 10 102
[GeV]
pT
1 10 102
[GeV]
pT
1 10 102
60-80%
2010-11MB a)
2010-11MB0-5%
b)
0-5%
2011HP c)
0-5%
2010-11MB ATLAS
Pb+Pb
= 2.76 TeV sNN
= 15nb-1
Lint
d)
] mm-1
)) [GeV-1
d(d0
/ (dpT track
Z axis: dN
10-1 1 10 102 103 104 105 106 107 108 109
Preliminary
Figure 2: Distance of closest approach of the track trajectory to the PV in the plane transverse to the beam direction, d
0. a) in 60-80% peripheral events of the MB sample, b) in 0-5% central events of the MB sample, c) in 0-5% central events for the tracks matched to jets in the HP sample, d) in 0-5% central events of the MB sample after applying cuts on d
0and z
0sin
θsignificance, see text. The z-axis dN
track/(dpTdd
0) is in a logarithmic scale and is the same for all four panels. White areas in the distributions are at the level of eleven orders of magnitude below the maximum in panel b).
and low production of fakes.
This distribution is di
fferent in the 0-5% most central events as shown in panel b). The bulk of the distribution remains similar; however, areas at high-p
Tand large d
0which were empty in peripheral events are populated with tracks. To understand the origin of these tracks one needs to compare panel b) to a clean sample of events measured under the same occupancy conditions.
Panel c) of Fig. 2 shows the d
0versus p
Tscatter-plot measured in the 0-5% centrality class with the
∼10 times larger statistical sample of 2011HP data. The sample is obtained with the jet trigger discussed in Sec. 3. The jets are reconstructed from purely calorimetric information provided by the electromagnetic and hadronic calorimeters spanning the interval
|η| <4.9. Jets are reconstructed using the anti-k
t[20] algorithm with the radius parameter R
=0.2. The inputs to the anti-k
talgorithm are (∆
η,∆φ) =(0.1
×0.1) towers generated by summing the energy in cells from the various layers of the calorimeters. The cells are weighted using energy-density dependent factors to correct for calorimeter non-compensation and other energy losses. The jet reconstruction in HI collisions including the under- lying event subtraction is described in detail in [6]. The tracks producing the scatter-plot in panel c) are required to satisfy the condition r
= pδη2+δφ2 <
0.2, where
δηand
δφare the di
fference in pseudora- pidity and azimuthal angle respectively between the directions of the tracks and the direction of the jet momenta. Low- p
Ttracks with transverse momentum less than 3 GeV are suppressed by the requirement of matching to the jets, because most of them are produced via soft interactions.
At high-p
T, the tracks matched to jets represent a sample with far fewer fake tracks, compared to the one shown in panel b). The shape of the d
0distribution is similar to that seen in peripheral events.
This leads to the conclusion that in central collisions tracks populating the high-p
Tarea at large
|d0|in
panel b) are not due to a modification of the d
0distribution of high-p
Ttracks, but due to mismeasured
momentum of low-p
Tcharged particles in the SCT detector. The d
0and z
0sin
θparameters of the tracks
remain properly measured by the Pixel detector which remains at low occupancy even in very central HI collisions.
The width of the d
0and z
0sin
θdistributions increase with decreasing p
Tdue to multiple scattering.
The estimates of the impact parameter accuracy,
σd
0and
σz
0sin
θ, rely on all hits including the SCT hits, which define the momentum of the track. An overestimated momentum of the track corresponds to a straighter trajectory with lower multiple scattering. Therefore the
σd
0and
σz
0sin
θfor such mis- measured tracks are underestimated. This effect is seen in Fig. 3 which shows
hσd
0imeasured in the 0-5% most central events. Averaging is done for all tracks in the sample. The black crosses are all tracks reconstructed in the MB sample. Above p
Tof 10 GeV the
hσd
0idistribution does not change with p
T, due to contamination from low-p
Ttracks. Applying cuts on the number of hits and holes assigned to the track improves the situation as shown by the blue squares (the same sample as shown in panel b) of Fig. 2). At high-p
Tthe
hσd
0ishown with blue squares is still much larger than that for tracks in the HP sample (the same as shown in panel c) of Fig. 2).
From these comparisons one can conclude that the significances d
0/σd
0and z
0sin
θ/σz
0sin
θfor mismeasured tracks are much larger than for correctly reconstructed tracks. Rejecting tracks with sig- nificance higher than 3 from the sample of tracks shown in panel b) produces the scatter-plot presented in panel d) of Fig. 2. The distribution at high p
Tmore closely resembles the distribution shown in panel a), except for the low- p
Ttracks, where the cuts on the impact parameter significance also reject a large fraction of secondary particles. The
hσd
0ifor these tracks shown with red triangles in Fig. 3 is consistent with tracks in jets up to p
Tof 60 GeV. The black histogram in the figure shows that the cut on impact parameter significance also helps to reduce mismeasured tracks inside jets.
[GeV]
pT
5 10 20 50 100
m]µ[〉 0dσ〈
10 20 50
MB reconstruction MB track cuts
MB track and PV cuts HP track cuts, in jets
HP track and PV cuts, in jets
Preliminary ATLAS
= 2.76 TeV sNN
Pb+Pb
Data 2010, 2011
= 0.15 nb-1
Lint
Centrality 0-5%
Figure 3:
hσd
0iestimates of the impact parameter accuracy as a function of track p
Tmeasured in dif- ferent samples in the most central collisions. Black crosses are all tracks in the MB sample with “recon- struction” cuts listed in Table 3. Blue squares are tracks in the MB sample with requirements on Pixel and SCT hits and holes as in the “standard” cuts in Table 3. Green circles are the same conditions applied to tracks matched to jets in the 2011HP sample. Red triangles are the MB tracks with all “standard” cuts and the histogram is the same for the HP tracks matched to jets.
The impact parameter cuts rely heavily on the Pixel detector. To obtain an accurate measurement of
the d
0and z
0sin
θparameters, a requirement of at least two hits in the Pixel detector layers, one being
in the innermost B-layer, is imposed on all tracks. In addition, the requirement on the number of hits in
the SCT detector is raised to
≥7, making the track p
Treconstruction more robust. These studies lead to the formulation of the “standard” set of tracking cuts used in this analysis as listed in Table 3. The cut on
σd
0/hσd
0ieliminates tracks with too large estimates of
σd
0compared to its average value, where averaging is done over a sample of tracks matched to jets in the HP sample as a function of track p
Tand
η.In order to evaluate systematic uncertainties associated with the track selection the cuts were individually varied between the values specified in the “loose” and “tight” columns of Table 3. The “reconstruction”
cuts, those imposed by the ATLAS track reconstruction are also given in Table 3.
Cuts reconstruction standard loose tight
Pixel hits
≥0
≥2 1
≥3
Pixel layers BL BL, if expected
≥3
SCT hits
≥5
≥7
≥6
≥8
SCT holes
<2 0 0 0
d
0/σd
0 <3
<3.5
<2.5
σ
d
0/hσd
0i <3
<3.5
<2.5
z
0sin
θ/σz
0sin
θ <3
<3.5
<2.5
Table 3: Summary of tracking cuts. Reconstruction cuts are used by the ID track reconstruction software in HI collisions. Most reconstruction cuts, which do not change between different sets or with p
+p reconstruction, are not listed in the table. Standard cuts are used in this analysis, and loose and tight cuts are used to evaluate systematic uncertainties on the measurement. “BL” stands for B-layer, i.e. the innermost layer of the Pixel detector. The requirement of
≥3 Pixel layers forces a track to have at least one hit in three di
fferent layers of the Pixel detector, the B-layer, and any two of the outer two Pixel barrel layers or any of the three Pixel endcap disks on each side.
4.3 Background rejection and matching tracks to calorimetric jets
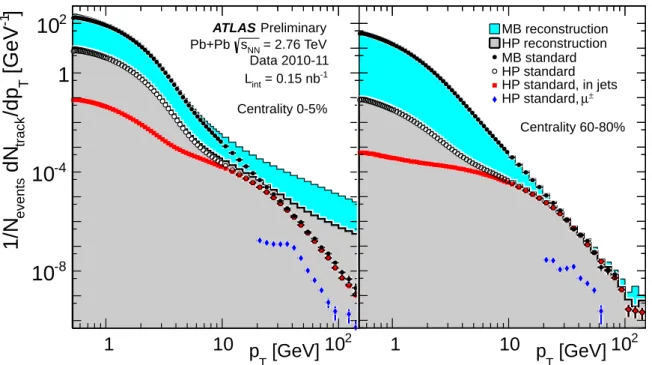
The performance of the track reconstruction is demonstrated in Fig. 4. The panels show the p
Tdistribu- tion of tracks reconstructed in the 0-5% most central class of events (left) and in the 60-80% peripheral class (right). The track distributions are divided by the number of sampled events corresponding to their centrality classes.
The figure demonstrates the e
ffect of applying standard cuts and jet-matching. The distributions of tracks with reconstruction tracking cuts are shown with the filled histograms. The thin line (cyan color) histograms show tracks in the combined MB sample and the thick line (gray color) histograms show all tracks in the HP sample.
First the standard analysis cuts listed in Table 3 are applied to all distributions. The results are shown in Fig. 4 with circles. Closed circles correspond to the combined MB sample and open circles to the HP sample. Using only standard cuts makes the distributions of the MB and HP samples agree reasonably for p
T >30 GeV. This indicates that the standard cuts reject the dominant part of the background. The tracks in the HP sample are then required to be matched to jets. These tracks are shown with red squares.
The significant reduction in the number of tracks at low p
Tis because soft particles may have a different production mechanism, not related to jets. However at high p
Tthe distribution with and without matching to jets agrees out to the highest p
Tinvestigated.
To estimate the contribution of particles coming from electroweak processes to the high-p
Ttrack
samples, Fig. 4 shows the distribution of tracks matched to muons with p
T >20 GeV. These tracks are
matched to muons reconstructed offline, using both inner detector and muon spectrometer, selected from
events in the HP stream triggered using muon triggers [32]. The muons are not required to be matched
to jets. The leptons from electroweak processes do not interact with the quark gluon plasma and are not
]
-1[GeV
T/dp
trackdN
events1/N
10
-810
-41 10
2[GeV]
p
T1 10 10
2[GeV]
p
T1 10 10
2Preliminary ATLAS
= 2.76 TeV sNN
Pb+Pb
Data 2010-11 = 0.15 nb-1
Lint
Centrality 0-5%
MB reconstruction HP reconstruction MB standard HP standard HP standard, in jets
µ±
HP standard, Centrality 60-80%
Figure 4: The left panel shows distributions of the number of tracks per event as a function of transverse momentum in the 0-5% most central events. The right panel shows the same distributions in the 60-80%
peripheral events. The thin line histograms (filled with cyan color) show tracks satisfying reconstruction cuts in the combined 2010-11 MB event sample. Thick line histograms (filled with gray color) show tracks after reconstruction cuts in the 2011HP sample. Full circles show tracks satisfying standard anal- ysis cuts in the combined 2010-11 MB sample. Open circles show the tracks in the 2011HP sample satisfying the same conditions. Red squares are tracks in the 2011 HP sample after applying standard cuts and matching to jet. Jets are also required to match to an online trigger object. Blue diamonds show the distribution of tracks identified as muons in the 2011 HP sample.
the object of our interest, so will be subtracted from the final distributions. The distributions of muons are shown with blue diamonds.
Figure 5 shows the ratios of distributions shown in Fig. 4. The left and right panels show the 0-5%
most central events and 60-80% peripheral events respectively. The upper panels demonstrate the e
ffect of the standard cuts by showing the ratios of distributions with reconstruction and standard cuts.
At low p
Tthe ratios of distributions with reconstruction cuts to those with standard cuts, shown by closed circles for the MB sample and open circles for the HP sample, are above unity in both panels.
This is due to a fraction of reconstructed particles being rejected by standard cuts (approximately 30%).
The loss is similar in central and peripheral collisions and is higher at higher
η. One should note thatsome of those particles are secondaries. The loss of primary particles is accounted for by
η-,p
T- and centrality-dependent corrections using the simulation as described in Sec. 5.
In peripheral events these ratios remain at the same level out to very high p
T, whereas in central events, the MB curve at p
T >9 GeV followed by the HP curve at p
T >30 GeV start to increase rapidly.
The difference between the two distributions remains about one order of magnitude independent of p
T, consistent with the difference in the statistics between the HP and the MB event samples. Apart from the 30% loss discussed earlier, this ratio reflects the background-to-signal ratio (B
/S) in the two samples.
In this ratio the signal and background refer to correctly reconstructed tracks and tracks with wrongly reconstructed momentum respectively.
The lower panels demonstrate the e
ffect of the jet-matching cuts by showing the ratios of jet-matched
standardjets
0.6 0.8 1.0 1.2
standardreconstruction
1 10 102
103
[GeV]
p
T1 10 10
2[GeV]
p
T1 10 10
2[GeV]
pT
1 10 102
counts
0.6 0.7 0.8 0.9 1 1.1 1.2 1.3
[GeV]
pT
1 10 102
counts
1 10 102
103 ATLAS Preliminary = 2.76 TeV sNN
Pb+Pb
= 0.15 nb-1
Data 2010-11 Lint
Centrality 0-5%
[GeV]
pT
1 10 102
counts
0.6 0.7 0.8 0.9 1 1.1 1.2 1.3
HP jet-matched/HP HP jet-matched/MB
HP jet-matched/MB (10-80%)
[GeV]
pT
1 10 102
counts
1 10 102
103 MB
HP
Centrality 60-80%
Figure 5: Upper panels: ratios of number of tracks with reconstruction cuts to number of tracks satisfying standard cuts, measured in HP (open circles) and MB (full circles) samples. Lower panels: ratios of number of tracks matched to jets to the number of tracks satisfying standard cuts, measured in HP sample (red squares) and measured in HP sample to those measured in MB sample (circles). Panels present 0-5%
most central collisions on the left and 60-80% peripheral collisions on the right. The distribution of blue stars is analogous to the distribution of full circles but it corresponds to the HP
/MB ratio in the 10-80%
centrality class.
tracks to tracks passing standard cuts. As shown by the red squares, at p
T &20 GeV all tracks satisfying standard cuts reside inside jets. In peripheral events it remains like this up to the highest measured p
T. In central events a deviation of about 10% is visible above 100 GeV. At this p
Tthe B
/S for the HP sample is above 100. Assuming that all correctly reconstructed tracks are inside jets, a reduction of the background track contribution from a factor more than 100 (open circles in the upper panel), to a magnitude of 10% (red squares in the lower panel) allows the background rejection power of the standard cuts to be estimated to be about 10
3.
The full circles in the lower panels show the ratios of jet-matched tracks in the HP sample to tracks passing standard cuts in the MB samples. Under the same assumption, that all correctly measured tracks at high p
Tare associated with jets, one would expect this ratio to reach unity. The exception is tracks produced by muons and electrons coming from electroweak decays of heavy bosons, shown with the blue markers in Fig. 4. These contributions are subtracted from the MB sample, since muons do not fire the jet trigger, so do not appear in the jet sample. The ratios shown in the lower panels with full circles are the probabilities that a high- p
Ttrack belongs to a jet which fired a jet trigger. In other words, it is the jet trigger e
fficiency derived with respect to the high-p
Ttracks. The e
fficiency approaches unity for p
T >30 GeV both in central and in peripheral collisions. In peripheral collisions it remains at the same level, within large statistical fluctuations, whereas in central collisions it decreases. At high p
T>60 GeV the B
/S for the MB sample (full circles in upper panel) reaches 100 and continues to grow. As estimated from the HP sample the rejection power of standard cuts allows a contamination in a sample if B
/S is more than 10
2. In the MB sample at high p
Tusing only the standard cuts results in a significant contamination and in a decrease of the jet trigger e
fficiency curve at higher p
T(full circles in the lower panel).
In order to evaluate the jet trigger efficiency for high-p
Ttracks the analysis uses events with centrality
greater than 10%, where the B/S ratio is less than in the central events. The jet trigger efficiency for anti-k
tjets with R
=0.2 has very weak centrality dependence [6]. The HP
/MB ratio of 10-80% centrality is shown in the right panel of Fig. 5 with blue stars. Above 30 GeV it reaches 0.9 and continues to increase. This effect comes from the fact that energy of a jet can be underestimated by the online trigger due to fluctuations. Tracks belonging to these jets are not present in the HP sample. This results in an inefficiency of the jet trigger to high-p
Ttracks.
5 Corrections for e ffi ciency loss and for secondary particles
The track reconstruction e
fficiencies are determined using the MC samples listed in Table 1. The correc- tions are based on the relative contributions from primaries, secondaries and combinatorial fake tracks.
The track reconstruction e
fficiencies are estimated as a function of reconstructed particle p
Tand
|η|by comparing distributions of reconstructed tracks matched to primary particles and all generated primary particles. Reconstructed tracks are matched to generated particles using the true deposited charge which is matched with the hits along the track. Moreover, the relative momentum di
fference between the re- constructed track and the generated particle is required to be less than 50%.
Tracking efficiencies were calculated in 20 bins in
ηof a width of 0.25 and nine centrality bins for negatively and positively charged particles independently. In the regions where the e
fficiencies were found consistent they were combined together into seven
|η|bins for both charges together. A sample of efficiency curves combined into wider rapidity bins is shown in Fig. 6. To minimize the effect of statistical fluctuations at high p
Tthe e
fficiencies are smoothed by fitting. This results in an additional systematic uncertainty on the e
fficiency.
E ffici enc y
0.1 0.2 0.3 0.4 0.5 0.6 0.7 0.8 0.9
[GeV]
p
T1 10 10
2[GeV]
p
T1 10 10
2[GeV]
p
T1 10 10
2[GeV]
pT
1 10 102
efficiency
0.1 0.2 0.3 0.4 0.5 0.6 0.7 0.8 0.9
|<1.
η
| 60-80%
30-40%
10-20%
0-5%
[GeV]
pT
1 10 102
efficiency
0.1 0.2 0.3 0.4 0.5 0.6 0.7 0.8 0.9
|<1.75 η 1.5<|
[GeV]
pT
1 10 102
efficiency
0.1 0.2 0.3 0.4 0.5 0.6 0.7 0.8 0.9
|<2.5 η 2.25<|
ATLAS
= 2.76 TeV sNN
Pb+Pb
simulation Preliminary
Figure 6: Tracking efficiency calculated from the 2011 MC samples for four centrality classes (0-5%, 10-20%, 30-40% and 60-80%) and three
|η|ranges are shown. The shaded bands show the uncertainties from the fit parameterisation.
Corrections for the inefficiency of track reconstruction and momentum resolution are applied using
bin-by-bin corrections. An iterative procedure was used in the correction, comparing fully corrected
data to the generated momentum distribution in each bin of rapidity and for all centrality classes. The generated MC distributions were matched to the fully corrected data and the e
fficiency curves were regenerated. The iteration procedure converges to less than a percent difference between the second and the third iterations.
The residual rates of secondary particles and fakes are estimated together. In each
η, centrality andp
Tbin studied in this analysis the fractions of fakes and secondaries among tracks passing the standard selection are estimated using simulation. The non-primary corrections are shown in Fig. 7. The primary fraction is found to be close to unity near
η =0 for peripheral collisions and to decrease both with increasing centrality and
η. With increasingp
T, the correction becomes smaller.
Fraction
0.90 0.95 1.00
[GeV]
p
T2 4
[GeV]
p
T2 4
[GeV]
p
T2 4
30-40%
10-20%
5-10%
0-5%
|<1.00 η |
ATLAS Preliminary
=2.76TeV s
NNPb+Pb simulation
|<1.75 η
1.50<| 2.25<| η |<2.50
Figure 7: Combined fake and secondary correction at low p
Tcalculated from simulations. Tracks were selected using standard cuts. The shaded bands show the uncertainties.
6 Merging event samples
The final results are produced from the 2010MB, 2011MB and 2011HP samples described above. The distributions of tracks satisfying standard analysis cuts in the inclusive MB samples are corrected by subtracting twice the corresponding reconstructed muon distributions. The factor of two accounts for the same number of electrons and muons coming from the electroweak decays of heavy bosons. The spectra are corrected for the secondary and fake track contamination at low p
Tusing the correction factors shown in Fig. 7 and corrected for efficiency. The distributions are corrected independently using the corresponding simulation and the results are based on a combination of the data from the two years.
The track momentum distributions measured in the 2011HP sample are taken after the standard cuts
and jet matching. The jet is also matched to an online trigger object. The jet trigger efficiency for the
tracks with p
T >30 GeV is close to unity as shown by the blue stars in Fig. 5.
Electroweak decays producing muons do not fire the jet trigger so do not appear in the HP jet- triggered sample. However, electrons from electroweak decays will also be reconstructed as jets in the calorimeter, and thus be included in the HP jet sample [32]. These can be subtracted assuming that the distributions for muons and electrons from electroweak decays are the same. The distribution of tracks satisfying standard cuts and matched to the muons taken with the muon trigger in the HP stream was measured independently. Matching to the jet was not required. The distribution was corrected for the muon trigger efficiency [32], and subtracted from the inclusive distribution of tracks matched to jets. After that, the track distribution was corrected for the reconstruction e
fficiency using the same MC as the 2011MB sample. The high- p
Ttracks found in the 2011MB sample are also present in the 2011HP sample. In addition, the MB sample at p
T >90 GeV contains a fraction of mis-measured low- p
Ttracks. For this reason the final spectra are a combination of the 2010MB and 2011MB samples below p
T=30 GeV and the 2011HP sample above. The MB and HP samples are compatible around 30 GeV as can be seen in Fig. 4.
7 Systematic uncertainties
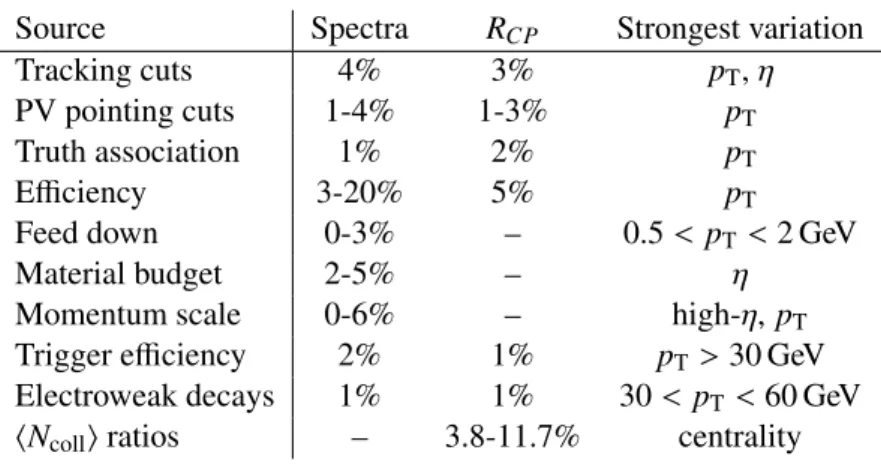
The analysis was performed with the standard cuts listed in Table 3. The systematic uncertainties of applying standard cuts were estimated by varying each cut independently between the values shown in columns “loose” and “tight” of the same table. The results of all variations were added in quadrature and averaged between upward and downward variations. Table 4 shows this systematic uncertainty separately for the cuts on the numbers of hits and holes (Tracking cuts) and for impact parameter (PV pointing) cuts.
Source Spectra R
CPStrongest variation
Tracking cuts 4% 3% p
T,
ηPV pointing cuts 1-4% 1-3% p
TTruth association 1% 2% p
TE
fficiency 3-20% 5% p
TFeed down 0-3% – 0.5
<p
T<2 GeV
Material budget 2-5% –
ηMomentum scale 0-6% – high-η, p
TTrigger efficiency 2% 1% p
T>30 GeV Electroweak decays 1% 1% 30
<p
T<60 GeV
hNcolliratios – 3.8-11.7% centrality
Table 4: Estimated values for di
fferent systematic uncertainties for the spectra and the R
CPratios.
The systematic uncertainties on the efficiency corrections result from several contributions. The first contribution is estimated by comparing fully corrected MB spectra in the 2010 and 2011 runs. The two analyses have di
fferent MC, one is based on embedding jet samples into HIJING and the other on overlay with the real data as summarized in Table 1. The second contribution accounts for the fit used to estimate the e
fficiency at high p
T. The fit errors from the smoothing function are propagated into a p
T-dependent uncertainty. Another contribution comes from the iterative procedure which is used in the bin-by-bin correction. This procedure is used to account for the difference between the shape of the p
Tdistributions in simulated events and data. The contribution was estimated by changing of the slope at high p
Tof the distribution in the simulated events before the correction procedure to see whether final results are sensitive to the initial conditions. This contribution was found to be the dominant one.
Feed down from fake and secondary particles into the region accepted by the impact parameter cuts
creates a small contamination. The uncertainty on this contamination is estimated as the difference between the approach in this note and the approach based on matching tracks to the PV as used in Ref. [11]. The uncertainty is around 3% at 500 MeV and it decreases with p
T. At higher p
Ta small uncertainty is assigned, equal to the contribution itself.
An
η-dependent contribution is derived from uncertainties in the as-built detector material budget[28].
The uncertainty due to the absolute momentum scale uncertainty was estimated based on a study of the residual inner detector misalignment, and it becomes significant at the edges of the ID
ηcoverage.
The trigger efficiency uncertainty is driven by the statistical uncertainty of the high- p
Ttracks above 30 GeV used to determine the efficiency.
The contribution from the muons and electrons coming from electroweak decays of heavy bosons was subtracted in the analysis. This contribution is significant in the region 30
<p
T <60 GeV as one can see in Fig. 4. The uncertainty is a conservative estimate based on the efficiency of matching tracks to muons.
Many uncertainties cancel in R
CP. The uncertainty on the e
fficiency is evaluated as the average deviation between the fits and the efficiency values in all centrality classes used in the ratio.
Table 4 lists the di
fferent sources of systematic uncertainties on the spectra and spectral ratios. In general, the magnitude of these identified uncertainties does not exceed 5%. The exceptions are the effect of mismeasured tracks at high p
T, which reaches 10% at p
T =10 GeV, and the uncertainty in the calculation of the number of binary collisions
hNcolli, which is equal to 11.7% for the 0-5%/60-80% R
CPratio.
8 Results
8.1 Charged-particle spectra
The corrected spectra are shown in Fig. 8 for four centrality bins (0–5%, 30–40%, 50–60% and 60–80%) and 3
|η|ranges.
8.2 Charged particle R
CPThe ratios R
CP, as given by Eq. 1, of central to peripheral spectra for several centrality classes are shown in Fig. 9. Three ratios are shown, using central bins of 0-5%, 30-40% and 50-60% and a common peripheral bin of 60-80%. All values of
hNcolliper bin are tabulated in Table 2, and are derived from the Monte Carlo Glauber calculations used to determine the centrality classes.
The R
CPshown in di
fferent
η-regions are consistent with each other and can be combined. TheR
CPmeasured over the entire acceptance of the ATLAS inner detector tracking system in the momentum range 0.5
<p
T <150 GeV is shown in Fig 10. The R
CPreaches a minimum at 5
<p
T <7 GeV and then rises at higher p
T.
9 Conclusion
This note presents a measurement of inclusive charged hadron spectra in
√s
NN =2.76 TeV Pb
+Pb
collisions and their ratios (R
CP) between central and peripheral event classes, normalized by the number
of binary collisions. The measurement is performed in the range of charged particles
|η| <2.5 and
0.5
<p
T <150 GeV. Invariant yields have been measured in di
fferent
ηbins as a function of the
transverse momentum of the particles and the centrality of the collisions. Within the statistical and
systematic uncertainties the measurements in different
ηbins are consistent and are combined together.
]
-2) [GeV
Tdp η /(d
ch) dN
Tp π 1/(2
10
-1010
-610
-210
2[GeV]
p
T1 10 102
[GeV]
p
T1 10 102
[GeV]
p
T1 10 102
|<1.0 η |
ATLAS Preliminary
=2.76TeV sNN
Pb+Pb
Data 2010 + 2011 = 0.15nb-1
Lint
|<2.0 η
1.0<| 2.0<|η|<2.5
(0-5)%
(30-40)%
(50-60)%
(60-80)%
Figure 8: Fully corrected transverse momentum spectra for charged particles for four centrality classes (0-5%, 30-40%, 50-60% and 60-80%) and three
ηranges (
|η|<1.0, 1.0
<|η|<2.0, 2.0
<|η|<2.5). The gray boxes show systematic uncertainties. These are correlated between bins.
CP R
1
0.2
[GeV]
pT
1 10 102
[GeV]
pT
1 10 102
[GeV]
pT
1 10 102
|<1.0 η |
ATLAS Preliminary
=2.76TeV sNN
Pb+Pb
Data 2010 + 2011 = 0.15nb-1
Lint
|<2.0 η
1.0<| 2.0<|η|<2.5
(50-60)% / (60-80)%
(30-40)% / (60-80)%
(0-5)% / (60-80)%
Figure 9: R
CPextracted from the inclusive charged particle distributions in three di
fferent
ηranges (|η|
<1.0, 1.0
< |η| <2.0, 2.0
< |η| <2.5), and three centrality combinations: with 0-5%, 30-40%
and 50-60% as numerators and a common peripheral sample (60-80%) as denominator. The statistical errors are shown with vertical lines and the overall systematic uncertainty at each point is shown with gray boxes.
The measurement shows a strong suppression of hadron production which increases with centrality.
The measured R
CPfor 0–5% to 60–80% centrality classes reaches a minimum of
∼0.2 at 7 GeV. At
CP R
1
0.2
[GeV]
p
T1 10 10
2|<2.5 η
ATLAS Preliminary |
=2.76TeV s
NNPb+Pb
Data 2010 + 2011 = 0.15nb
-1L
int(50-60)% / (60-80)%
(30-40)% / (60-80)%
(0-5)% / (60-80)%
Figure 10: R
CPmeasured in
|η| <2.5 in three centrality combinations: with 0-5%, 30-40% and 50-60%
as numerators and a common peripheral sample 60-80% as denominator. The statistical errors are shown with vertical lines and the overall systematic uncertainty at each point is shown with gray boxes.
higher p
Tthe R
CPrises with p
T. Due to use of the jet trigger in the 2011 run, the statistics of high-p
Ttracks is very good up to p
T =70 GeV. The measurement of the R
CPis limited by the statistics of the peripheral 60–80% centrality bin. Within this limited statistics the trend of the R
CPabove p
T =70 GeV is consistent with the degree of suppression measured in jets [27].
References
[1] ATLAS Collaboration, Observation of a Centrality-Dependent Dijet Asymmetry in Lead-Lead Collisions at
√s
NN =2.76 TeV with the ATLAS Detector at the LHC, Phys. Rev. Lett.
105(2010) 252303, arXiv:1011.6182 [hep-ex].
[2] CMS Collaboration, Observation and studies of jet quenching in PbPb collisions at
√
s
NN =2.76 TeV, Phys. Rev. C
84(2011) 024906, arXiv:1102.1957 [nucl-ex].
[3] Aaron Angerami for the ATLAS Collaboration, Measurement of jets and jet suppression in
√