A TLAS-CONF-2016-005 14 Mar ch 2016
ATLAS NOTE
ATLAS-CONF-2016-005
14th March 2016
Measurement of the t t ¯ production cross-section using e µ events with b-tagged jets in p p collisions at √
s = 13 TeV with the ATLAS detector
The ATLAS Collaboration
Abstract
This note describes a measurement of the inclusive top quark pair production cross-section ( σ
t¯t) with a data sample of 3.2 fb
−1of proton-proton collisions at a centre-of-mass energy of
√ s = 13 TeV, collected in 2015 by the ATLAS detector at the LHC. This measurement uses events with an opposite-charge electron-muon pair in the final state. Jets containing b -quarks are tagged using an algorithm based on track impact parameters and reconstructed secondary vertices. The numbers of events with exactly one and exactly two b -tagged jets are counted and used to determine simultaneously σ
t¯tand the efficiency to reconstruct and b -tag a jet from a top quark decay, thereby minimising the associated systematic uncertainties. The cross-section is measured to be:
σ
tt¯= 803 ± 7 (stat) ± 27 (syst) ± 45 (lumi) ± 12 (beam) pb ,
where the four uncertainties arise from data statistics, experimental and theoretical systematic effects, the integrated luminosity and the LHC beam energy, giving a total relative uncertainty of 6.7 %. The result is consistent with theoretical QCD calculations at next-to-next-to-leading order. A fiducial measurement corresponding to the experimental acceptance of the leptons is also presented.
© 2016 CERN for the benefit of the ATLAS Collaboration.
Reproduction of this article or parts of it is allowed as specified in the CC-BY-4.0 license.
1 Introduction
The top quark is the heaviest known fundamental particle, with a mass m
tthat is much larger than any of the other quarks, and close to the scale of electroweak symmetry breaking. The study of its production and decay properties forms a core part of the LHC physics program. At the LHC, top quarks are primarily produced in quark-antiquark pairs ( t¯ t ), and the precise prediction of the corresponding inclusive cross- section is a substantial challenge for QCD calculational techniques, as well as being sensitive to the gluon parton distribution function (PDF) and the top quark mass. Physics beyond the Standard Model may also lead to an enhancement of the t t ¯ production rate.
Calculations of the t¯ t production cross-section at hadron colliders are available at full next-to-next- to-leading order (NNLO) accuracy in the strong coupling constant α
s, including the resummation of next-to-next-to-leading logarithmic (NNLL) soft gluon terms [1–5]. ATLAS has adopted a reference value of 832
+40−46pb at a centre-of-mass energy of
√ s = 13 TeV assuming m
t= 172 . 5 GeV, corresponding to a relative precision of
+4−5..85%. This value has been calculated using the top++ 2.0 program [6]. The combined PDF and α
suncertainties of ± 35 pb were calculated using the PDF4LHC prescription [7] with the MSTW2008 68 % CL NNLO [8, 9], CT10 NNLO [10, 11] and NNPDF2.3 5f FFN [12] PDF sets, and added in quadrature to the factorisation and renormalisation scale uncertainty of
+20−29pb. The cross-section at
√ s = 13 TeV is predicted to be 3.3 times larger than the cross-section at
√ s = 8 TeV.
Measurements of σ
t¯thave been made at
√ s = 7 and 8 TeV by both ATLAS [13–15] and CMS [16–18].
The most precise ATLAS measurements of σ
tt¯at these collision energies were made using events with an opposite-charge isolated electron and muon pair and additional b -tagged jets [13]. This note documents a measurement of σ
t¯tat
√ s = 13 TeV using the same final state and analysis technique. Wherever possible, the analysis builds on the studies and procedures used in the earlier publication. A fiducial measurement determining the cross-section in the region corresponding to the experimental lepton acceptance is also presented.
The ATLAS detector is outlined in Section 2. The data and Monte Carlo simulation samples are described in Section 3, followed by the object and event selection in Section 4 and the method for determining the t t ¯ cross-section in Section 5. The evaluation of backgrounds is discussed in Section 6 and the systematic uncertainties in Section 7. Finally, the results and conclusions are given in Section 8.
2 ATLAS detector
The ATLAS detector [19] at the LHC covers nearly the entire solid angle around the collision point, and consists of an inner tracking detector surrounded by a thin superconducting solenoid magnet producing a 2 T axial magnetic field, electromagnetic and hadronic calorimeters, and an external muon spectrometer incorporating three large toroid magnet assemblies. The inner detector consists of a high-granularity silicon pixel detector, including the newly-installed insertable B-layer (IBL) [20], and a silicon microstrip tracker, together providing precision tracking in the pseudorapidity1 range |η | < 2 . 5, complemented by a straw-tube transition radiation tracker providing tracking and electron identification information for
1
ATLAS uses a right-handed coordinate system with its origin at the nominal interaction point in the centre of the detector, and the z axis along the beam line. Pseudorapidity is defined in terms of the polar angle θ as η = − ln tan θ/2, and transverse momentum and energy are defined relative to the beam line as p
T= p sin θ and E
T= E sin θ . The azimuthal angle around the beam line is denoted by φ, and distances in (η, φ) space by ∆R = q
∆η
2+ ∆φ
2.
|η | < 2 . 0. A lead liquid-argon (LAr) electromagnetic calorimeter covers the region |η | < 3 . 2, and hadronic calorimetry is provided by steel/scintillating tile calorimeters for |η | < 1 . 7 and copper/LAr hadronic endcap calorimeters. The forward region is covered by additional LAr calorimeters with copper and tungsten absorbers. The muon spectrometer consists of precision tracking chambers covering the region | η| < 2 . 7, and separate trigger chambers covering |η| < 2 . 4. A two-level trigger system, using custom hardware followed by a software-based level, is used to reduce the event rate to a maximum of around 1 kHz for offline storage.
3 Data and simulation samples
The analysis is performed using the full 2015 ATLAS proton–proton collision data sample at
√ s = 13 TeV with 25 ns proton bunch spacing. The data correspond to an integrated luminosity of 3.2 fb
−1after requiring that all detector subsystems were operational within stable beam conditions. Events are required to pass either a single electron or single muon trigger, with thresholds set to be almost fully efficient for leptons with p
T> 25 GeV passing offline selections. Each event includes the signals from on average about 14 additional inelastic pp collisions in the same bunch crossing (known as pileup).
Monte Carlo simulated event samples are used to optimise the analysis, to compare to the data and to evaluate signal and background efficiencies and uncertainties. The main t¯ t signal and background samples were processed through the ATLAS detector simulation [21] based on GEANT4 [22]. Some of the systematic uncertainties were studied using alternative t¯ t samples processed through a faster simulation making use of parameterised showers in the calorimeters [23]. Additional simulated pp collisions generated with Pythia8.186 [24] were overlaid to model the effects from additional collisions in the same and nearby bunch crossings. All simulated events were processed using the same reconstruction algorithms and analysis chain as the data, and small corrections were applied to lepton trigger and reconstruction efficiencies and resolutions to improve the agreement with the response observed in data.
The baseline t¯ t simulation sample was produced using the next-to-leading-order (NLO) in QCD matrix- element generator Powheg-Box v2 [25–27] with CT10 PDFs [10], interfaced to Pythia6 [28] with the Perugia 2012 tune [29] for parton shower, fragmentation and underlying event modelling. The h
dampparameter, that gives a cutoff scale for the first gluon emission, was set to m
t, a setup which was found to give the best modelling of the t¯ t system p
Tat
√ s = 7 TeV [30]. The EvtGen [31] package was used to better simulate the decay of heavy-flavour hadrons.
Alternative t¯ t simulation samples were generated using Powheg interfaced to Herwig++ [32], and Mad- graph5_aMC@NLO [33] interfaced to Herwig++. The effects of initial and final state radiation were explored using two alternative Powheg + Pythia6 samples, one with h
dampset to 2 m
t, the factorisation and renormalisation scale varied by a factor of 0.5 and using the Perugia 2012 radHi tune, giving more parton shower radiation, and one with the Perugia 2012 radLo tune, h
damp= m
tand the factorisation and renormalisation scale varied by a factor of 2, giving less parton shower radiation. The samples were simulated following the recommendations documented in [34]. The top quark mass was set to 172.5 GeV in all these simulation samples.
Backgrounds in this measurement can be classified into two types: those with two real prompt leptons
from W or Z decays (including those produced via leptonic decays of tau leptons), and those where at
least one of the reconstructed lepton candidates is ‘fake’, i.e. a non-prompt lepton produced from the
decay of a bottom or charm hadron, an electron arising from a photon conversion, a jet misidentified as an
electron, or a muon produced from an in-flight decay of a pion or kaon. Backgrounds containing two real prompt leptons include single top production in association with a W boson ( W t ), Z +jets production with Z → ττ → eµ , and diboson production ( W W , W Z and Z Z ) where both bosons decay leptonically.
The dominant W t single top background was modelled using Powheg-Box v2 + Pythia6 with the CT10 PDFs and the Perugia 2012 tune, using the ‘diagram removal’ generation scheme [35]. The Z +jets background was modelled using Sherpa 2.1.1 [36]: matrix elements (ME) were calculated for up to two partons at NLO and four partons at leading order using the Comix [37] and OpenLoops [38] matrix element generators and merged with the Sherpa parton shower (PS) using the ME + PS@NLO [39]
prescription; the CT10 PDF set was used in conjunction with dedicated parton shower tuning in Sherpa.
Diboson production with additional jets was also simulated using Sherpa 2.1.1 and CT10 PDFs as described above, the four-leptons final state, the three-leptons final state with two different-flavour leptons, and the two-leptons final state were simulated covering Z Z , ZW and W W production, and including off-shell Z -boson contributions. Same-sign W W production from QCD and electroweak processes were included. Alternative W t and diboson simulation samples were generated using Powheg + Herwig++ and Powheg + Pythia8, respectively, to estimate the background modelling uncertainties.
The majority of the background with at least one fake lepton in the selected sample arises from t¯ t production where only one of the top quarks decays leptonically, which was simulated as for dileptonic t¯ t production as discussed earlier. Other processes with one real lepton which can contribute to this background include the t -channel single top production, modelled using Powheg-Box v1 + Pythia6, and W +jets with the W decaying to eν , µν or τν where the τ -lepton subsequently decays leptonically. This background was modelled using Powheg-Box v2 + Pythia8 with the CT10 PDFs. The small expected contribution from t¯ t in association with a W or Z to the same-sign e µ sample used for background estimation is modelled using MadGraph + Pythia8 [40]. Other backgrounds, including processes with two misidentified leptons, are negligible.
4 Object and event selection
This measurement makes use of reconstructed electrons, muons and b -tagged jets. The object and event selections largely follow those used in the earlier publication, in particular the same kinematic cuts are used for electrons and jets, and very similar ones are used for muons.
Electron candidates are reconstructed from an isolated electromagnetic calorimeter energy deposit
matched to an inner detector track and passing a medium likelihood-based requirement [41, 42], within
the fiducial region of transverse energy E
T> 25 GeV and pseudorapidity |η| < 2 . 47. Candidates within
the transition region between the barrel and endcap electromagnetic calorimeters, 1 . 37 < |η| < 1 . 52,
are removed. The electron candidates must satisfy the requirements on the transverse impact parameter
significance calculated with respect to the beamline of |d
0,sig| < 5 and on the longitudinal impact parameter
calculated with respect to the primary vertex of | z
0sin θ | < 0 . 5 mm. Electrons are required to be isolated
using requirements on the calorimeter energy in a cone of ∆R < 0 . 2 around the electron (excluding the
deposit from the electron itself) divided by the electron p
T, and on the sum of track p
Tin a variable-sized
cone around the electron direction (again excluding the electron track itself). The track isolation cone
radius is given by the smaller of ∆R = 10 GeV /p
T( e) and ∆R = 0 . 2, i.e. a cone which increases in size
at low p
Tup to a maximum of 0.2 radians. Selection criteria, dependent on p
Tand η , are applied to
produce a nominal efficiency of 90 % on electrons from Z → ee decays with p
Tof 25 GeV which rises
to 99 % at 60 GeV. The efficiencies in t¯ t events are smaller, due to the increased jet activity. To prevent
double-counting of electron energy deposits as jets, the closest jet within ∆R < 0 . 2 of a reconstructed electron is removed. Finally, if the nearest jet surviving the above selection is within ∆R < 0 . 4 of the electron, the electron is discarded, to ensure it is sufficiently separated from nearby jet activity.
Muon candidates are reconstructed by combining matching tracks reconstructed in both the inner detector and muon spectrometer, and required to satisfy p
T> 25 GeV and |η | < 2 . 4. Muons are also required to be isolated, using the same requirement as for electrons, with the selection criteria tuned to give similar efficiencies on Z → µµ events. The muon candidates must satisfy the requirements on the transverse impact parameter significance and on the longitudinal impact parameter of |d
0,sig| < 3 and
| z
0sin θ | < 0 . 5 mm, respectively. To reduce the background from muons from heavy-flavour decays inside jets, muons are removed if they are separated from the nearest jet by ∆R < 0 . 4. However, if this jet has fewer than three associated tracks, the muon is kept and the jet is removed instead; this avoids an inefficiency for high-energy muons undergoing significant energy loss in the calorimeter.
Jets are reconstructed using the anti- k
talgorithm [43, 44] with radius parameter R = 0 . 4, starting from topological clusters of deposited energy in the calorimeters. Jets are calibrated using an energy- and η -dependent simulation-based calibration scheme with corrections derived from data. No corrections for semileptonic b -hadron decays are applied. Jets are accepted within the fiducial region p
T> 25 GeV and |η | < 2 . 5. To reduce the contribution from jets associated with pileup, jets with p
T< 50 GeV and
|η | < 2 . 4 are required to pass a pileup rejection veto [45].
Jets are b -tagged as likely to contain b hadrons using the MV2c20 algorithm [46], a multivariate discrim- inant making use of track impact parameters and reconstructed secondary vertices. Jets are defined as being b -tagged if the MV2c20 weight is larger than a threshold value corresponding to approximately 70%
b -tagging efficiency for b -jets in t t ¯ events, although the exact efficiency varies with p
T. In simulation, the tagging algorithm gives a rejection factor of about 440 against light-quark and gluon jets, and about eight against jets originating from charm quarks.
Events are rejected if the selected electron and muon are separated by ∆φ < 0 . 15 rad and ∆θ < 0 . 15 rad, where ∆ φ and ∆ θ are the differences in polar and azimuthal angles between the two leptons. This require- ment rejects events where a muon undergoes significant energy loss in the electromagnetic calorimeter, thus leading to a reconstructed electron candidate. Events passing the above requirements, and having exactly one selected electron and one selected muon of opposite electric charge sign (OS), define the e µ preselected sample. The corresponding same-sign (SS) sample is used in the estimation of background from events with misidentified leptons. Events are then further classified into those with exactly one or exactly two b -tagged jets.
5 Extraction of the t t ¯ cross-section
The t¯ t cross-section is measured in the dileptonic e µ channel, where one top quark decays as t → W b → eνb and the other as t → W b → µνb 2. The final states from the leptonic tau decays are also included.
As in Ref. [13], σ
t¯tis determined by counting the numbers of opposite-sign eµ events with exactly one ( N
1) and exactly two ( N
2) b -tagged jets, ignoring any jets that are not b -tagged which may be present, due
2
Charge-conjugate modes are implied unless otherwise stated.
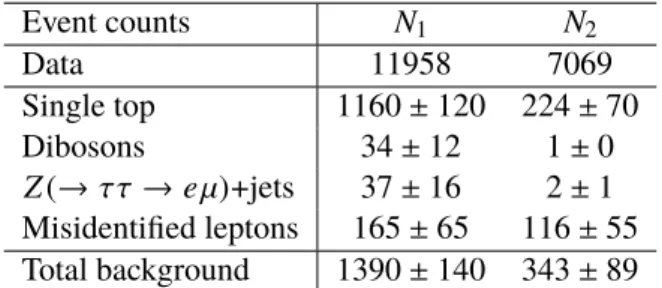
Event counts N
1N
2Data 11958 7069
Single top 1160 ± 120 224 ± 70
Dibosons 34 ± 12 1 ± 0
Z (→ ττ → eµ) +jets 37 ± 16 2 ± 1 Misidentified leptons 165 ± 65 116 ± 55 Total background 1390 ± 140 343 ± 89
Table 1: Observed numbers of opposite-sign eµ events with one and two b -tagged jets ( N
1and N
2), together with the estimates of non- t t ¯ backgrounds and associated systematic uncertainties. Uncertainties quoted as 0 are < 0 . 5.
e.g. to light-quark or gluon jets from QCD radiation or b -jets from top quark decays that are not b -tagged.
The two event counts can be expressed as:
N
1= Lσ
tt¯eµ2
b( 1 − C
bb) + N
bkg1
N
2= Lσ
tt¯eµC
bb2+ N
bkg2
(1)
where L is the integrated luminosity of the sample and
eµthe efficiency for a t¯ t event to pass the opposite-sign e µ preselection. The combined probability for a jet from the quark q in the t → W q decay to fall within the acceptance of the detector, be reconstructed as a jet with transverse momentum above the selection threshold, and be tagged as a b -jet, is denoted by
b. If the decays of the two top quarks and the subsequent reconstruction of the two b -tagged jets are completely independent, the probability to tag both b -jets
bbis given by
bb=
b2. In practice, small correlations are present for both kinematic and instrumental reasons, and these are taken into account via the tagging correlation coefficient C
b, defined as C
b=
bb/
b2. Background from sources other than t¯ t → e µννb b ¯ also contributes to the event counts N
1and N
2, and is given by the background terms N
bkg1
and N
bkg2
. The preselection efficiency
eµand tagging correlation C
bare taken from t¯ t event simulation and are about 0 . 83% and 1 . 002, respectively, and the background contributions N
bkg1
and N
bkg2
are estimated using a combination of simulation and data-based methods as described in Section 6, allowing the two equations (1) to be solved yielding σ
tt¯and
bby minimising a likelihood function.
In the method outlined above used to measure the inclusive t¯ t cross-section, some of the largest systematic uncertainties come from the use of simulation to estimate the preselection efficiency
eµ. This efficiency can be factorised into the product of two terms:
eµ= A
eµG
eµ. The acceptance A
eµrepresents the fraction of t¯ t events which have a true e µ pair within the detector acceptance ( p
T> 25 GeV and |η | < 2 . 5).
G
eµrepresents the ratio of reconstructed t¯ t events to t¯ t events with a true e µ pair within the fiducial region, where the numerator includes the approximately 2% of reconstructed t¯ t events where one or both leptons have true p
T< 25 GeV. The fiducial cross-section σ
fidt¯tis defined as σ
fidtt¯
= A
eµσ
tt¯and measured
following the same technique as in Ref. [13] avoiding the systematic uncertainties associated with A
eµ.
A total of 30879 data events passed the e µ opposite-sign preselection. Table 1 shows the number of events
with one and two b -tagged jets, together with the estimates of non- t t ¯ background and their systematic
uncertainties discussed in detail below. In simulation, the sample with one b -tagged jet is expected to be
about 89 % pure in t¯ t events, with the dominant background coming from W t single top production, and
smaller contributions from events with misidentified leptons, Z +jets and dibosons. The sample with two
b -tagged jets is expected to be about 96% pure in t t ¯ events, with W t production again being the dominant
background.
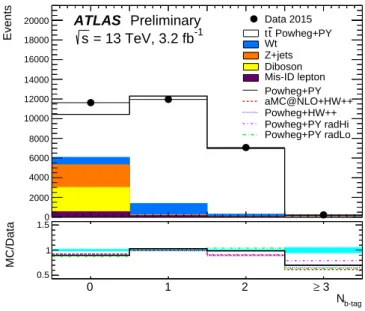
The distribution of the number of b -tagged jets in opposite-sign e µ events is shown in Figure 1, and compared to the baseline and alternative t¯ t and background simulation samples. The t¯ t contribution is normalised to the theoretical prediction of 832 pb for the t¯ t cross-section at
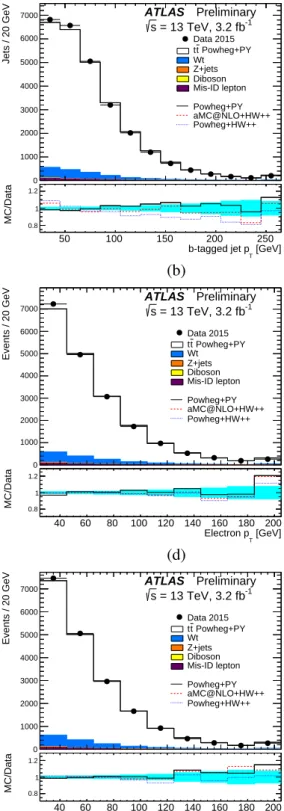
√ s = 13 TeV. The agreement between data and simulation in the one and two b -tagged bins used for the cross-section measurement is good. However, the data has about 40 % more events with three or more b -tags than the baseline simulation, indicating a potential mismodelling of events with t¯ t in association with additional heavy-flavour jets, as discussed further in Section 7. The 11 % excess of data over simulation for events with zero b -tagged jets does not affect the measurement, and is compatible with the expected uncertainties in modelling Z +jets and in particular W W production [47]. Distributions of the number of jets, the jet p
T, and the electron and muon |η | and p
Tare shown for opposite-sign e µ events with at least one b -tagged jet in Figure 2, where the simulation is normalised to the same number of events as the data. In general, the agreement between data and simulation is good.
b-tag
N
−0.5 0 0.5 1 1.5 2 2.5 3 3.5
Events
0 2000 4000 6000 8000 10000 12000 14000 16000 18000
20000
ATLAS Preliminary = 13 TeV, 3.2 fb
-1s
Data 2015 Powheg+PY t
t Wt Z+jets Diboson Mis-ID lepton Powheg+PY aMC@NLO+HW++
Powheg+HW++
Powheg+PY radHi Powheg+PY radLo
b-tag
N
0 1 2 ≥ 3
MC/Data
0.5 1 1.5
Figure 1: Distribution of the number of b -tagged jets in preselected opposite-sign eµ events. The data are shown compared to the expectation from simulation, broken down into contributions from t t ¯ (using the baseline Powheg+Pythia6 sample), W t single top, Z +jets, dibosons, and events with fake electrons or muons, normalised to the same integrated luminosity as the data. The lower part of the figure shows the ratio of simulation to data, using various t t ¯ signal samples, and the cyan band indicates the statistical uncertainty. The t¯ t contribution is normalised to the theoretical prediction of 832 pb for the t t ¯ cross-section at
√ s = 13 TeV.
6 Background estimation
Most background contributions are estimated from simulation. The W t single top background is normal-
ised to the approximate NNLO cross-section of 71 . 7 ± 3 . 8 pb, determined as in Ref. [48]. The diboson
background normalisation is estimated using Sherpa as discussed in Section 3. The normalisation of the
Z +jets background, originating from events with a Z → ττ → e µ decay accompanied by one or two
b -tagged jets, is determined by scaling the Sherpa simulation with scale factors obtained in Z → ee and
Z → µµ events as described in Section 7.
Njet
1 2 3 4 5 6
Events
0 1000 2000 3000 4000 5000 6000 7000
8000 ATLAS Preliminary = 13 TeV, 3.2 fb-1
s
Data 2015 Powheg+PY t
t Wt Z+jets Diboson Mis-ID lepton Powheg+PY aMC@NLO+HW++
Powheg+HW++
Njet
1 2 3 4 5 ≥ 6
MC/Data
0.8 1 1.2
(a)
[GeV]
b-tagged jet pT
50 100 150 200 250
Jets / 20 GeV
0 1000 2000 3000 4000 5000 6000
7000 ATLAS Preliminary = 13 TeV, 3.2 fb-1
s
Data 2015 Powheg+PY t
t Wt Z+jets Diboson Mis-ID lepton Powheg+PY aMC@NLO+HW++
Powheg+HW++
[GeV]
T
b-tagged jet p
50 100 150 200 250
MC/Data
0.8 1 1.2
(b)
η| Electron |
0 0.5 1 1.5 2 2.5
Events / 0.25
0 500 1000 1500 2000 2500 3000
3500 ATLAS Preliminary = 13 TeV, 3.2 fb-1
s
Data 2015 Powheg+PY t
t Wt Z+jets Diboson Mis-ID lepton Powheg+PY
aMC@NLO+HW++
Powheg+HW++
η| Electron |
0 0.5 1 1.5 2 2.5
MC/Data 0.9
1 1.1
(c)
[GeV]
Electron pT
40 60 80 100 120 140 160 180 200
Events / 20 GeV
0 1000 2000 3000 4000 5000 6000 7000
ATLAS Preliminary = 13 TeV, 3.2 fb-1
s
Data 2015 Powheg+PY t
t Wt Z+jets Diboson Mis-ID lepton Powheg+PY aMC@NLO+HW++
Powheg+HW++
[GeV]
T
Electron p
40 60 80 100 120 140 160 180 200
MC/Data 0.8
1 1.2
(d)
η| Muon |
0 0.5 1 1.5 2 2.5
Events / 0.25
0 500 1000 1500 2000 2500 3000
ATLAS Preliminary = 13 TeV, 3.2 fb-1
s
Data 2015 Powheg+PY t
t Wt Z+jets Diboson Mis-ID lepton Powheg+PY
aMC@NLO+HW++
Powheg+HW++
η| Muon |
0 0.5 1 1.5 2 2.5
MC/Data 0.9
1 1.1
(e)
[GeV]
Muon pT
40 60 80 100 120 140 160 180 200
Events / 20 GeV
0 1000 2000 3000 4000 5000 6000
7000 ATLAS Preliminary = 13 TeV, 3.2 fb-1
s
Data 2015 Powheg+PY t
t Wt Z+jets Diboson Mis-ID lepton Powheg+PY aMC@NLO+HW++
Powheg+HW++
[GeV]
T
Muon p
40 60 80 100 120 140 160 180 200
MC/Data 0.8
1 1.2
(f)
Figure 2: Distributions of (a) the number of jets, (b) the transverse momentum p
Tof the b -tagged jets, (c) the |η |
of the electron, (d) the p
Tof the electron, (e) the |η | of the muon and (f) the p
Tof the muon, in events with an
opposite-sign eµ pair and at least one b -tagged jet. The data are compared to the expectation from simulation,
broken down into contributions from t¯ t (using the baseline Powheg+Pythia6 sample), single top, Z +jets, dibosons,
and events with fake electrons or muons, normalised to the same number of entries as the data. The lower parts of
the figures show the ratios of simulation to data, using various t t ¯ signal samples, and with the cyan band indicating
the statistical uncertainty. The last histogram bin includes the overflow.
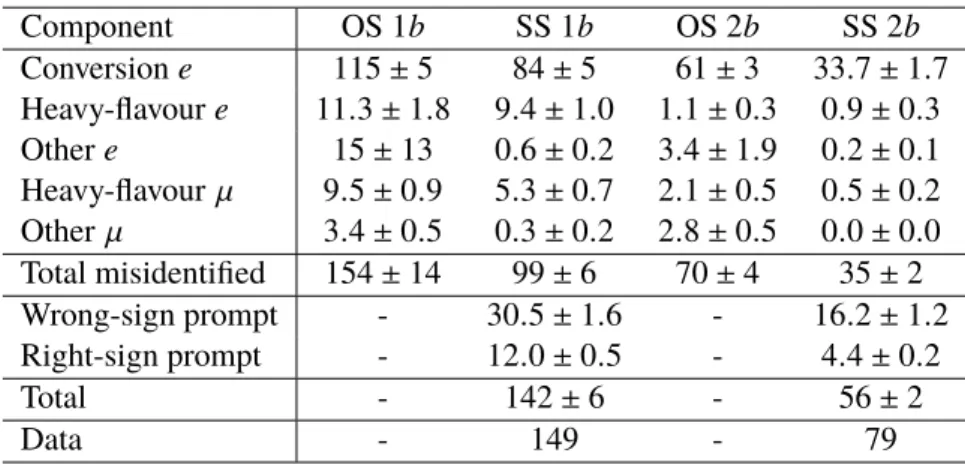
Component OS 1 b SS 1 b OS 2 b SS 2 b Conversion e 115 ± 5 84 ± 5 61 ± 3 33 . 7 ± 1 . 7 Heavy-flavour e 11 . 3 ± 1 . 8 9 . 4 ± 1 . 0 1 . 1 ± 0 . 3 0 . 9 ± 0 . 3 Other e 15 ± 13 0 . 6 ± 0 . 2 3 . 4 ± 1 . 9 0 . 2 ± 0 . 1 Heavy-flavour µ 9 . 5 ± 0 . 9 5 . 3 ± 0 . 7 2 . 1 ± 0 . 5 0 . 5 ± 0 . 2 Other µ 3 . 4 ± 0 . 5 0 . 3 ± 0 . 2 2 . 8 ± 0 . 5 0 . 0 ± 0 . 0 Total misidentified 154 ± 14 99 ± 6 70 ± 4 35 ± 2 Wrong-sign prompt - 30 . 5 ± 1 . 6 - 16 . 2 ± 1 . 2 Right-sign prompt - 12 . 0 ± 0 . 5 - 4 . 4 ± 0 . 2
Total - 142 ± 6 - 56 ± 2
Data - 149 - 79
Table 2: The expected numbers of events with at least one misidentified lepton in the one and two b -tag opposite- and same-sign eµ samples, broken down into different categories as described in the text. For the same-sign samples, the contributions from wrong-sign (where the electron charge sign is misreconstructed) and right-sign prompt lepton events are also shown, and the total expectations are compared to the data. The uncertainties are due to limited simulation statistics, and numbers quoted as ‘0.0’ are smaller than 0.05.
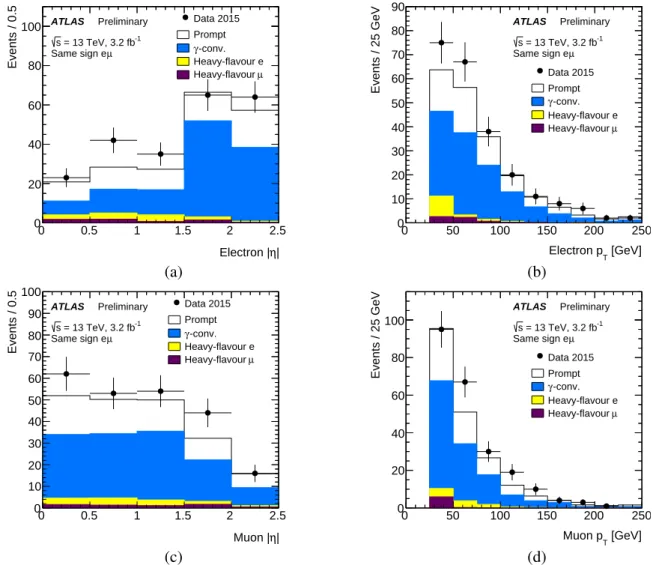
The background from events with one real and one misidentified lepton is estimated from a combination of data and simulation, using the method employed in Ref. [13]. Simulation studies show that the samples with a same-sign e µ pair and one or two b -tagged jets are dominated by events with a misidentified lepton, with rates comparable to those in the opposite-sign sample. The contributions of events with misidentified leptons are therefore estimated using the same-sign event counts in data after subtraction of the estimated prompt same-sign contributions, multiplied by the opposite- to same-sign fake-lepton ratios R
jfor j = 1 and 2 b -tagged jets predicted from simulation. The results are shown in Table 1 and the procedure is illustrated in Table 2, which shows the expected breakdown of same-sign event counts in terms of prompt and misidentified lepton events, and the corresponding predictions for misidentified leptons in the opposite-sign sample with all contributions estimated from simulation. The misidentified lepton contributions are classified into those where the electron is from a photon conversion, from the decay of a heavy-flavour hadron or from other sources ( e.g. a misidentified hadron within a jet), or the muon is from a heavy-flavour decay or other sources ( e.g. a pion or kaon decay). The values of R
jare taken to be R
1= 1 . 55 ± 0 . 50 and R
2= 1 . 99 ± 0 . 82. The uncertainties encompass the different values of R
jpredicted for the various sub-components of the misidentified lepton background, which is dominated by electrons from photon conversions, followed by electrons and muons from the decays of heavy-flavour hadrons. A 50 % uncertainty is assigned to the prompt same-sign contribution, which includes events where the charge of the electron was misidentified (denoted as wrong-sign prompt in Table 2) or right-sign with two genuine same-sign leptons ( e.g. from t¯ tW /Z production). The largest uncertainties on the misidentified lepton background come from the uncertainties on R
j.
The modelling in simulation of the different components of the misidentified lepton background is checked
by studying kinematic distributions of same-sign events, as illustrated for the p
Tand |η | distributions of
the leptons in events with at least one b -tagged jet in Figure 3. The simulation models the shapes of
the distributions well, but underestimates the number of data events with two b -tagged jets by about
40 %, as shown in Table 2. This deficit in simulation is attributed to a larger rate of misidentified lepton
events in data which increases the estimate of misidentified leptons in the opposite-sign two b -tag sample
accordingly. The modelling is also checked in same-sign control samples with relaxed isolation cuts,
enhancing the contributions of heavy-flavour decays, and similar levels of agreement were found, giving
η| Electron |
0 0.5 1 1.5 2 2.5
Events / 0.5
0 20 40 60 80
100 ATLAS Preliminary = 13 TeV, 3.2 fb-1
s
Data 2015 Prompt
-conv.
γ
Heavy-flavour e µ Heavy-flavour µ
Same sign e
(a)
[GeV]
Electron pT
0 50 100 150 200 250
Events / 25 GeV
0 10 20 30 40 50 60 70 80 90
ATLAS Preliminary = 13 TeV, 3.2 fb-1
s
Data 2015 Prompt
-conv.
γ
Heavy-flavour e µ Heavy-flavour
µ Same sign e
(b)
η| Muon |
0 0.5 1 1.5 2 2.5
Events / 0.5
0 10 20 30 40 50 60 70 80 90 100
ATLAS Preliminary = 13 TeV, 3.2 fb-1
s
Data 2015 Prompt
-conv.
γ
Heavy-flavour e µ Heavy-flavour µ
Same sign e
(c)
[GeV]
Muon pT
0 50 100 150 200 250
Events / 25 GeV
0 20 40 60 80 100
ATLAS Preliminary = 13 TeV, 3.2 fb-1
s
Data 2015 Prompt
-conv.
γ
Heavy-flavour e µ Heavy-flavour
µ Same sign e
(d)
Figure 3: Distributions of electron and muon |η | and p
Tin same-sign eµ events with at least one b -tagged jet. The simulation prediction is normalised to the same integrated luminosity as the data, and broken down into contributions where both leptons are prompt, or one is a misidentified lepton from a photon conversion or heavy-flavour decay.
In the p
Tdistributions, the last bin includes the overflow.
confidence that the simulation adequately models the different sources of misidentified leptons in the selected sample.
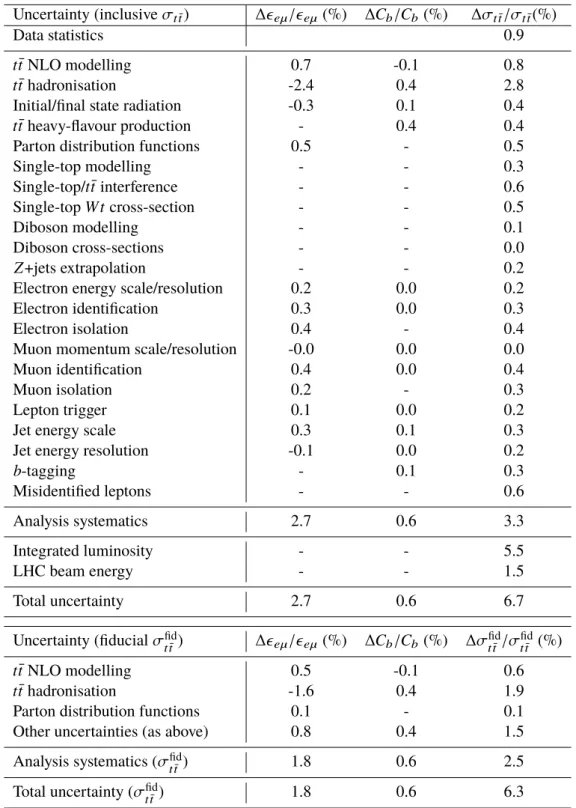
7 Systematic uncertainties
The systematic uncertainties on the extracted cross-section σ
tt¯are shown in Table 3, together with their
effects (where relevant) on the t¯ t preselection efficiency
eµand tagging correlation C
b. Each source
of uncertainty is evaluated by repeating the cross-section extraction with all relevant input parameters
simultaneously changed by ± 1 standard deviation. Correlations between input parameters (in particular
significant anti-correlations between
eµand C
bwhich contribute with opposite signs to σ
tt¯) are thus taken
into account. The total uncertainties are calculated by adding the effects of all the individual systematic
components in quadrature, assuming them to be independent. The sources of systematic uncertainty are discussed in detail below.
t t ¯ modelling: The modelling uncertainties on
eµand C
bdue to the choice of t t ¯ generator are as- sessed by comparing the predictions of the baseline Powheg + Pythia6 sample with the vari- ous alternative samples discussed in Section 3. Three separate uncertainties are considered:
the NLO generator uncertainty (evaluated by considering the relative difference between Mad- Graph5_aMC@NLO + Herwig++ and Powheg + Herwig++), the shower and hadronisation un- certainty (evaluated by considering the relative difference between Powheg + Pythia6 and Powheg + Herwig++), and the radiation uncertainty (evaluated by considering half the relative difference between the Powheg + Pythia6 samples with more or less radiation). The prediction for
eµis found to be particularly sensitive to the amount of hadronic activity near the leptons, which strongly affects the efficiency of the lepton isolation requirements described in Section 4. These isolation efficiencies are therefore measured directly from data, as discussed below, and thus no modelling uncertainty is considered for the lepton isolation. Motivated by the level of agreement seen for events with at least three b -tags seen in Figure 1, an additional uncertainty on C
bis determined by calculating the ratio R
32of the number of events with at least three b -tagged jets to the number with at least two. The baseline simulation sample is reweighted to change the fraction of events with at least three b -jets at truth level, which effectively changes the t t ¯ plus heavy flavour fraction and the values of both C
band R
32. A linear relation between changes in C
band R
32is found, and used to translate the the difference between the R
32values found in data (3 . 1 ± 0 . 2 % ) and simulation (2 . 21 ± 0 . 05 %) to a shift in C
bof 0.39 %. This shift was treated as an additional uncertainty on C
bdue to the modelling of heavy-flavour production in t¯ t events, uncorrelated to the NLO, hadronisation and radiation uncertainties discussed above.
Parton distribution functions: The uncertainties on
eµand C
bdue to limited knowledge of the proton PDFs are evaluated by reweighting simulated events produced with MadGraph5_aMC@NLO using the error sets of the NNPDF 3.0 PDF sets [49]. The eigenvectors consist of a central PDF and 100 Monte Carlo replicas, for which the root mean square was taken to calculate the uncertainty. The MadGraph5_aMC@NLO sample was produced with CT10, therefore the cross-section has been corrected for the relative difference between the central prediction of CT10 and NNPDF 3.0 which is about 1%. The uncertainty using the PDF4LHC Run-2 recommendations with 100 eigenvectors [50]
is very similar to that obtained with NNPDF 3.0.
Single top modelling: The uncertainties related to W t single top modelling are assessed by comparing the predictions between Powheg + Pythia6 and Powheg + Herwig++ and considering the relative difference, comparing the diagram removal and diagram subtraction schemes for dealing with the interference between the t¯ t and W t final states, and also considering half the relative difference between the Powheg + Pythia6 samples with more or less radiation. Production of single top quarks via the t - and s -channels gives rise to final states with only one prompt lepton, and is accounted for as part of the misidentified-lepton background.
Diboson modelling: The uncertainties in the background contributions from dibosons with one or two additional b -tagged jets were assessed by comparing the baseline prediction from Sherpa with that of Powheg+Pythia8. These uncertainties have a limited effect on the cross-section measurement due to the low number of diboson background events.
Background cross-sections: The uncertainties on the W t single top and diboson cross-sections are taken
to be 5.3 % [48] and 6 % [51], based on the corresponding theoretical predictions.
Uncertainty (inclusive σ
t¯t) ∆
eµ/
eµ(%) ∆C
b/C
b(%) ∆ σ
tt¯/σ
tt¯(%)
Data statistics 0.9
t¯ t NLO modelling 0.7 -0.1 0.8
t¯ t hadronisation -2.4 0.4 2.8
Initial/final state radiation -0.3 0.1 0.4
t¯ t heavy-flavour production - 0.4 0.4
Parton distribution functions 0.5 - 0.5
Single-top modelling - - 0.3
Single-top/ t t ¯ interference - - 0.6
Single-top W t cross-section - - 0.5
Diboson modelling - - 0.1
Diboson cross-sections - - 0.0
Z +jets extrapolation - - 0.2
Electron energy scale/resolution 0.2 0.0 0.2
Electron identification 0.3 0.0 0.3
Electron isolation 0.4 - 0.4
Muon momentum scale/resolution -0.0 0.0 0.0
Muon identification 0.4 0.0 0.4
Muon isolation 0.2 - 0.3
Lepton trigger 0.1 0.0 0.2
Jet energy scale 0.3 0.1 0.3
Jet energy resolution -0.1 0.0 0.2
b -tagging - 0.1 0.3
Misidentified leptons - - 0.6
Analysis systematics 2.7 0.6 3.3
Integrated luminosity - - 5.5
LHC beam energy - - 1.5
Total uncertainty 2.7 0.6 6.7
Uncertainty (fiducial σ
tfidt¯
) ∆
eµ/
eµ(%) ∆C
b/C
b(%) ∆σ
fidt¯t/σ
fidtt¯
(%)
t¯ t NLO modelling 0.5 -0.1 0.6
t¯ t hadronisation -1.6 0.4 1.9
Parton distribution functions 0.1 - 0.1
Other uncertainties (as above) 0.8 0.4 1.5
Analysis systematics ( σ
tfidt¯
) 1.8 0.6 2.5
Total uncertainty ( σ
fidtt¯
) 1.8 0.6 6.3
Table 3: Summary of the systematic uncertainties on
eµand C
b(with their relative signs where relevant), and the statistical, systematic, luminosity and beam energy uncertainties on the measured t t ¯ cross-section σ
t¯tat
√ s = 13 TeV.
All uncertainties from the inclusive cross-section measurement apply to the fiducial measurement; in the lower part of the table only the systematic uncertainties that are different for the measurement of the fiducial cross-section σ
fidt¯t
are given, together with the total analysis systematic and total uncertainties on σ
t¯fidt. Uncertainties quoted as "0.0"
are smaller than 0.05%, whilst "-" indicates that the corresponding uncertainty is not applicable.
Z +jets extrapolation: The cross-sections for Z +jets and especially Z +heavy-flavour jets are subject to large theoretical uncertainties, making purely simulation-based estimates unreliable. This back- ground was therefore determined by measuring the rates of Z → ee and Z → µµ events with one and two b -tagged jets in both data and simulation, and using the resulting ratio to scale the simulation estimate of background from Z → ττ +jets. The Z +jets background prediction from simulation was scaled by 1.1 for the one b -tagged jet background and by 1.2 for the two b -tagged jets background. A conservative 50 % uncertainty was applied to the Z +jets contributions.
Lepton-related uncertainties: The modelling of the electron and muon trigger efficiencies, identification efficiencies, energy scales and resolutions are studied using Z → ee and Z → µµ decays in data and simulation. Small corrections are applied to the simulation to improve the agreement with the response observed in data. These corrections have associated uncertainties that are propagated to the cross-section measurement. The uncertainty on the trigger efficiency is small compared to those for electron or muon identification since most events are triggered redundantly by both leptons. The efficiency of the lepton isolation requirements was measured directly in data t t ¯ events by relaxing the cuts alternately on electrons and muons as in Ref. [13]. The results, after the correction for the contamination from misidentified leptons estimated using the same-sign e µ samples as described in Section 6, showed that the baseline Powheg+Pythia6 simulation overestimates the efficiencies of the isolation requirements by about 0.2% for both the electrons and muons. These corrections were applied to
eµand the corresponding uncertainties are dominated by the subtraction of misidentified leptons.
Jet-related uncertainties: Although the efficiency to reconstruct and b -tag jets from t t ¯ events is extracted from the data, uncertainties in the jet energy scale, energy resolution and reconstruction efficiency affect the backgrounds estimated from simulation and the estimate of the tagging correlation C
b. They also have a small effect on
eµvia the lepton-jet ∆R separation cuts. The jet energy scale is varied in simulation according to the uncertainties derived from the
√ s = 8 TeV simulation and data calibration, extrapolated to
√ s = 13 TeV [52]. The uncertainties are evaluated using a model with 19 separate orthogonal components which were then added in quadrature. The jet energy resolution uncertainty is also assessed using
√ s = 8 TeV data, and extrapolated to
√ s = 13 TeV.
b-tagging uncertainties: The correlation C
bdepends weakly on the b -tagging and mistagging efficiencies predicted by the simulation, as it is evaluated from the numbers of events with one and two b -tagged jets. The uncertainties are determined from
√ s = 8 TeV data, with additional uncertainties to account for the presence of the new IBL detector and the extrapolation to
√ s = 13 TeV. Since the definition of
eµdoes not involve b -tagged jets, it has no b -tagging or mistagging-related uncertainties.
Misidentified leptons: The uncertainties on the number of events with misidentified leptons in the one and two b -tagged samples are derived from the statistical uncertainties on the numbers of same- sign lepton events, the systematic uncertainties on the opposite- to same-sign ratios R
j, and the uncertainties on the numbers of prompt same-sign events, as discussed in detail in Section 6.
Integrated luminosity: The uncertainty on the integrated luminosity is 5 %. It is derived, following a
methodology similar to that detailed in Ref. [53], from a preliminary calibration of the luminosity
scale using x - y beam-separation scans performed in August 2015. The effect on the cross-section
measurement is slightly larger than 5 % because the W t single top and diboson backgrounds are
evaluated from simulation, so they are also sensitive to the assumed integrated luminosity.
LHC beam energy: The LHC beam energy during the 2012 pp run was calibrated to be 0 . 30 ± 0 . 66 % smaller than the nominal value of 4 TeV per beam, using the revolution frequency difference of protons and lead ions during p +Pb runs in early 2013 [54]. This relative uncertainty is also applicable to the 2015 pp run. Since this calibration is compatible with the nominal
√ s of 13 TeV, no correction is applied to the measured σ
tt¯value. However, an uncertainty of 1.5 %, corresponding to the expected change in σ
tt¯for an 0.66 % change in
√ s is quoted separately on the final result.
Top-quark mass: Alternative t t ¯ samples generated with different m
tfrom 170 to 177.5 GeV are used to quantify the dependence of the acceptance for t¯ t on the assumed m
tvalue. The level of W t background based on the change in the W t cross-section for the same mass range is also considered.
The t¯ t acceptance and background effects partially cancel, and the final dependence of the result on the assumed m
tvalue is determined to be d σ
t¯t/ d m
t= − 0 . 3 % / GeV. The result of the analysis is reported for a top mass of 172.5 GeV, and the small dependence of the cross-section on the assumed mass is not included in the quoted total systemic uncertainty.
The total systematic uncertainties on
eµ, C
band the fitted value of σ
tt¯are shown in Table 3, and the total systematic uncertainties on the individual background components are shown in Table 1. The dominant uncertainties on the cross-section result come from the luminosity determination and t t ¯ modelling, in particular from the t¯ t shower and hadronisation uncertainty.
8 Results and conclusions
The inclusive t t ¯ production cross-section is measured using an ATLAS pp collision data sample of 3.2 fb
−1at the LHC at
√ s = 13 TeV in the dilepton t¯ t → e µννb b ¯ decay channel. The numbers of opposite-sign e µ events with one and two b -tagged jets are counted, allowing a simultaneous determination of the t¯ t cross-section σ
t¯tand the probability to reconstruct and b -tag a jet from a t¯ t decay. Assuming a top quark mass of m
t= 172 . 5 GeV, the result is:
σ
t¯t= 803 ± 7 (stat) ± 27 (syst) ± 45 (lumi) ± 12 (beam) pb ,
where the four uncertainties are due to data statistics, experimental and theoretical systematic effects, the integrated luminosity and the LHC beam energy, giving a total relative uncertainty of 6.7 %. The combined probability for a jet from a top decay to be within the detector acceptance and tagged as a b -jet is measured to be
b= 0 . 559 ± 0 . 004 ± 0 . 003, where the first error is statistical and the second systematic, in reasonable agreement with the nominal prediction from simulation of 0.549.
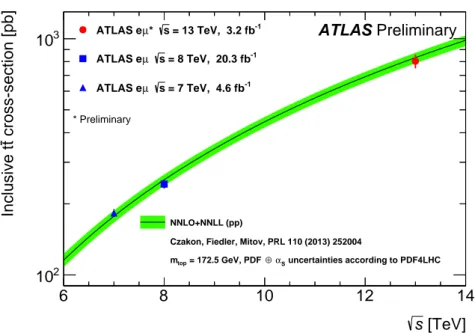
This measurement is consistent with the theoretical prediction based on NNLO+NNLL calculations of 832
+40−46pb at m
t= 172 . 5 GeV. Figure 4 shows the result for σ
t¯ttogether with the most precise ATLAS results at
√ s = 7–8 TeV [13]. The data are compared to the NNLO+NNLL predictions as a function of
√ s . The result is also consistent with a previous measurement by CMS at
√ s = 13 TeV using a much smaller data sample [55].
The fiducial measurement of the cross-section σ
tfidt¯
for a t¯ t event producing an e µ pair, each lepton coming directly from t → W → ` or via a leptonic τ decay t → W → τ → ` and satisfying p
T> 25 GeV and
|η | < 2 . 5 is:
σ
fidt¯t= 11 . 12 ± 0 . 10 ( stat ) ± 0 . 28 ( syst ) ± 0 . 62 ( lumi ) ± 0 . 17 ( beam ) pb ,
[TeV]
s
6 8 10 12 14
cross-section [pb]t Inclusive t
10
210
3ATLAS Preliminary
* Preliminary
= 13 TeV, 3.2 fb-1
s µ* ATLAS e
= 8 TeV, 20.3 fb-1
µ s ATLAS e
= 7 TeV, 4.6 fb-1
µ s ATLAS e
NNLO+NNLL (pp)
Czakon, Fiedler, Mitov, PRL 110 (2013) 252004
uncertainties according to PDF4LHC αS
⊕ = 172.5 GeV, PDF mtop