ATLAS-CONF-2016-111 30September2016
ATLAS NOTE
ATLAS-CONF-2016-111
26th September 2016
Light-by-light scattering in ultra-peripheral Pb+Pb collisions at
√ s
NN=5.02 TeV with the ATLAS detector at the LHC
The ATLAS Collaboration
Abstract
This note reports evidence for light-by-light scattering, using 480 µb−1 of Pb+Pb collision data at√
sNN=5.02 TeV recorded by the ATLAS experiment at the LHC. After background subtraction and analysis corrections, the cross section ofγγ→γγprocess for photon trans- verse momentum, ET > 3 GeV, photon pseudorapidity, |η| < 2.4, diphoton invariant mass greater than 6 GeV, diphoton transverse momentum lower than 2 GeV and diphoton aco- planarity below 0.01, has been measured to be 70±20 (stat.)±17 (syst.) nb, which is in agreement with the SM prediction of 49±10nb.
© 2016 CERN for the benefit of the ATLAS Collaboration.
Reproduction of this article or parts of it is allowed as specified in the CC-BY-4.0 license.
1 Introduction and measurement strategy
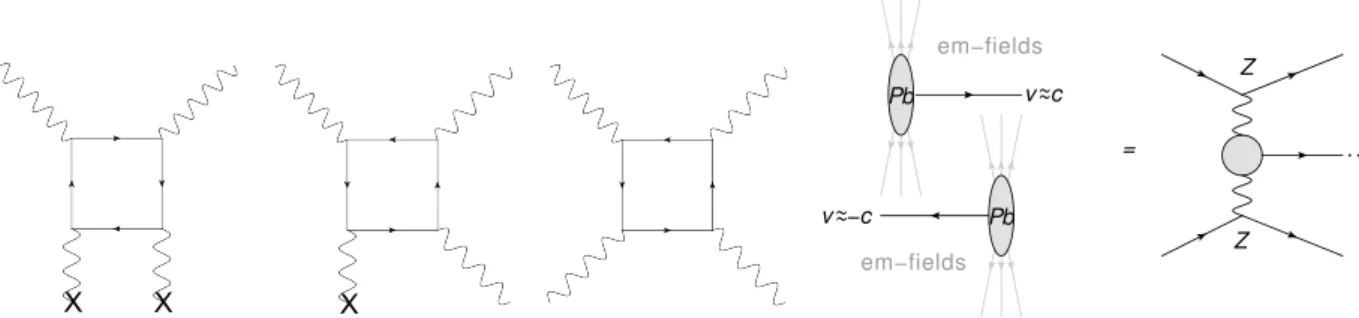
One of the key features of Maxwell’s Equations is their linearity, from which follows the superposition principle. This forbids effects like light-by-light (LbyL) scattering,γγ →γγ, which is a pure quantum- mechanical process. It was realised in the early history of Quantum Electrodynamics (QED) that this effect is related to the polarisation of the vacuum [1]. In QED, theγγ→γγreaction proceeds at lowest order in the fine structure constant via virtual one-loop box diagrams involving fermions (Figure1), which is anO(α4em)≈3×10⁻⁹process. However, in various extensions of the Standard Model (SM), extra virtual contributions are possible, making the measurement of LbyL scattering sensitive to new physics [2–10].
LbyL scattering via an electron loop has been precisely, albeit indirectly, tested in the measurements of the anomalous magnetic moment of the electron and muon [11,12], where it is predicted to contribute substantially. Theγγ → γγ reaction has been measured in photon scattering in the Coulomb field of a nucleus (Delbrück scattering) [13–16] and in the photon splitting process [17].
LbyL interactions can also occur in relativistic heavy ion collisions at large impact parameters, i.e. larger than twice the radius of the ions (Figure2). The strong interaction does not play a role in these ‘ultra- peripheral collision’ (UPC) events. The feasibility of measuringγγ → γγscattering in hadron–hadron collisions was recently studied in Ref. [18]. Relativistic ions generate strong electromagnetic (EM) fields, e.g. 1014T from the coherent action of the lead nucleus with atomic numberZ =82 protons, which can be described in the equivalent photon approximation (EPA) [19,20]. Here, the EM-fields are interpreted as beam of quasi-real photons with a virtuality of−Q2 < 1/R2, where R is the radius of the charge distribution and soQ2 < 4×10⁻³GeV2for nuclei with atomic mass number A& 16. The cross-section of the photon–photon interactions scale with∼ Z4, i.e. is enhanced for ion beams.
X X X
Figure 1: Diagrams for Delbrück scattering (left), photon splitting (middle) and elastic LbyL scattering (right). Each cross denotes ex- ternal field legs, e.g., an atomic Coulomb field or a strong background magnetic field.
v −c~
=
Z
Z em−fields
em−fields
~
v c~~ Pb
Pb
. .
Figure 2: Illustration of an ultraperipheral col- lision of two lead ions.
In this measurement, the final-state signature of interest is the exclusive production of two photons, Pb+Pb → Pb+Pb+γ + γ where the diphoton final-state is measured in the central detector, and the incoming lead ions (Pb) survive the EM interaction, with a possible EM excitation [21]. Hence, it is expected to detect two low-energy photons and no further activity in the detector, in particular no reconstructed charged-particle tracks coming from an interaction region. In this analysis, the fiducial cross-section of the processγγ → γγ in lead–lead collisions, recorded at a centre-of-mass energy of
√sNN=5.02 TeV is measured. This data set was recorded with the ATLAS detector in 2015 and has an integrated luminosity of
R Ldt =480µb−1after removing events in periods of time in which there were
known problems in data taking or detector status. The fiducial volume of the diphoton final state is defined using the following requirements:
• Two photons withET >3 GeV and|η| <2.4
• Diphoton invariant mass,mγγ >6 GeV
• Diphoton transverse momentum,pγγ
T <2 GeV
• Diphoton acoplanarity, 1−∆φπγγ <0.01
In addition to the measured fiducial cross-section, the significance on the observed number of signal candidate events is given, assuming the background-only hypothesis.
The note is structured as follows: the ATLAS detector is briefly introduced in Section 2. The data and Monte Carlo samples as well as the signal selection are described in Sections3and4, respectively.
Dedicated detector calibration procedures are discussed in Section5, since the analysis is based on low- energy photons and special trigger requirements, which are not typically used in most ATLAS analyses.
The estimation of background contributions is presented in Section6. Section7is dedicated to the final kinematic distributions, the cross-section measurement and an estimation of the signal significance.
2 ATLAS Detector
The ATLAS detector [22] at the LHC covers nearly the entire solid angle around the collision point. It consists of an inner tracking detector surrounded by a thin superconducting solenoid, electromagnetic and hadronic calorimeters, and a muon spectrometer incorporating three large superconducting toroid magnets. The inner-detector system (ID) is immersed in a 2 T axial magnetic field and provides charged particle tracking in the range|η| <2.51.
The high-granularity silicon pixel detector (Pixel) covers the vertex region which typically provides four measurements per track, with the first hit being normally in the Insertable B-Layer (IBL) [23], which was installed at a mean sensor radius of 3.3 cm before the start of Run 2. It is followed by the silicon microstrip tracker (SCT) which usually provides four two-dimensional measurement points per track. These silicon detectors are complemented by the transition radiation tracker, which enables radially extended track reconstruction up to|η| =2.0.
The calorimeter system covers the pseudorapidity range|η| < 4.9. Within the region|η| < 3.2, electro- magnetic calorimetry is provided by barrel and endcap lead/liquid-argon (LAr) electromagnetic calori- meters (high-granularity for |η| < 2.5), with an additional thin LAr presampler covering |η| < 1.8, to correct for energy loss in material upstream of the calorimeters. Hadronic calorimetry is provided by the steel/scintillating-tile calorimeter, segmented into three barrel structures within|η| < 1.7, and two cop- per/LAr hadronic endcap calorimeters. The solid angle coverage is completed with forward copper/LAr and tungsten/LAr calorimeter modules (FCal) optimised for electromagnetic and hadronic measurements respectively.
1ATLAS uses a right-handed coordinate system with its origin at the nominal interaction point (IP) in the centre of the detector and thez-axis along the beam pipe. The x-axis points from the IP to the centre of the LHC ring, and the y-axis points upwards. Cylindrical coordinates(r, φ) are used in the transverse plane, φbeing the azimuthal angle around the z-axis.
The pseudorapidity is defined in terms of the polar angleθasη =−ln tan(θ/2). Angular distance is measured in units of
∆R≡
q(∆η)2+(∆φ)2. The photon (electron) transverse energy isET=E/cosh(η), whereEis its energy.
The muon spectrometer (MS) comprises separate trigger and high-precision tracking chambers measuring the deflection of muons in a magnetic field generated by superconducting air-core toroids. The precision chamber system covers the region|η| < 2.7 with three layers of monitored drift tubes, complemented by cathode strip chambers in the forward region, where the background is highest. The muon trigger system covers the range|η| < 2.4 with resistive plate chambers in the barrel, and thin gap chambers in the endcap regions.
The ATLAS minimum bias trigger scintillators (MBTS) consist of scintillator slats positioned between the ID and the endcap calorimeters with each side having an outer ring of 4 slats segmented in azimuthal angle, covering 2.07 < |η| < 2.76 and an inner ring of 8 slats, covering 2.76 < |η| < 3.86. The ATLAS zero degree calorimeters (ZDC) consist of four longitudinal compartments on each side of the interaction point, each with one nuclear interaction length of tungsten absorber, with the Cerenkov light read out by 1.5 mm quartz rods. The detectors are located 140 m from the nominal interaction point in both directions, covering|η|> 8.3.
The ATLAS trigger system [24] consists of a Level-1 trigger implemented using a combination of dedicated electronics and programmable logic, and a software-based high-level trigger (HLT).
3 Data and Monte Carlo samples
The data used in this measurement is from the lead–lead collisions with a centre-of-mass energy of√ sNN
=5.02 TeV, recorded at the LHC in 2015. The full data set corresponds to an integrated luminosity of 480µb−1of Pb+Pb data, with a total uncertainty of 6%. These values have been improved with respect to the initial integrated luminosity estimation presented in Ref. [25]. The central value for the luminosity and its uncertainty were derived following a methodology similar to that detailed in Refs [26,27], from a preliminary calibration of the luminosity scale usingx−ybeam-separation scans performed in December 2015.
Signal events are generated using calculations from Kłusek-Gawenda et al. [28]. They take into account box diagrams with leptons and quarks in the loops (such as the Feynman diagram in Figure 1). The contributions from W-boson loops are omitted in the calculations since they are only important for diphoton massesmγγ > 2mW. The calculations are then folded with the Pb+Pb EPA from the Starlight 1.1 Monte Carlo (MC) generator [29]. The signal MC events are normalised to 147 nb for a phase-space region with an invariant mass of the photon pairs greater than 4 GeV, in which both photons have transverse momentumpγ
T > 2 GeV and pseudorapidity|ηγ| < 2.7. The theoretical uncertainty on the cross section is mainly due to limited knowledge of the nuclear (EM) form-factors and the related initial photon fluxes.
This is studied in Ref. [18] and the relevant uncertainty is conservatively estimated to be 20%. Higher- order corrections (not included in the calculations) are also part of the theoretical uncertainty and are of the order of a few percent in the corresponding invariant mass range [30,31].
Theγγ →e+e−background contribution is modelled with the Starlight 1.1 MC generator [29].
The diphoton central exclusive production (CEP) process, gg → γγ, is modelled using SuperChic v2.03 [32], in which the proton–proton cross section has been scaled by A2R4g[33], where A= 208 and Rg ≈0.7 is a gluon shadowing correction [34]. This process has a large theoretical uncertainty,O(50%), mostly related to the modelling of the rapidity gap survival probability [35].
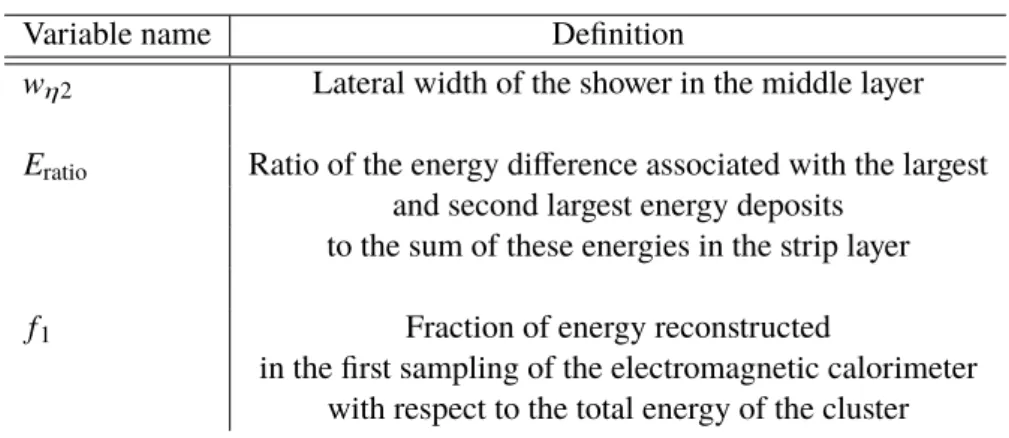
Variable name Definition
wη2 Lateral width of the shower in the middle layer Eratio Ratio of the energy difference associated with the largest
and second largest energy deposits to the sum of these energies in the strip layer
f1 Fraction of energy reconstructed
in the first sampling of the electromagnetic calorimeter with respect to the total energy of the cluster
Table 1: Definition of shower-shape variables which are used to define photon PID requirements.
The exclusive production of quark–antiquark pairs is estimated using Herwig++ 2.7.1 [36] where the EPA formalism in proton–proton (pp) collisions is implemented. The sample is then normalised to cover the differences in equivalent photon fluxes between the Pb+Pb andppcases.
All simulated events make use of a GEANT4 [37] based detector simulation [38] and are reconstructed with the standard ATLAS reconstruction software.
4 Event selection
Candidate diphoton events were recorded in the Pb+Pb run in 2015 using a dedicated trigger for events with moderate activity in the calorimeter but little additional additional activity in the entire detector.
At Level-1 the total ET registered in the calorimeter after noise subtraction was required to be above 5 GeV (collectively referred to asL1_TE5) and below 200 GeV. Then at HLT, a requirement of at most one hit in the inner ring of MBTS (MBTS veto) was imposed and the number of hits in Pixel detector was required to be at most 10.
Photons are reconstructed from electromagnetic energy clusters in the calorimeter and tracking information provided by the ID. Selection requirements are applied to remove electromagnetic clusters with a large amount of energy from problematic cells, as is a timing cut to reject out-of-time candidates. An energy calibration specifically optimised for photons is applied to the candidates to account for upstream energy loss and both lateral and longitudinal leakage. Also a dedicated correction is applied for photons in MC samples to correct for mismodelling of photon shower shapes.
To separate signal photons from background processes, various photon identification (PID) working points are defined [39], in terms of selections on quantities that describe the properties of the associated EM showers (shower shapes). In particular, the loose photon PID is designed to be maximally efficient for photons withET >20 GeV and is therefore not optimal for this analysis. Therefore a new PID, optimised for low-ETphotons is used. In addition to improving signal efficiency it is designed to maximise expected signal significance. This working point is based on three shower-shape variables which are defined in Table1. It gives a constant photon PID efficiency as a function ofηwith respect to reconstructed photon candidates. At the same time, photons coming from various background sources (e.g. from clusters induced by cosmic-ray muons) are rejected with 95% efficiency.
Events passing the above selections are then required to have a pair of photons and the diphoton invariant mass,mγγ, must be greater than 6 GeV. Only photons with ET > 3 GeV and |η| < 2.37, excluding the calorimeter transition region 1.37 < |η|< 1.52, are considered. The pseudorapidity requirement ensures that the photon candidates pass through regions of the electromagnetic calorimeter where the first layer is segmented into narrow strips, allowing a good separation between genuine prompt photons and photons coming from the decay of neutral hadrons. Due to the totalET > 5 GeV requirement at Level-1, the trigger efficiency is higher than 70% for the sum of photonETabove 6 GeV. Therefore the minimum photonET requirement is chosen to be 3 GeV, since the photon pairs are expected to have a negligible pairET. In order to suppress theγγ→e+e−background, a veto on charged-particle tracks (withpT >100 MeV,
|η| < 2.5 and at least one hit in the Pixel detector) is imposed. This requirement further reduces the fake photon background from the dielectron final state by a factor of 25, according to the MC simulations. It has almost no impact onγγ→γγ signal events, since the probability of photon conversion in the Pixel detector is relatively small and the converted photons are initially suppressed at very low-ETby the photon reconstruction algorithm. According to MC studies, the latter effect removes 10% of low-ETphotons.
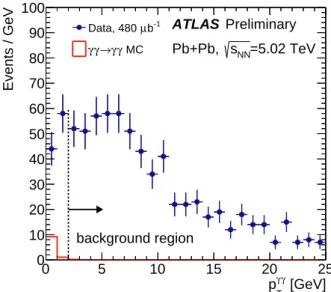
To reduce other fake photon backgrounds (involving calorimeter noise, cosmic-ray muons etc.), the transverse momentum of the diphoton system (pγγ
T ) is required to be below 2 GeV. The pγγ
T distribution is presented in Figure 3, where no identification criteria are imposed on reconstructed photons. The pγγ
T >2 GeV requirement defines the control region with a negligible contribution from the signal. That region is used to optimise photon PID requirements.
[GeV]
γ γ
pT
0 5 10 15 20 25
Events / GeV
0 10 20 30 40 50 60 70 80 90 100
Preliminary ATLAS
=5.02 TeV sNN
Pb+Pb,
b-1
µ Data, 480
γ MC γ
→ γ γ
background region
Figure 3: The transverse momentum of the photon pair for events in data (points). The signal MC expectation is also shown (histogram). A selection ofpγγ
T >2 GeV defines the control region dominated by background contributions in data that is used to optimise photon PID requirements.
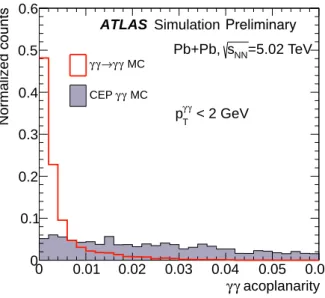
Finally, to reduce real photon background from CEPgg → γγreactions, an additional requirement on acoplanarity, Aco=(1−∆φπγγ), is used. Due to its semi-exclusive nature, the CEPgg→γγproduction is expected to be the dominant source of background with two photons in the final state. Therefore the final acoplanarity requirement is optimised to retain high signal efficiency and reduce the CEP background significantly. Figure4shows the comparison of acoplanarity shapes between signal MC and CEPgg→γγ
MC. Indeed the signal events are mostly concentrated at very low acoplanarities (Aco< 0.008), whereas gg→γγis relatively flat in the range 0<Aco<0.05.
The optimal acoplanarity requirement is chosen to maximise the value of Nsig/p
Nsig+Ngg→γγ, where Nsigis the expected number of signal events andNgg→γγis the expected background. This is obtained for Acomax=0.01 and therefore this value is taken as a final diphoton acoplanarity requirement.
γ γ acoplanarity 0 0.01 0.02 0.03 0.04 0.05 0.06
Normalized counts
0 0.1 0.2 0.3 0.4 0.5 0.6
ATLAS Preliminary
=5.02 TeV sNN
Pb+Pb,
< 2 GeV
γ γ
pT γ MC γ
→ γ γ
γ MC γ CEP
Simulation
Figure 4: The reconstructed diphoton acoplanarity distribution for signal MC and CEP gg → γγ MC. Both distributions are normalised to unity.
5 Detector calibration
5.1 Trigger efficiency
The trigger sequence used in the analysis consists of three independent requirements: L1_TE5, MBTS- veto, as well as the requirement on low activity in the ID. The efficiency of all three contributions has been studied and is discussed in the following.
The efficiency ofL1_TE5has been estimated withγγ→e+e−events passing an independent supporting trigger. This trigger was running prescaled down to a few Hz and the selection was as follows:
• Coincidence of signals in both ZDC sides and totalETin the entire calorimeter below 50 GeV,
• At least two (three) space points reconstructed in the Pixel (SCT) detector at HLT,
• Presence of at least one track (pT> 200 MeV) reconstructed at HLT.
Event candidates are required to have only two reconstructed tracks and two EM clusters, each with a minimum ET of 1.5 GeV and |η| < 2.47 (excluding the transition region). The electron identification requirements are not used in order to accept more events in this very low-ETregion, where the efficiencies to reconstruct and and identify the electron are low. Furthermore, to reduce possible backgrounds, each pair
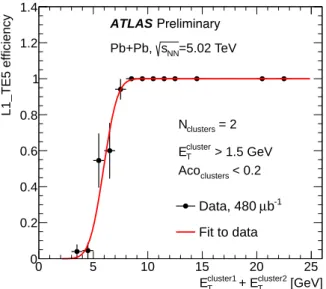
of clusters is required to have small acoplanarity (< 0.2). The extractedL1_TE5efficiency is provided as a function of (Ecluster1
T +Ecluster2
T ) and is shown in Figure5. It reaches 20% for(Ecluster1
T +Ecluster2
T ) =5 GeV and 70% for(Ecluster1
T +Ecluster2
T )=6 GeV. The efficiency plateau is reached around(Ecluster1
T +Ecluster2
T ) =
9 GeV. The efficiency is also parameterised using an error function fit that is used to reweight the MC simulation.
[GeV]
cluster2
+ ET cluster1
ET
0 5 10 15 20 25
L1_TE5 efficiency
0 0.2 0.4 0.6 0.8 1 1.2 1.4
ATLAS Preliminary
=5.02 TeV sNN
Pb+Pb,
> 1.5 GeV
cluster
ET clusters = 2 N
< 0.2
clusters
Aco
b-1
µ Data, 480 Fit to data
Figure 5: TheL1_TE5trigger efficiency extracted fromγγ→e+e−events that pass the control trigger. An error function fit is also shown.
Due to the very high hit reconstruction efficiency and the low conversion probability of signal photons in the Pixel detector, a negligible uncertainty on the requirement for minimal activity in the ID is assigned.
The MBTS veto efficiency has been studied in the context of a γγ→ µ+µ− measurement [25] and is estimated to be(98±2)%.
5.2 Photon reconstruction and identification
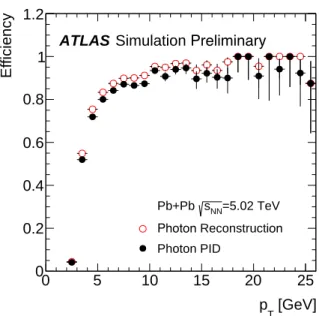
The photon reconstruction and identification efficiency is studied with the signal MC sample. The efficiency is defined as the probability of a generator-level photon with|η| < 1.37 or 1.52 < |η| < 2.37 to be matched to a reconstructed object using a matching criterion of∆R< 0.1. Figure6shows photon reconstruction and PID efficiency as a function of photonpT. The photon reconstruction is 5% efficient for photons withpT = 2 GeV but the efficiency then rises to 55–75% for pT = 3–4 GeV and reaches a plateau for photons withpT >10 GeV. The photon PID decreases the overall photon selection efficiency by about 5%.
High-pT exclusive dilepton production (γγ→l+l−) with final-state radiation (FSR) is further used for data-driven measurements of the photon PID efficiency. Events with two oppositely-charged tracks with pT > 1 GeV are selected from UPC triggered events. In addition a requirement to reconstruct a photon candidate with ET > 1 GeV and |η| < 1.37 or 1.52 < |η| < 2.37 is imposed. A photon candidate is required to be separated from each track, with the requirement∆R > 0.2. This condition allows the avoidance of leakage of the photon cluster to electron clusters from theγγ→e+e−process. 469 photon
[GeV]
pT
0 5 10 15 20 25
Efficiency
0 0.2 0.4 0.6 0.8 1 1.2
ATLASSimulation Preliminary
Pb+Pb sNN=5.02TeV Photon Reconstruction Photon PID
Figure 6: Photon reconstruction efficiency (open circles) and photon PID efficiency (closed circles), both shown as a function ofpT, extracted from the signal samples.
candidates pass the selection requirements in theγγ→l+l− event sample. Then FSR event candidates are identified using a pttγ
T < 1 GeV requirement, where pttγ
T is the transverse momentum of the three body system consisting of two oppositely-charged tracks and a photon. The FSR sample consists of 229 photons. Those photons are used to check consistency between shower-shape variables in data and MC simulation, where a good agreement is found.
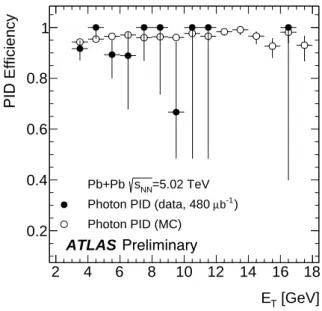
The FSR photons are also utilised to extract the photon PID efficiency, which is defined as a probability for a reconstructed photon to pass the identification criteria. Figure7shows the photon PID efficiencies as a function of reconstructed photonET. The measurement from data is compared to the one extracted from the signal MC sample. Within the statistical precision the two results agree. The precision of the efficiency is limited primarily by the size of the FSR photon sample size.
The photon reconstruction efficiency is extracted from data usingγγ→e+e− events, where one of the electrons emits a hard-bremsstrahlung photon due to interaction with the material of a detector. The tag- and-probe method is used and the analysis is performed for events with exactly one identified electron and exactly two reconstructed charged-particle tracks. The electron is considered a tag if it can be matched to one of the tracks with a ∆R < 1.0 requirement. The electron ET is required to be above 5 GeV and the track pT that is unmatched with the electron (trk2) should be below 2 GeV. The electron–trk2 transverse momentum difference is treated as a probe, since the additional hard-bremsstrahlung photon is expected to haveEγ
T ≈ (Ee
T− ptrk2
T ). The ptrk2
T < 2 GeV requirement ensures a sufficient∆Rseparation between the expected photon and the second electron, extrapolated to the first layer of the EM calorimeter.
Any additional background contribution in γγ → l+l− reactions is found to be very small in Pb+Pb collisions [25], therefore it is considered negligible in this efficiency measurement.
The data sample contains 247γγ →e+e−γ bremsstrahlung photons and is used to extract the photon re- construction efficiency, which is presented in Figure8. Good agreement between data andγγ→e+e−MC
[GeV]
ET
2 4 6 8 10 12 14 16 18
PID Efficiency
0.2 0.4 0.6 0.8 1
ATLAS Preliminary
=5.02TeV sNN
Pb+Pb
Photon PID (data, 480 ) Photon PID (MC)
b-1
µ
Figure 7: Photon PID efficiency as a function of photon ET extracted from FSR event candidates in data (full symbols) and MC sample (open symbols).
is observed and the photon reconstruction efficiency is measured with 5–10% relative uncertainty at very low-ET(<6 GeV).
The selected hard-bremsstrahlung photon candidates are also used to cross-check the photon identification efficiency. The averaged photon PID efficiency is 0.93±0.03 (stat.) for data and 0.93±0.01 (stat.) for MC.
In addition, a cross-check based on Z → µ+µ−γ events identified in pp collision data corresponding to
R Ldt = 1.6 fb−1 and collected in 2015 is performed. The aim of this cross-check is to confirm the discriminating power of the photon PID shower-shape requirements to distinguish signal and fake photons, in a similar way to Ref. [40]. The results support the choice of shower-shape variables used in this photon PID selection in an independent sample of low-ETphotons.
5.3 Photon energy scale and resolution
The photon cluster energy resolution can be extracted from data usingγγ→e+e−events. The electrons from the γγ→e+e− reaction are well balanced in their transverse momenta, with very small initial (theoretical) smearing σtheorype+
T −pe−
T
< 30 MeV, much smaller than the expected EM calorimeter energy resolution. Therefore by measuring (Ecluster1
T − Ecluster2
T ) distributions in γγ→e+e− events, one can extractσEcluster
T that follows the formula:
σEcluster T
≈
σ(Ecluster1
T −ETcluster2)
√ 2
, (1)
whereEcluster1
T andEcluster2
T are the transverse energies of the two clusters.
[GeV]
trk2
- pT e1
ET
2 4 6 8 10 12 14 16 18
Photon reconstruction efficiency
0 0.2 0.4 0.6 0.8 1 1.2 1.4
Preliminary ATLAS
=5.02 TeV sNN
Pb+Pb
γ=1
=1, N Ne
< 2 GeV
trk2
> 5 GeV, pT e1
ET
b-1
µ Data, 480
- MC
+e
→e γ γ
Figure 8: Photon reconstruction efficiency (closed markers) as a function of photonET(approximated withEe
T−ptrk2
T ) extracted fromγγ →e+e−events with a hard-bremsstrahlung photon. Data (circles) are compared withγγ→e+e− MC (squares).
At low electron-ET(below 10 GeV) theσEcluster T
/Ecluster
T is observed to be≈8% in data, which agrees with the resolution from simulation in terms of (|σdata
Ecluster T
−σMC
Ecluster T
|)/σdata
Ecluster T
, to within 15%. Therefore no correction is applied to the MC simulation.
Similarly, the EM energy scale can be studied using the (Ecluster1
T +Ecluster2
T ) distribution. It is observed that the simulation provides a good description of electron clusterET, within the relative uncertainty of 5% that is assigned to the EM cluster energy scale modelling.
6 Background estimation
Contributions from different background sources are taken into account: CEPgg → γγ, γγ→e+e−, γγ→qq¯, exclusive two-meson production and other backgrounds that could fake the diphoton event signatures (cosmic-ray muons, EM calorimeter noise).
Electron final states
Due to its relatively high rate, the exclusive production of electron pairs (γγ →e+e−) could be a source of fake diphoton events. The electron→photon misidentification can occur when the electron track is not reconstructed or the electron emits a hard bremsstrahlung photon. A contribution from fake dielectron backgrounds is estimated usingγγ →e+e−MC simulation to be 1.3 events.
In order to cross-check the simulation, two control regions are defined that are expected to be dominated byγγ→e+e−backgrounds. The first control region is defined for events with exactly one reconstructed charged-particle track (with at least one hit in the pixel detector) and two identified photons that pass the
same preselection critera as for the signal definition. This mostly corresponds to a scenario when one photon is induced by the presence of one of the electrons (for which a track is not reconstructed) and the other photon is emitted in hard bremsstrahlung (the electron track survives). The second control region is defined similarly to the first one except exactly two tracks are required (Ntrk = 2). This enhances the contribution from events where both electron tracks fail to be matched to their relevant EM clusters.
Figure9shows the diphoton acoplanarity distribution for data andγγ→e+e−MC for both control regions.
Good agreement is observed between data and MC, however the precision is limited by the number of events in data. A conservative uncertainty on theγγ→e+e−background estimation is therefore assigned to be 25%, which reflects the statistical uncertainty of data in theNtrk=1 control region.
acoplanarity γ
0 0.1 0.2 0.3 0.4γ 0.5 0.6
Events / 0.02
0 5 10 15 20 25 30
Preliminary ATLAS
=5.02 TeV sNN
Pb+Pb
= 1 control region Ntrk
b-1
µ Data, 480
- MC
+e
→e γ γ
γ MC γ
→ γ γ
acoplanarity γ
0 0.1 0.2 0.3 0.4γ 0.5 0.6
Events / 0.02
0 5 10 15 20 25 30
Preliminary ATLAS
=5.02 TeV sNN
Pb+Pb
= 2 control region Ntrk
b-1
µ Data, 480
- MC
+e
→e γ γ
γ MC γ
→ γ γ
Figure 9: Diphoton acoplanarity distributions for the Ntrk = 1 (left) andNtrk = 2 (right) control regions. Data (points) are compared to MC expectations (histograms) that includeγγ→γγandγγ→e+e−processes. No other sources of background are considered.
Quark and gluon final states
Low-pTdijet events can produce multipleπ0mesons that could potentially mimic diphoton events. The contribution from exclusive dijet production is estimated using theγγ→qq¯ process. Since low-energy jets usually produceO(10) charged-particle tracks withpT > 100 MeV, none of the 105simulated events (mqq¯ >4 GeV) pass the Ntrk =0 requirement.
Based on studies performed with a control trigger in HI data the hadronic background from other minimum bias processes is estimated to be 0.3±0.3 events.
Central exclusive production of meson pairs
Exclusive two-meson production can be a potential source of background for LbyL events, mainly due to their similar back-to-back topology. Mesons can fake photons either by their intermediate decay to photons (neutral mesons: π0,η, η0) or by misreconstructed charged-particle tracks for charged mesons
(π+π−states). Exclusive meson pairs are usually produced via resonant production at low invariant masses (e.g. ρ0(770) → π+π−) and the cross sections are suppressed for invariant masses above 5 GeV [18], where only continuum processes are involved. Theσ(gg→π0π0)/σ(gg→γγ)ratio is calculated to be below 1% forpπ
T > 3 GeV and|ηπ|< 2.5 [41]. The CEP ratio ofσ(gg→η(0)η(0) →4γ)toσ(gg→γγ) is estimated in Ref. [42] to be below 10% for mesons with pT > 2.5 GeV. Since the cross sections for neutral exclusive two-meson production are estimated to be very small as compared to diphoton CEP, these processes are considered to have a negligible contribution to the signal region.
Other fake photon backgrounds
Other fake diphoton events can occur due to noise in the calorimeter or cosmic-ray muons that do not cross the Pixel detector (no reconstructed charged-particle tracks). Such fake photons are characterised by differences in the shower shape variables [40]. The contribution from such events in the signal region, is estimated using the so-called ABCD method. Four exclusive regions (A, B, C, D) are defined. The regions A and C are required to have two photons that meet the photon identification criteria, while regions B and D are required to have two photons that fail to satisfy the longitudinal shower shape requirement, f1. In regions A and B (C and D)pγγ
T < 2 GeV (pγγ
T > 2 GeV) is also required.
The other fake-photon background in signal region A can be estimated fromNA = NB·NC/ND, where NA, NB, NC, andNDare the numbers of events in regions A, B, C and D respectively. The assumption that the ratiosNA/NBandNC/NDare the same is confirmed using other shower shape variables used in the photon PID definition. It is found thatNA = 1.3±0.5, where the uncertainty is purely statistical in origin.
To estimate the acoplanarity-dependence of the fake-photon background after applying thepγγ
T < 2 GeV requirement, different template acoplanarity distributions are studied. The default template distribution is built from diphoton events in data (no photon PID requirement is imposed) that satisfy a 2 GeV
< pγγ
T < 3 GeV condition. To check the possible acoplanarity-shape dependence on pγγ
T , the regions 3 GeV< pγγ
T < 4 GeV and 4 GeV< pγγ
T < 5 GeV are also studied and no strong shape dependence is observed.
Therefore, the total background due to other fake photons is estimated to be 0.1±0.1 and is considered negligible.
As a further cross-check, additional activity in the MS is studied. It is observed that out of 18 events satisfying thepγγ
T > 2 GeV requirement, 13 have at least one additional reconstructed muon. In the region pγγ
T < 2 GeV, no events with muon activity are found, which is compatible with the above-mentioned estimation.
Central exclusive diphoton production
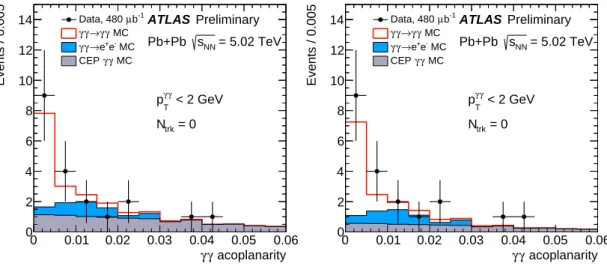
The requirement on diphoton acoplanarity (Aco< 0.01) reduces the possible CEPgg→γγbackground.
However, the MC expectation of the exclusivegg →γγ background has a large theoretical uncertainty, O(50%), hence additional normalisation of this process is performed in the region Aco> b, wherebis a value that can be chosen to be greater than 0.01. Three values ofb=0.01, 0.02, 0.03 are used, where the mean valueb=0.02 is chosen to derive the nominal background prediction and the valuesb=0.01 and b=0.03 to define the systematic uncertainty.
The normalisation is performed using the condition:
fgg→γγnorm,b = Ndata(Aco>b)−Nsig(Aco>b)−Nγγ→ee(Aco> b)
Ngg→γγ(Aco> b) , (2)
for each value of b, where Ndata is the number of observed events, Nsig is the expected number of signal events and Nγγ→ee is the expected background. This procedure is demonstrated in Figure 10.
The normalisation factors are found to be fgg→γγnorm,b=0.01 = 0.3±0.2 (stat.) for b = 0.01, fgg→γγnorm,b=0.02 = 0.5±0.3 (stat.) for b= 0.02 and fgg→γγnorm,b=0.03 = 0.6±0.5 (stat.) for b = 0.03. The background due to CEP is thus estimated to be 0.9±0.5 counts.
acoplanarity γ
γ
0 0.01 0.02 0.03 0.04 0.05 0.06
Events / 0.005
0 2 4 6 8 10 12
14 ATLASPreliminary = 5.02 TeV sNN
Pb+Pb
< 2 GeV
γ γ
pT trk = 0 N b-1
µ Data, 480
γ MC γ
→ γ γ
- MC
+e
→e γ γ
γ MC γ CEP
acoplanarity γ
γ
0 0.01 0.02 0.03 0.04 0.05 0.06
Events / 0.005
0 2 4 6 8 10 12
14 ATLASPreliminary = 5.02 TeV sNN
Pb+Pb
< 2 GeV
γ γ
pT trk = 0 N b-1
µ Data, 480
γ MC γ
→ γ γ
- MC
+e
→e γ γ
γ MC γ CEP
Figure 10: The diphoton acoplanarity distribution for events in the signal region (pγγ
T <2 GeV) before (left) and after (right) applying the CEPgg→ γγbackground normalisation. The normalisation procedure is performed in the Aco>0.01 region.
7 Results
7.1 Kinematic distributions
Photon kinematic distributions for events satisfying all selection criteria are shown in Figure11. In total, 13 events were observed in data where 7.3 signal events and 2.6 background events are expected. In general, a good agreement between data and MC is observed. The result of each step of the selection applied to the data, signal and background samples is shown in Table2.
7.2 Cross section measurement
The cross section for theγγ→γγprocess is measured in a fiducial phase space, defined by the following requirements on the diphoton final state, reflecting the selection at reconstruction level: Both photons have to be within|η| < 2.4 with a transverse energy ofET >3 GeV. The invariant mass of the di-photon system has to bemγγ > 6 GeV with a transverse momentum ofpγγ
T < 2 GeV. In addition, the photons
[GeV]
γ
mγ
0 5 10 15 20 25 30
Events / 3 GeV
0 2 4 6 8 10 12
Preliminary ATLAS
=5.02 TeV sNN
Pb+Pb
Signal selection Aco < 0.01
b-1
µ Data, 480
γ MC γ
→ γ γ
- MC
+e
→e γ γ
γ MC γ CEP
γ|
|yγ
0 0.5 1 1.5 2 2.5 3
Events / 0.5
0 2 4 6 8 10 12
14 ATLASPreliminary
=5.02 TeV sNN
Pb+Pb
Signal selection Aco < 0.01
b-1
µ Data, 480
γ MC γ
→ γ γ
- MC
+e
→e γ γ
γ MC γ CEP
[GeV]
γ γ
pT
0 0.5 1 1.5 2 2.5 3 3.5 4 4.5 5
Events / GeV
0 2 4 6 8 10 12 14 16 18 20
Preliminary ATLAS
=5.02 TeV sNN
Pb+Pb
Signal selection Aco < 0.01
b-1
µ Data, 480
γ MC γ
→ γ γ
- MC
+e
→e γ γ
γ MC γ CEP
γ| ηγ
∆
|
0 0.5 1 1.5 2 2.5 3 3.5
Events / 0.5
0 2 4 6 8 10 12
Preliminary ATLAS
=5.02 TeV sNN
Pb+Pb
Signal selection Aco < 0.01
b-1
µ Data, 480
γ MC γ
→ γ γ
- MC
+e
→e γ γ
γ MC γ CEP
[GeV]
γ
ET
0 2 4 6 8 10 12 14 16 18 20
Photons / 3 GeV
0 5 10 15 20 25 30 35 40
Preliminary ATLAS
=5.02 TeV sNN
Pb+Pb
Signal selection Aco < 0.01
b-1
µ Data, 480
γ MC γ
→ γ γ
- MC
+e
→e γ γ
γ MC γ CEP
ηγ
−3 −2 −1 0 1 2 3
Photons
0 5 10 15 20 25 30
Preliminary ATLAS
=5.02 TeV sNN
Pb+Pb
Signal selection Aco < 0.01
b-1
µ Data, 480
γ MC γ
→ γ γ
- MC
+e
→e γ γ
γ MC γ CEP
Figure 11: Kinematic distributions forγγ →γγ event candidates: diphoton invariant mass (top-left), diphoton rapidity (top-right), diphoton transverse momentum (mid-left), diphoton pseudorapidity difference (mid-right) single-photon transverse energy (bottom-left) and single-photon transverse energy (bottom-left). Data (points) are compared to MC expectations (histograms).
Selection Data Signal γγ→e+e− CEPgg→γγ Hadronic fakes Other fakes Total expected
Preselection 105 9.1 74 4.7 6 19 113
Ntrk =0 39 8.7 4.0 4.5 6 19 42
pγγ
T < 2 GeV 21 8.5 3.5 4.4 3 1.3 21
Aco<0.01 13 7.3 1.3 0.9 0.3 0.1 9.9
Uncertainty 1.5 0.3 0.5 0.3 0.1
Table 2: The effect of sequential selection requirements on the number of events selected in data, compared to the number of signal and background expected from the simulation. In addition, the uncertainties on the expected number of events are given.
must be back-to-back, i.e. fulfil an acoplanarity requirement of 1− ∆φπγγ < 0.01. Experimentally, the fiducial cross section is given by
σfid= Ndata−Nbkg C·R
Ldt , (3)
whereNdatais number of selected events in data andNbkgis the number of background events surviving the signal selection. The factorCis a correction factor reflecting the various detector level inefficiencies and resolution effects and is only affected to a small extent by theoretical uncertainties. It is evaluated using the full MC simulation of the signal MC and defined as the number of selected events (Nselected
reco ) at reconstruction level, divided by the number of events in the fiducial phase space at generator level (Nselected
gen ).
The value ofCis found to be:C =0.31±0.07. The uncertainty onCis estimated by varying the Data/MC correction factors within their uncertainties, in particular for the photon reconstruction/PID efficiency, photon energy scale and resolution and trigger efficiency.
The precision of theL1_TE5trigger efficiency estimation is limited by the number of events recorded by the supporting trigger. As a systematic check, the parameters of the fit (used to construct the MC weights) are varied according to its statistical errors which results in altered signal yields. The impact on the reconstructedγγ →γγevent yield (correction factor) is 4%. As a further check, the efficiency is extracted using identified electron pairs. The difference with respect to the nominal method (EM clusters) onCis 3%, however it is fully correlated with the statistical variation. The uncertainty on the MBTS veto efficiency has been estimated in Ref. [25] to be 2%.
In total, a 5% uncertainty related to the knowledge of the trigger efficiency is assigned.
The data-driven estimate of the photon reconstruction efficiency is limited by the number of events passing the hard-bremsstrahlung photon candidate selection. This gives a 6% uncertainty on the knowledge of the single-photon reconstruction efficiency when averaging over Eγ
T. The overall impact on the signal correction factor is taken to be twice this value, i.e. 12%.
The precision for photon identification efficiency estimation is also limited by the number of events used in the data-driven method. The uncertainty on the photon PID efficiency is 8% and the impact on the C-factor is 16%.
Source of uncertainty Detector correction (C) 0.31
Trigger 5%
Photon reco efficiency 12%
Photon PID efficiency 16%
Photon energy scale 7%
Photon energy resolution 11%
Total 24%
Table 3: The detector correction factor,C, and its uncertainties.
The EM cluster energy scale is found to be in a good agreement between data and MC and a conservative 5% uncertainty on the photon energy scale is assigned. This has an impact of 7% on the signal correction factor.
The uncertainty on theC-factor related to the knowledge of the photon energy resolution is estimated using results from Section5. The differences between the energy resolution observed inγγ→γγ MC and the data-driven method are treated as a systematic effect. Their impact on the signal event yield is 11%.
An overview of the various uncertainties onCis given in Table3.
The integrated luminosity of the data-sample is
R Ldt = 480µb−1 with an uncertainty of 6%. The number of selected signal candidate events isNdata= 13 and the number of expected background events Nbkg = 2.6±0.7, as discussed in the previous section. The measured fiducial cross section is σfid = 70±20 (stat.)±17 (syst.) nb, which is in agreement with the predicted value of 49±10 nb [28] within statistical uncertainties.
7.3 Significance
The signal extraction is performed in the lowest two bins of diphoton acoplanarity (Figure10), as this is considered to be the distribution which has the largest separation between signal and background.
A test statistic,tµ, based on the asymptotic approximation of the profile likelihood ratio [43] is used to evaluate the signal strength parameter, µ(defined as the scaling of the signal histogram which produces the best agreement with data). The scan of the profile likelihood−2∆lnLis plotted in Fig.12as a function ofµfor both the observed data and the SM expectation (from MC).
This procedure results in an estimate of µ = 1.4±0.6, compatible with the SM expectation of 1.0.
The p-value for the null (background-only) hypothesis is 4.8×10⁻⁶, which corresponds to µ = 0 in Fig.12and a significance of 4.4σ. The expected p-value and significance (obtained before the fit of the signal-plus-background hypothesis to the data) are 7.5×10⁻⁵and 3.8σ, respectively.
γ γ
→ γ
µγ
0 0.5 1 1.5 2 2.5 3
ln L∆- 2
0 5 10 15 20 25
Observed SM expected
Preliminary ATLAS
=5.02 TeV sNN
Pb+Pb b-1
µ L dt = 480
∫
σ 1
σ 2
σ 3
σ 4
σ 5
Figure 12: Scan of the profile likelihood as a function of the signal strength,µ, relative to the expectation for the processγγ → γγ. The observed significance for the background only hypothesis (µ = 0) is 4.4σ, whilst the expected significance is 3.8σ.
8 Conclusion
This note presents evidence for light-by-light scattering signatures in quasi-real photon interactions from ultra-peripheral Pb+Pb collisions at √
sNN = 5.02 TeV by the ATLAS experiment. The data set was recorded in 2015 and corresponds to 480 µb−1. After final selection criteria are applied to the data, 13 pass, while 7.3 signal events are expected from predictions. The dominant background processes, i.e. CEP gg→γγ,γγ→e+e−as well as other fake-photon backgrounds, are estimated using data-driven methods.
After accounting for all of these sources, 2.6 background events are expected, with an uncertainty of 0.7.
The significance is determined to be 4.4σ. After background subtraction and analysis corrections, the cross section of theγγ→γγprocess for photon transverse momentum, ET > 3 GeV, photon pseudorapidity,
|η| <2.4, invariant mass of the diphoton system,mγγ >6 GeV, diphoton transverse momentum,pγγ
T <2 GeV and diphoton acoplanarity below 0.01 is measured to be 70±20 (stat.)±17 (syst.) nb, which is compatible with the SM prediction of 49±10 nb.
References
[1] W. Heisenberg and H. Euler,Folgerungen aus der Diracschen Theorie des Positrons, Zeitschrift für Physik98(1936) 714.
[2] M. Greiner, M. Vidovic and G. Soff,Electromagnetic production of Higgs bosons, SUSY particles, glueballs and mesons in ultrarelativistic heavy ion collisions,
Phys. Rev.C47(1993) 2288.
[3] J. Ohnemus, T. F. Walsh and P. M. Zerwas,
Gamma gamma production of nonstrongly interacting SUSY particles at hadron colliders, Phys. Lett.B328(1994) 369, arXiv:hep-ph/9402302 [hep-ph].
[4] I. F. Ginzburg and A. Schiller,
Search for a heavy magnetic monopole at the Tevatron and CERN LHC, Phys. Rev.D57(1998) 6599, arXiv:hep-ph/9802310 [hep-ph]. [5] H. Davoudiasl,
Gamma gamma —> gamma gamma as a test of weak scale quantum gravity at the NLC, Phys. Rev.D60(1999) 084022, arXiv:hep-ph/9904425 [hep-ph].
[6] K.-m. Cheung,Diphoton signals for low scale gravity in extra dimensions, Phys. Rev.D61(2000) 015005, arXiv:hep-ph/9904266 [hep-ph]. [7] S. C. Ahern, J. W. Norbury and W. J. Poyser,
Graviton production in relativistic heavy ion collisions,Phys. Rev.D62(2000) 116001, arXiv:gr-qc/0009059 [gr-qc].
[8] O. Cakir and K. O. Ozansoy,Unparticle Searches Through Gamma Gamma Scattering, Eur. Phys. J.C56(2008) 279, arXiv:0712.3814 [hep-ph].
[9] S. Fichet et al.,
Light-by-light scattering with intact protons at the LHC: from Standard Model to New Physics, JHEP02(2015) 165, arXiv:1411.6629 [hep-ph].
[10] S. Knapen et al.,Searching for axion-like particles with ultra-peripheral heavy-ion collisions, (2016), arXiv:1607.06083 [hep-ph].
[11] R. S. Van Dyck, P. B. Schwinberg and H. G. Dehmelt,
New high-precision comparison of electron and positron g factors, Phys. Rev. Lett.59(1 1987) 26.
[12] Muon g-2 Collaboration, H. N. Brown et al.,
Precise measurement of the positive muon anomalous magnetic moment, Phys. Rev. Lett.86(2001) 2227, arXiv:hep-ex/0102017 [hep-ex].
[13] R. R. Wilson,Scattering of 1.33 Mev Gamma-Rays by an Electric Field,Phys. Rev.90(1953) 720.
[14] G. Jarlskog et al.,
Measurement of Delbrück Scattering and Observation of Photon Splitting at High Energies, Phys. Rev. D8(11 1973) 3813.
[15] M. Schumacher et al.,Delbruck Scattering of 2.75-MeV Photons by Lead, Phys. Lett.B59(1975) 134.
[16] S. Z. Akhmadaliev et al.,Delbrück scattering at energies of 140–450 MeV, Phys. Rev. C58(1998) 2844.
[17] S. Z. Akhmadaliev et al.,
Experimental investigation of high-energy photon splitting in atomic fields, Phys. Rev. Lett.89(2002) 061802, arXiv:hep-ex/0111084 [hep-ex]. [18] D. d’Enterria and G. G. Silveira,
Observing light-by-light scattering at the Large Hadron Collider,
Phys. Rev. Lett.111(2013) 080405, [Erratum: Phys. Rev. Lett.116,no.12,129901(2016)], arXiv:1305.7142 [hep-ph].
[19] E. Fermi,On the theory of collisions between atoms and electrically charged particles, Nuovo Cim.2(1925) 143, arXiv:hep-th/0205086 [hep-th].
[20] E. J. Williams,Nature of the High Energy Particles of Penetrating Radiation and Status of Ionization and Radiation Formulae,Phys. Rev.45(10 1934) 729.
[21] ALICE Collaboration, B. Abelev et al.,Measurement of the Cross Section for Electromagnetic Dissociation with Neutron Emission in Pb-Pb Collisions at√
sN N = 2.76 TeV, Phys. Rev. Lett.109(2012) 252302, arXiv:1203.2436 [nucl-ex].
[22] ATLAS Collaboration,The ATLAS experiment at the CERN Large Hadron Collider, JINST3(2008) S08003.
[23] ATLAS Collaboration,ATLAS Insertable B-Layer Technical Design Report, (2010), url:https://cds.cern.ch/record/1291633.
[24] G. Aad et al.,Performance of the ATLAS Trigger System in 2010,Eur. Phys. J.C72(2012) 1849, arXiv:1110.1530 [hep-ex].
[25] ATLAS Collaboration,Measurement of high-mass dimuon pairs from ultraperipheral lead-lead collisions at√
sNN=5.02TeV with the ATLAS detector at the LHC, (2016), url:https://cds.cern.ch/record/2157689.
[26] ATLAS Collaboration,Improved luminosity determination in pp collisions at sqrt(s) = 7 TeV using the ATLAS detector at the LHC,Eur. Phys. J.C73(2013) 2518,
arXiv:1302.4393 [hep-ex]. [27] ATLAS Collaboration,
Luminosity determination in pp collisions at√
s= 8 TeV using the ATLAS detector at the LHC, (2016), arXiv:1608.03953 [hep-ex].
[28] M. Kłusek-Gawenda, P. Lebiedowicz and A. Szczurek,Light-by-light scattering in ultraperipheral Pb-Pb collisions at energies available at the CERN Large Hadron Collider,
Phys. Rev.C93(2016) 044907, arXiv:1601.07001 [nucl-th]. [29] S. R. Klein and J. Nystrand,
Photoproduction of quarkonium in proton proton and nucleus nucleus collisions, Phys. Rev. Lett.92(2004) 142003, arXiv:hep-ph/0311164 [hep-ph].
[30] Z. Bern et al.,QCD and QED corrections to light by light scattering,JHEP11(2001) 031, arXiv:hep-ph/0109079 [hep-ph].
[31] M. Kłusek-Gawenda, W. Schaefer and A. Szczurek,
Two-gluon exchange contribution to elasticγγ→γγscattering and production of two-photons in ultraperipheral ultrarelativistic heavy ion and proton-proton collisions,(2016),
arXiv:1606.01058 [hep-ph].
[32] L. A. Harland-Lang, V. A. Khoze and M. G. Ryskin,
Exclusive physics at the LHC with SuperChic 2,Eur. Phys. J.C76(2016) 9, arXiv:1508.02718 [hep-ph].
[33] A. Capella et al.,Unusual Shadowing Effects in Particle Production Off Nuclei, Phys. Lett.B107(1981) 106, [Erratum: Phys. Lett.B109,510(1982)].
[34] K. J. Eskola, H. Paukkunen and C. A. Salgado,
EPS09: A New Generation of NLO and LO Nuclear Parton Distribution Functions, JHEP04(2009) 065, arXiv:0902.4154 [hep-ph].