A TLAS-CONF-2016-050 08 August 2016
ATLAS NOTE
ATLAS-CONF-2016-050
August 4, 2016
Search for top squarks in final states with one isolated lepton, jets, and missing transverse momentum in √
s = 13 TeV p p collisions with the ATLAS detector
The ATLAS Collaboration
Abstract
The results of a search for the stop, the supersymmetric partner of the top quark, in final states with one isolated electron or muon, jets, and missing transverse momentum are reported. The search uses the LHC pp collision data collected in 2015 and 2016 at a center-of-mass energy of
√ s = 13 TeV recorded by the ATLAS detector corresponding to an integrated luminosity of 13 . 2 fb
−1. The stop decay scenarios considered are those to a top quark and the lightest neutralino as well as to a bottom quark and the lightest chargino, followed by the chargino decays to the lightest neutralino and a W boson. A range of scenarios with different mass splittings between the stop, the lightest chargino and the lightest neutralino are considered.
The analysis also targets the production of dark matter in association with a pair of top quarks using the same final state. The largest deviation from the Standard Model prediction is found in one of the seven signal selections, where 35 events are observed with 17 ± 2 background events expected, corresponding to a local significance of 3.3 standard deviations. A stop with a mass of 830 GeV decaying directly to a top quark and a massless neutralino is excluded at 95% confidence level. Stringent exclusion limits are also derived for all other considered stop decay scenarios, and upper limits are set on the visible cross-section for processes beyond the Standard Model. For the dark matter search, limits are obtained for the common coupling value of g = 3 . 5 in a plane of dark matter particle mass and a scalar or pseudo-scalar mediator mass. The maximal coupling of g = 3 . 5 is excluded at 95% confidence level for a scalar (pseudo-scalar) mediator mass up to 320 (350) GeV assuming a 1 GeV dark matter particle mass.
© 2016 CERN for the benefit of the ATLAS Collaboration.
Reproduction of this article or parts of it is allowed as specified in the CC-BY-4.0 license.
1 Introduction
Supersymmetry (SUSY) [1–6] is a well motivated extension of the Standard Model (SM) that introduces supersymmetric partner (superpartner) particles to each of the SM particles and that provides a natural solution [7, 8] to the hierarchy problem [9–12]. The top squark or stop (˜ t ), which is the superpartner of the top quark, is expected to be relatively light due to its large contribution to the Higgs boson mass radiative corrections [13, 14]. A common theoretical strategy for avoiding strong constraints from the non-observation of proton decay [15] is to introduce a multiplicative quantum number called R -parity. If R -parity is conserved [16], SUSY particles are produced in pairs and the lightest supersymmetric particle (LSP) is stable. This analysis follows the typical assumption that the lightest neutralino1 ( ˜ χ
01
) is the LSP.
Since the ˜ χ
01
interacts only weakly, it can serve as a candidate for dark matter [17, 18].
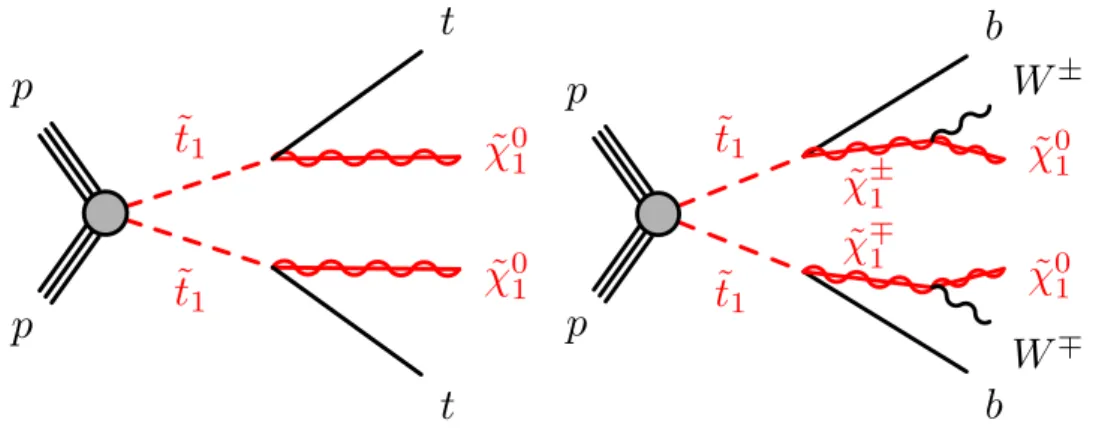
The analysis described in this note closely follows and extends the previous search for stop production using 2015 data [19]. This note presents a search targeting the direct production of the lighter stop2 (˜ t
1), illustrated by the diagrams in Figure 1. The stop can decay into a variety of final states, depending amongst other things on the SUSY particle mass spectrum, in particular on the masses of the stop, chargino and lightest neutralino. When the decay into b χ ˜
±1
is kinematically allowed, the ˜ t
1decay branching ratio ( BR ) is determined by the stop mixing matrix and the field content of the neutralino/chargino sector.
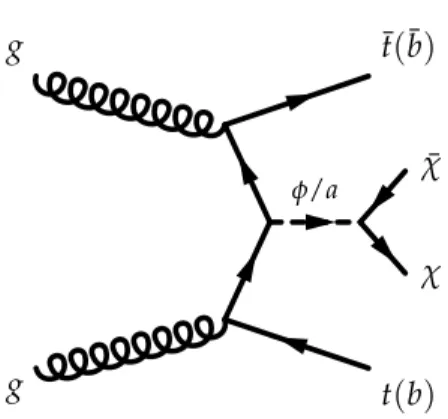
In addition to the direct stop search, a dark matter (DM) scenario [20–22] is also studied. Figure 2 illustrates a Feynman diagram where the DM particles (represented by χ ) are pair-produced via a spin-0 mediator (either scalar or pseudo-scalar). The mediator couples to the SM particles by mixing with the Higgs sector.
˜ t 1
˜ t 1 p
p
˜ χ 0 1 t
˜ χ 0 1
t
t ˜ 1
t ˜ 1
˜ χ ± 1
˜ χ ∓ 1 p
p
b
˜ χ 0 1 W ±
b
˜ χ 0 1 W ∓
Figure 1: Diagrams illustrating the direct pair production of ˜ t
1particles and their decays, which are referred to as t ˜
1→ t + χ ˜
01
(left) and ˜ t
1→ b + χ ˜
±1
(right). Furthermore, a mixed decay scenario where each ˜ t
1decays via either t ˜
1→ t + χ ˜
01
and ˜ t
1→ b + χ ˜
±1
for various BR is considered (not shown). For simplicity, no distinction is made between particles and antiparticles.
The analysis presented here targets final states with one lepton, where the W boson from one of the top quarks decays to an electron or muon (either directly or via a τ lepton) and the W boson from the other
1
The charginos ˜ χ
±1,2and neutralinos ˜ χ
01,2,3,4
are the mass eigenstates formed from the linear superposition of the charged and neutral superpartners of the Higgs and electroweak gauge bosons (higgsinos, winos and binos).
2
The superpartners of the left- and right-handed top quarks, ˜ t
Land ˜ t
R, mix to form the two mass eigenstates ˜ t
1and ˜ t
2, where
t ˜
1is the lighter one.
dark matter benchmark models for early lhc run-2 searches:
report of the atlas/cms dark matter forum 39
f/a
g g
t ( b ) c c ¯ t ¯ ( b ¯ )
Figure2.22: Representative Feynman diagram showing the pair production of Dark Matter particles in association withtt¯(orb¯b).
the pMSSM) privilege the coupling of spin-0 mediators to down generation quarks. This assumption motivates the study of final states involving b-quarks as a complementary search to the t t+DM ¯ models, to directly probe the b-quark coupling. An example of such a model can be found in Ref. [BFG15] and can be obtained by re- placing top quarks with b quarks in Fig. 2.22. Note that, because of the kinematics features of b quark production relative to heavy t quark production, a b b+DM final state may only yield one experi- ¯ mentally visible b quark, leading to a mono-b signature in a model that conserves b flavor.
Dedicated implementations of these models for the work of this Forum are available at LO+PS accuracy, even though the state of the art is set to improve on a timescale beyond that for early Run-2 DM searches as detailed in Section 4.1.5. The studies in this Section have been produced using a leading order UFO model within MadG raph5_aMC@NLO 2.2.2 [Alw+14; All+14; Deg+12]
using pythia 8 for the parton shower.
2.2.3.1 Parameter scan
The parameter scan for the dedicated t t+/ ¯ E
Tsearches has been stud- ied in detail to target the production mechanism of DM associated with heavy flavor quarks, and shares many details of the scan for the scalar model with a gluon radiation. The benchmark points scanning the model parameters have been selected to ensure that the kinematic features of the parameter space are sufficiently rep- resented. Detailed studies were performed to identify points in the m
c, m
f,a, g
c, g
q(and G
f,a) parameter space that differ significantly from each other in terms of expected detector acceptance. Because missing transverse momentum is the key observable for searches, the mediator p
Tspectra is taken to represent the main kinemat- ics of a model. Another consideration in determining the set of benchmarks is to focus on the parameter space where we expect the searches to be sensitive during the 2015 LHC run. Based on a projected integrated luminosity of 30 fb
1expected for 2015, we disregard model points with a cross section times branching ratio smaller than 0.1 fb, corresponding to a minimum of one expected event assuming a 0.1% efficiency times acceptance.
The kinematics is most dependent on the masses m
cand m
f,a. Figure 2.23 and 2.24 show typical dependencies for scalar and
Figure 2: A representative Feynman diagram for s-channel spin-0 mediator production of dark matter particles.
top quark decays hadronically. The dominant SM background processes are: the production of t¯ t , the associated production of a top quark and a W boson (single top W t ), t¯ t + Z (→ ν ν) ¯ , and the associated production of W bosons and jets ( W +jets). The search uses ATLAS data collected in proton-proton ( pp ) collisions in 2015 and 2016 corresponding to an integrated luminosity of 13 . 2 fb
−1at a center-of-mass energy of
√ s = 13 TeV. Previous searches for stop production have been carried out by ATLAS [19, 23–25] and CMS [26–31]. Searches for DM in association with heavy quarks have also been performed previously. The previous results were based on Effective Field Theory (EFT) models [32, 33], in contrast to the results reported here which are based on a Simplified model [21, 22].
This document is organized as follows. The ATLAS detector, dataset, and trigger are described in Section 2, and the corresponding set of simulated samples are detailed in Section 3. Section 4 presents the reconstruction and selection of physics objects and the definition of the discriminating variables.
These variables are used in Section 5 to construct the signal event selections. The background estimation procedure and systematic uncertainties are described in Sections 6 and 7, respectively, and the results of this analysis are presented in Section 8. Section 9 contains concluding remarks.
2 ATLAS Detector and Dataset
The ATLAS detector [34] is a multipurpose particle physics detector with nearly 4 π coverage in solid angle around the collision point.3 It consists of an inner tracking detector (ID), surrounded by a superconducting solenoid providing a 2 T axial magnetic field, a system of calorimeters, and a muon spectrometer (MS) incorporating three large superconducting toroid magnets. The ID provides charged-particle tracking in the range |η | < 2 . 5. During the LHC shutdown between Run 1 (2010–2012) and Run 2 (2015–), a new innermost layer of silicon pixels was added, which improves the track impact parameter resolution, vertex position resolution and b -tagging performance [35]. High-granularity electromagnetic and hadronic calorimeters cover the region |η| < 4 . 9. The central hadronic calorimeter is a sampling calorimeter with
3
ATLAS uses a right-handed coordinate system with its origin at the nominal interaction point (IP) in the center of the detector and the z -axis along the beam pipe. The x -axis points from the IP to the center of the LHC ring, and the y -axis points upwards. Cylindrical coordinates (r, φ) are used in the transverse plane, φ being the azimuthal angle around the z -axis.
The pseudorapidity is defined in terms of the polar angle θ as η = − ln tan (θ/ 2 ) . Angular distance is measured in units of
∆R ≡ q
(∆ η)
2+ (∆ φ)
2.
3
scintillator tiles as the active medium and steel absorbers. All the electromagnetic calorimeters, as well as the endcap and forward hadronic calorimeters, are sampling calorimeters with liquid argon as the active medium and lead, copper, or tungsten absorber. The MS consists of three layers of high-precision tracking chambers with coverage up to |η | = 2 . 7 and dedicated chambers for triggering in the region |η| < 2 . 4.
Events are selected by a two-level trigger system: the first level is a hardware-based system and the second is a software-based system.
The LHC collision data used in this analysis was collected during 2015 and 2016 and has a mean number of simultaneous pp interactions per bunch crossing, or “pileup”, of approximately 21.4 across the years.
Following requirements based on beam and detector conditions and data quality, the dataset corresponds to an integrated luminosity of 13 . 2 fb
−1with an associated uncertainty of 2.1% and 3.7% in the 2015 and 2016 datasets respectively. The uncertainty is derived following the same methodology as that detailed in Ref. [36, 37]. Events used for this search were recorded using a trigger logic that accepts events with an E
missT
threshold at trigger level of 80 GeV for the 2015 dataset and 100 GeV for the 2016 dataset. The trigger is more than 95% efficient for events passing an offline-reconstructed E
missT
> 200 GeV requirement. An additional data sample used to estimate one of the background processes was recorded with a trigger requiring a photon with transverse momentum p
T> 140 GeV, which is > 99% efficient for the offline photon selection described in Section 4.
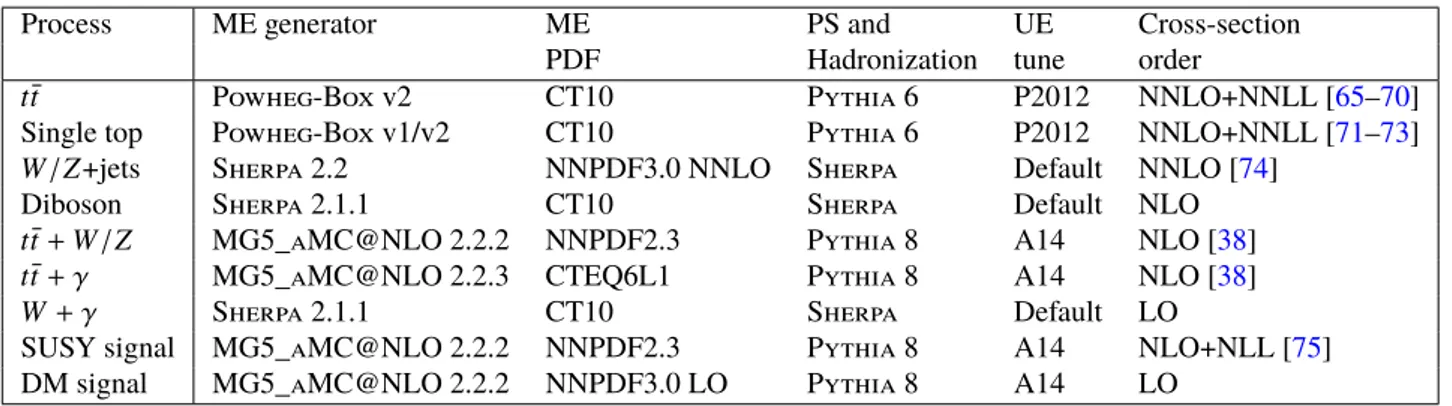
3 Monte Carlo Simulations
Samples of Monte Carlo (MC) simulated events are used for the description of the background and to model the SUSY signals. Several matrix element (ME) generators are combined with parton shower (PS) and hadronization generators. Signal SUSY samples are generated at leading order (LO) with MG5_aMC@NLO v2 [38] and interfaced with Pythia 8 [39]. The ˜ t
1decays are performed by Pythia and produce unpolarized top quarks. The ˜ χ
01
is taken to be a pure bino. Background samples are generated with one of three setups:
• MG5_aMC@NLO v2 interfaced with Pythia 8 or Herwig++ using the CKKW-L [40] or the MC@NLO [41] method for matching a LO or next-to-leading-order (NLO) ME to the PS, respec- tively.
• Powheg-Box v2 [42–46] interfaced to Pythia 6 [47] or Herwig++ using the Powheg method [48, 49] for matching the NLO ME to the PS. Electroweak t -channel single top-quark events are generated using the Powheg-Box v1 generator.
• Sherpa 2.1.1 and Sherpa 2.2 [50] using Comix [51] and OpenLoops [52] ME generators interfaced with the Sherpa parton shower [53].
The CT10 [54] NLO parton distribution function (PDF) set is used for ME calculations with Powheg-Box and Sherpa 2.1.1. The NNPDF 3.0 NNLO [55] and NNPDF2.3 [56] PDF set are used for samples generated with Sherpa 2.2 and MG5_aMC@NLO, except for the NLO samples, which use either CT10 or NNPDF3.0 [55]. The CTEQ6L1 [57] LO PDF set along with the P2012 [58] set of underlying-event tuned parameters (UE tune) is used for Pythia 6; the NNPDF2.3 LO PDF set and the A14 UE tune [59]
is used for Pythia 8; and the CT10 PDF set with the default UE tune provided by the authors of Sherpa
is used for the Sherpa samples. The samples produced with MG5_aMC@NLO and Powheg-Box use
EvtGen v1.2.0 [60] for the modeling of b -hadron decays. The simulation setup is summarized in Table 1
and more details can be found in Refs. [61–64] for t¯ t and single top, W/Z +jets, dibosons, and t¯ t + W/Z , respectively. Additional samples aside from those shown in Table 1 are used to assess theoretical modeling uncertainties and are discussed in Section 7.
Process ME generator ME PS and UE Cross-section
PDF Hadronization tune order
t t ¯ Powheg-Box v2 CT10 Pythia 6 P2012 NNLO+NNLL [65–70]
Single top Powheg-Box v1/v2 CT10 Pythia 6 P2012 NNLO+NNLL [71–73]
W /Z +jets Sherpa 2.2 NNPDF3.0 NNLO Sherpa Default NNLO [74]
Diboson Sherpa 2.1.1 CT10 Sherpa Default NLO
t t ¯ + W /Z MG5_aMC@NLO 2.2.2 NNPDF2.3 Pythia 8 A14 NLO [38]
t t ¯ + γ MG5_aMC@NLO 2.2.3 CTEQ6L1 Pythia 8 A14 NLO [38]
W + γ Sherpa 2.1.1 CT10 Sherpa Default LO
SUSY signal MG5_aMC@NLO 2.2.2 NNPDF2.3 Pythia 8 A14 NLO+NLL [75]
DM signal MG5_aMC@NLO 2.2.2 NNPDF3.0 LO Pythia 8 A14 LO
Table 1: Overview of the nominal simulated samples.
Signal samples of unpolarized top squark–antisquark pairs are generated with different stop decay and mass configurations. The first scenario assumes the ˜ t
1→ t + χ ˜
01
decay with a branching ratio ( BR ) of 100%. Samples are generated in a grid across the plane of ˜ t
1and ˜ χ
01
masses with a spacing of 50 GeV for most of the plane; the grid is more finely sampled towards the diagonal region where m
t˜1approaches m
t+ m
χ˜0
1
. The second signal scenario assumes the ˜ t
1→ b + χ ˜
±1
→ bW
(∗)χ ˜
01
decay with a BR of 100%. The three-dimensional parameter space of the ˜ t
1, ˜ χ
±1
, and ˜ χ
01
masses is probed using the two-dimensional plane of ˜ t
1and ˜ χ
01
masses under two different assumptions. In the first plane, the chargino mass is set to twice the LSP mass ( m
χ˜±1
= 2 m
χ˜0
1
), motivated by the pattern in GUT-scale models with gaugino universality. In the second plane, the chargino mass is set to be slightly below the stop mass, m
χ˜±1
= m
t˜1
− 10 GeV.
The DM signal samples are generated with MG5_aMC@NLO according to the diagram described in Figure 2. The model has 5 free parameters corresponding to the masses of the mediator and dark matter particle, the coupling of the mediator with the dark matter and SM particles, and the width of the mediator.
The signal grid is generated by scanning over the mass parameters. The coupling of the mediator to the dark matter particle ( g
χ) is set to be equal to its coupling to the quarks ( g
q). The common coupling is allowed to vary in the range 0.1–3.5. The minimal width assumption is made for the mediator [21].
All the MC samples are normalized to the highest-order (in α
S) cross-section available, as indicated in the last column of Table 1. The cross-sections for the pair and single production of top quarks as well as for the signal processes also include resummation of soft gluon emission to next-to-next-to-leading-logarithmic (NNLL) and next-to-leading-logarithmic (NLL) accuracy, respectively. The W/Z +jets samples have been produced with a simplified scale setting prescription in the multi- parton matrix elements, to improve the event generation speed. A theory-based re-weighting of the jet multiplicity distribution is applied at event level, derived from event generation with the strict scale prescription. As described in Section 6.1.3, it is important that the simulated t t ¯ + γ and t¯ t + Z events are as similar as possible.
Therefore, a small 4% correction is applied to the t t ¯ + γ cross-section to account for a different PDF set, factorization/renormalization scale, and number of partons from the matrix element.4 The same NLO
4
The t¯ t +γ sample uses a fixed factorization/renormalization scale of 2 × m
topwith no extra partons in the ME. The t¯ t +Z sample uses the default P
m
Tscale and is generated with up to two partons. The top decay is performed in MG5_aMC@NLO for t¯ t + γ to account for hard photon radiation from the top decay products, which is a ∼ 10% effect for p
γT
∼ 145 GeV [76].
5
QCD K -factor is then applied to the t¯ t + γ process as is used for the t¯ t + Z (→ ν ν) ¯ process [38].5 The cross-sections for the t¯ t , W +jets, and single top processes are used for cross-checks and optimization studies, while for the final results these processes are normalized to data in control regions.
All background samples, except for the t t ¯ + γ sample, are processed with the full simulation of the ATLAS detector [77] based on Geant 4 [78]. The signal samples and the t¯ t + γ sample are processed with a fast simulation [79] of the ATLAS detector with parameterized showers in the calorimeters. All samples are produced with varying numbers of simulated minimum-bias interactions generated with Pythia 8 overlaid on the hard-scattering event to account for pileup from multiple pp interactions in the same or nearby bunch crossings. The average number of interactions per bunch crossing is reweighted to match the distribution in data. Furthermore, the simulated samples are reweighted to account for small differences in the efficiencies of physics-object reconstruction and identification with respect to those measured in data.
4 Event Reconstruction and Selection
In this analysis, physics objects are labeled as either baseline or signal depending on various quality and kinematic requirements, where the latter label describes a tighter selection of the former. Baseline objects are used to distinguish between the physics objects in the event and to compute the missing transverse momentum. Baseline leptons (electrons and muons) are also used to apply a second-lepton veto to suppress dilepton t¯ t and W t events. All events must satisfy a series of quality criteria before being considered for further use. The reconstructed primary vertex with the highest P
tracks
p
2T
must have at least two associated tracks with p
T> 400 MeV.
Electron candidates are reconstructed from electromagnetic calorimeter cell clusters that are matched to ID tracks. Baseline electrons are required to have p
T> 7 GeV, |η | < 2 . 47, and satisfy ‘VeryLoose’ likelihood identification criteria that are defined following the methodology described in Ref. [80]. Signal electrons must pass all baseline requirements and in addition have p
T> 25 GeV, satisfy the ‘Loose’ likelihood identification criteria in Ref. [80], and have impact parameters with respect to the reconstructed primary vertex along the beam direction ( z
0) and in the transverse plane ( d
0) that satisfy | z
0sin θ | < 0 . 5 mm and
| d
0|/σ
d0< 5, where σ
d0is the uncertainty of d
0. Furthermore, signal electrons must be isolated, where the criteria use track-based information to obtain a 99% efficiency that is independent of p
T, as derived from Z → `` MC samples and confirmed in data [81].
Muons are reconstructed from combined tracks that are formed from ID and MS tracks, ID tracks matched to MS track segments, standalone MS tracks, or ID tracks matched to an energy deposit in the calorimeter compatible with a minimum-ionizing particle (referred to as calo-tagged muon) [82]. Baseline muons are required to have p
T> 6 GeV, |η | < 2 . 6, and satisfy the ‘Loose’ identification criteria described in Ref. [82]. Signal muons must pass all baseline requirements and in addition have p
T> 25 GeV, and have impact parameters | z
0sin θ | < 0 . 5 mm and |d
0|/σ
d0< 3. Furthermore, signal muons must be isolated according to isolation criteria similar to those used for signal electrons, yielding the same efficiency.
Photon identification is not used in the main event selection, and photons are reconstructed as extra jet or electron candidates. Photons must be identified, however, for the t¯ t + γ sample that is used in the
5
This choice is motivated by the similarity of QCD calculations for the two processes as well as empirical studies of the ratio
of K -factors computed as a function of the boson p
T. Further information about the K -factor and its uncertainty is given in
Section 7.
data-driven estimation of the t¯ t + Z background. In this case, photon candidates are reconstructed from calorimeter cell clusters and are required to satisfy the ‘Tight’ identification criteria described in Ref. [83].
Furthermore, photons are required to have p
T> 145 GeV and |η| < 2 . 37, excluding the barrel-endcap calorimeter transition in the range 1 . 37 < |η| < 1 . 52, so that the photon trigger is fully efficient. Photons must further satisfy ‘Tight’ isolation criteria based on both track and calorimeter information.
Jet candidates are built from topological clusters [84, 85] in the calorimeters using the anti- k
talgorithm with a jet radius parameter R = 0 . 4 [86]. Jets are corrected for contamination from pileup using the jet area method [87–89] and then calibrated to account for the detector response [90, 91]. Jets in data are further calibrated based on in situ measurements of the jet energy scale. Baseline jets are required to have p
T> 20 GeV. Signal jets must have p
T> 25 GeV and | η| < 2 . 5. Furthermore, signal jets with p
T< 60 GeV are required to satisfy criteria designed to reject jets originating from pileup [89]. Events containing a jet that does not pass specific jet quality requirements are vetoed from the analysis in order to suppress detector noise and non-collision backgrounds [92, 93]. Jets resulting from b -quarks (called b -jets) are identified using the MV2c10 b -tagging algorithm, which is based on quantities such as impact parameters of associated tracks and reconstructed secondary vertices [94, 95]. This algorithm is used at a working point that provides 77% b -tagging efficiency in simulated t¯ t events, and corresponds to a rejection factor of about 134 for light-quark flavors and gluons and about 6 for charm jets. Jets and associated tracks are also used to identify hadronically decaying τ leptons using the ‘Loose’ identification criteria described in Refs. [96, 97], which has a 60% and 50% efficiency for reconstructing τ leptons decaying into one and three charged pions, respectively. These τ candidates are required to have one or three associated tracks, with total electric charge opposite to that of the selected electron or muon, p
T> 20 GeV, and |η | < 2 . 5.
This τ candidate p
Trequirement is applied after a dedicated energy calibration [97].
The missing transverse momentum is reconstructed from the negative vector sum of the transverse momenta of baseline electrons, muons, jets, and a soft-term built from high-quality tracks that are associated with the primary vertex but not with the baseline physics objects [98, 99]. For the event selections requiring photons, the calibrated photon is directly included in the E
missT
calculation. In all other cases, photons and hadronically decaying τ leptons are not explicitly included but enter as jets or electrons, or via the soft-term.
To avoid labeling the same detector signature as more than one object, an overlap removal procedure is applied. The procedure is tailored for this analysis and optimized using simulation. Table 2 summarizes the procedure. Given a set of baseline objects, the procedure checks for overlap based on either a shared track, ghost-matching [88], or a minimal distance ∆R between pairs of objects. For example, if a baseline electron and a baseline jet are found with ∆R < 0 . 2, then the electron is retained (as stated in the
‘Precedence’ row) and the jet is discarded, unless the jet is b -tagged (as stated in the ‘Condition’ row) in which case the electron is assumed to stem from a heavy-flavor decay and is hence discarded while the jet is retained. If the matching requirement in Table 2 is not met, then both objects under consideration are kept. The order of steps in the procedure is given by the columns in Table 2, which are executed from left to right. The second ( e j ) and the third ( µ j ) steps of the procedure ensure that leptons and jets have a minimum ∆R separation of 0 . 2. Therefore, the fourth step ( ` j ) only has an effect for ∆R > 0 . 2. The steps involving a photon are not applied in the main event selection, but only for the event selection where photons are identified. For the remainder of the note, all baseline and signal objects are those that have survived the overlap removal procedure.
Large-radius jets are clustered from all signal (small-radius R = 0 . 4) jets using the anti- k
talgorithm with R = 1 . 0 or 1 . 2. To reduce the impact of soft radiation and pileup, the large-radius jets are groomed using reclustered jet trimming, where constituents with p
Tless than 5% of the ungroomed jet p
Tare
7
Object 1 e e µ ` γ γ τ
Object 2 µ j j j j e e
Matching
criteria shared track ∆R<0.2 ghost-matched ∆R<min
0.4,0.04+p`10 T/GeV
∆R<0.2 ∆R<0.1 ∆R<0.1
Condition calo-taggedµ jnotb-tagged
jnotb-tagged and
nj
track<3 orp
µ T pj T
>0.7
– – – –
Precedence e e µ j γ e e
Table 2: Overlap removal procedure. The first two rows list the types of overlapping objects: electrons ( e ), muons ( µ ), electron or muon ( ` ), jets ( j ), photons ( γ ), and hadronically decaying τ lepton ( τ ). All objects refer to the baseline definitions, except for γ and τ where no distinction between baseline and signal definition is made. The third row specifies when an object pair is considered as overlapping, the fourth row describes an optional condition, and the last row lists which label is given to the ambiguous object. More information is given in the text.
removed [100–103]. Electrons and muons are not included in the reclustering, since it was found that including them increases the background acceptance more than the signal efficiency. Large-radius jets are not used in the overlap removal procedure; however, the signal jets that enter the reclustering have passed the overlap removal procedure described above. The analysis uses a large-radius jet mass, where the squared mass is defined as the square of the four-vector sum of the constituent (small-radius) jets’
momenta.
All events are required to have E
missT
> 200 GeV, exactly one signal lepton, and no additional baseline leptons. In addition, the transverse mass6 of the signal lepton and the missing transverse momentum must satisfy m
T> 30 GeV, and the azimuthal angle between leading or sub-leading jet and the missing transverse momentum must be |∆φ(jet
i, ~ p
missT
) | > 0 . 4 with i ∈ { 1 , 2 } . The events must further pass an H
missT,sig
> 5 requirement, where H
missT,sig
= ( H
missT
− 100 GeV )/σ
HmissT
. The variable H
missT
is the magnitude of the negative vector sum of the transverse momenta of signal jets and the signal lepton; the resolution σ
HmissT
is computed using the per-event jet energy resolution uncertainties (more details are given in Refs. [24, 104]). The latter three event selection criteria suppress multijet processes with misidentified or non-prompt leptons and mismeasured E
missT
to a negligible level. With the above event selection, the dominant backgrounds are t t ¯ events with at least one leptonically decaying W boson, and W +jets production. A powerful technique for suppressing these background processes is to require m
Tto be greater than the W boson mass. For example, an m
T> 120 GeV requirement removes more than 90% of the remaining t¯ t and W +jets events.
One of the dominant contributions to the residual background is from t t ¯ production where both W bosons decay leptonically, or one W boson decays leptonically and the other via a hadronic τ decay. A series of additional variables, described in detail in Ref. [24], are used to discriminate between this background and the signal processes. The m
χtop
variable is the invariant mass of the three jets in the event most compatible with the hadronic decay products of a top quark, where the three jets are selected by a χ
2-minimization including the jet momenta and energy resolutions. The asymmetric m
T2( am
T2) [105–108] and m
τT2
are both variants of the variable m
T2[109], a generalization of the transverse mass applied to signatures where two particles are not directly detected. The am
T2variable targets dileptonic t¯ t events where one lepton is not reconstructed, while the m
τT2
variable targets t¯ t events where one of the two W bosons decays via a hadronically decaying τ lepton. Events are removed if one of the selected jets is additionally identified as a hadronic τ candidate, with a corresponding m
τT2
< 80 GeV, where m
τT2
uses the signal lepton and hadronic
6
The transverse mass m
Tis defined as m
2T
= 2 p
lepT
E
missT
[1 − cos (∆φ) ], where ∆φ is the azimuthal angle between the lepton and the missing transverse momentum direction. The quantity p
lepT
is the transverse momentum of the charged lepton.
τ candidate as the two visible objects [19]. The topness [110] variable is based on minimizing a χ
2-type function quantifying the compatibility with a dileptonic t t ¯ event where one lepton is not reconstructed.
The E
T,miss⊥variable is used to further reduce the backgrounds, where E
missT
is aligned with the leptonic top direction. After reconstructing the hadronic top through the χ
2minimization, the remaining b -jet is paired with the lepton to reconstruct the leptonic top. After boosting the leptonic top and E
missT
into the t¯ t rest frame, the perpendicular component of the E
missT
with respect to the leptonic top is computed. This E
T,miss⊥is expected to be smaller for the background due to the dominant contribution of the neutrino in the total E
missT
.
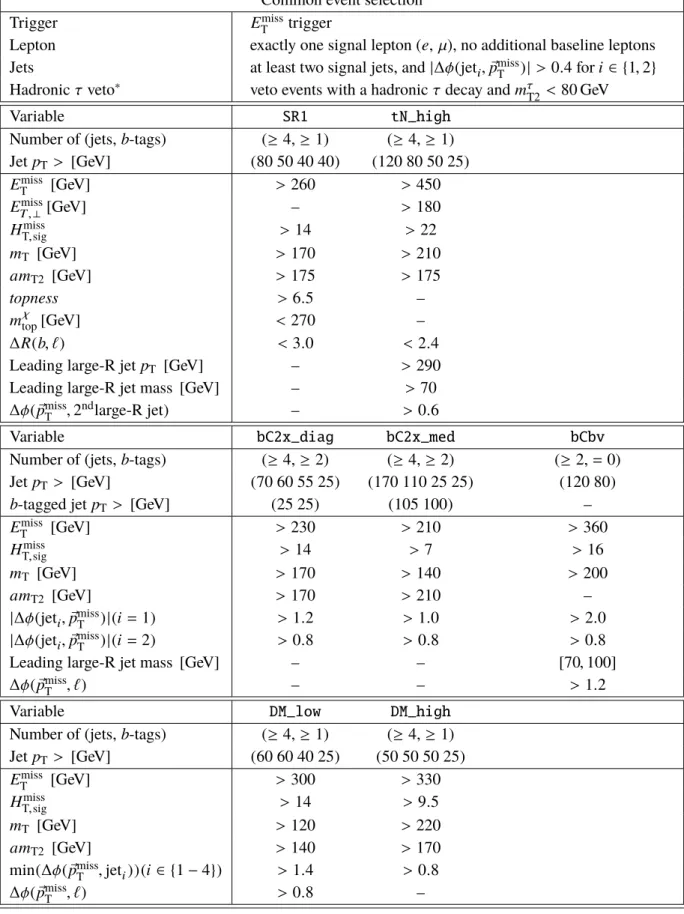
5 Signal Regions
Seven signal event selections (called signal regions, or SR) are constructed using the set of discriminating variables described in Section 4. Six signal regions are newly optimized, before looking at the data, to maximize the discovery sensitivity using benchmark signal models, each representing a distinct phe- nomenology. Given the small excess observed in one signal region ( SR1 ) in the previous analysis [19], this SR is included without modifications in order to monitor the excess.
Two signal regions ( SR1 and tN_high ) are used to cover the ˜ t
1and ˜ χ
01
mass plane, under the assumption of 100% BR to ˜ t
1→ t + χ ˜
01
decay. The SR1 targets the region with low mass splitting between the ˜ t
1and χ ˜
01
, where the decay products are fully resolved. The tN_high targets the region with high mass splitting, leading to very boosted top quarks where the decay products are close-by and can be reconstructed within a single large-R jet. The benchmark points used for the optimization in the (˜ t
1, ˜ χ
01
) plane are (600, 200) GeV for SR1 and (800, 1) GeV for tN_high , respectively.
Two signal regions ( bC2x_diag and bC2x_med ) are used to cover the (˜ t
1, ˜ χ
±1
, ˜ χ
01
) mass plane, under the assumption of 100% BR to ˜ t
1→ b + χ ˜
±1
decay and m
χ˜±1
= 2 m
χ˜0
1
. The bC2x_diag is designed for scenarios where the mass splitting between stop and neutralino is relatively small7, while the bC2x_med covers the scenarios of large mass splitting. The kinematics of the decay products are governed by the different mass splittings, producing high- p
Tb -jets from the ˜ t
1– ˜ χ
±1
mass splitting and high- p
TW bosons from the ˜ χ
±1
– ˜ χ
01
splitting. The benchmark points used for the optimization are (600, 500, 250) GeV and (650, 300, 150) GeV respectively.
A fifth signal region ( bCbv ) is designed to target the (˜ t
1, ˜ χ
±1
, ˜ χ
01
) mass plane, under the assumption of 100% BR to ˜ t
1→ b + χ ˜
±1
decay and m
χ˜±1
= m
t˜1
− 10 GeV. In this scenario the b -jets from the ˜ t
1decay are too soft to be reconstructed and the sensitivity can be increased by requiring a b -veto in the event. The large mass splitting between chargino and neutralino leads to boosted W bosons. The signal benchmark considered for this SR is (700, 690, 1) GeV.
The last two signal regions ( DM_low and DM_high ) are designed to be sensitive to DM production in association with top quarks. The benchmark signals targeted by the two SRs in the ( m
φ, m
χ, g
q, χ) parameter space are (100 GeV, 1 GeV, 1) and (350 GeV, 1 GeV, 3.5), respectively.
The signal region definitions are summarized in Table 3. The signal regions are not mutually exclusive.
7
The mass splitting is large enough for b -jets to be reconstructed and identified. For small enough mass splitting the b -jets can become too soft to be reconstructed.
9
Common event selection
Trigger E
missT
trigger
Lepton exactly one signal lepton ( e , µ ), no additional baseline leptons Jets at least two signal jets, and |∆φ( jet
i, ~ p
missT
)| > 0 . 4 for i ∈ { 1 , 2 } Hadronic τ veto
∗veto events with a hadronic τ decay and m
τT2
< 80 GeV
Variable SR1 tN_high
Number of (jets, b -tags) ( ≥ 4, ≥ 1) ( ≥ 4, ≥ 1) Jet p
T> [GeV] ( 80 50 40 40 ) ( 120 80 50 25 ) E
missT
[GeV] > 260 > 450
E
T,⊥miss[GeV] – > 180
H
T,misssig
> 14 > 22
m
T[GeV] > 170 > 210
am
T2[GeV] > 175 > 175
topness > 6 . 5 –
m
χtop
[GeV] < 270 –
∆R( b, `) < 3 . 0 < 2 . 4
Leading large-R jet p
T[GeV] – > 290
Leading large-R jet mass [GeV] – > 70
∆ φ( p ~
missT
, 2
ndlarge-R jet ) – > 0 . 6
Variable bC2x_diag bC2x_med bCbv
Number of (jets, b -tags) ( ≥ 4, ≥ 2) ( ≥ 4, ≥ 2) ( ≥ 2, = 0) Jet p
T> [GeV] ( 70 60 55 25 ) ( 170 110 25 25 ) ( 120 80 )
b -tagged jet p
T> [GeV] ( 25 25 ) ( 105 100 ) –
E
missT
[GeV] > 230 > 210 > 360
H
missT,sig
> 14 > 7 > 16
m
T[GeV] > 170 > 140 > 200
am
T2[GeV] > 170 > 210 –
|∆φ( jet
i, ~ p
missT
) | (i = 1 ) > 1 . 2 > 1 . 0 > 2 . 0
|∆φ( jet
i, ~ p
missT
) | (i = 2 ) > 0 . 8 > 0 . 8 > 0 . 8
Leading large-R jet mass [GeV] – – [70 , 100]
∆φ( p ~
missT
, `) – – > 1 . 2
Variable DM_low DM_high
Number of (jets, b -tags) ( ≥ 4, ≥ 1) ( ≥ 4, ≥ 1) Jet p
T> [GeV] (60 60 40 25) (50 50 50 25) E
missT
[GeV] > 300 > 330
H
missT,sig
> 14 > 9 . 5
m
T[GeV] > 120 > 220
am
T2[GeV] > 140 > 170
min (∆φ( p ~
missT
, jet
i))(i ∈ { 1 − 4 } ) > 1 . 4 > 0 . 8
∆φ( p ~
missT
, `) > 0 . 8 –
Table 3: Overview of the event selections for the seven SRs considered in the analysis. Round brackets are used to
describe lists of values and square brackets denote intervals.
∗The hadronic tau veto is not applied to the bCbv SR,
since the t t ¯ background is negligible.
30 90 120 100
100 175 200
am
T2[GeV] N
b-tags= 0
N
b-tags≥ 1 N
b-tags≥ 2
0
N
g≥ 1
with photon added [GeV]
miss
= E T miss
E ~ T
0 1 2 3 4 5
Events / 0.3
10 20 30
Data 2L
t t
1L t
t
Single Top W+jets
+V t
t
VV
Total SM Internal
ATLAS
= 13 TeV, 3.2 fb -1
s
STCR1
2 )
1 ,b
∆ R(b
0 1 2 3 4 5
Data / SM 0.5 1 1.5
2 )
1 ,b
∆ R(b
0 1 2 3 4 5
t Wt / t
0 0.5
1 1.5
with photon added [GeV]
miss
= E T miss
E ~ T
0 1 2 3 4 5
Events / 0.3
10 20 30
Data 2L tt
1L tt
Single Top W+jets
+V tt VV
Total SM Internal
ATLAS
= 13 TeV, 3.2 fb -1
s STCR1
2 )
1 ,b
∆ R(b
0 1 2 3 4 5
Data / SM 0.5 1 1.5
2 )
1 ,b
∆ R(b
0 1 2 3 4 5
t Wt / t
0 0.5 1 1.5
with photon added [GeV]
miss
= E T miss
E ~ T
0 1 2 3 4 5
Events / 0.3
10 20 30
Data 2L t
t
1L t
t
Single Top W+jets
+V t
t
VV
Total SM Internal
ATLAS
= 13 TeV, 3.2 fb -1
s
STCR1
2 )
1 ,b
∆ R(b
0 1 2 3 4 5
Data / SM 0.5
1 1.5
2 )
1 ,b
∆ R(b
0 1 2 3 4 5
t Wt / t
0 0.5
1 1.5
WCR WVR WVR-tail
with photon added [GeV]
miss
= E T miss
E ~ T
0 1 2 3 4 5
Events / 0.3
10 20 30
Data 2L tt
1L tt
Single Top W+jets
+V tt VV
Total SM Internal
ATLAS
= 13 TeV, 3.2 fb -1
s STCR1
2 )
1 ,b
∆ R(b
0 1 2 3 4 5
Data / SM 0.5 1 1.5
2 )
1 ,b
∆ R(b
0 1 2 3 4 5
t Wt / t
0 0.5 1
1.5 E ~ miss T = E miss T with photon added [GeV]
0 1 2 3 4 5
Events / 0.3
10 20 30
Data 2L tt
1L tt
Single Top W+jets
+V tt VV
Total SM Internal
ATLAS
= 13 TeV, 3.2 fb -1
s STCR1
2 )
1 ,b
∆ R(b
0 1 2 3 4 5
Data / SM 0.5 1 1.5
2 )
1 ,b
∆ R(b
0 1 2 3 4 5
t Wt / t
0 0.5 1 1.5
TCR TVR
with photon added [GeV]
miss
= E T miss
E ~ T
0 1 2 3 4 5
Events / 0.3
10 20 30
Data 2L t
t
1L t
t
Single Top W+jets
+V t
t
VV
Total SM Internal
ATLAS
= 13 TeV, 3.2 fb -1
s
STCR1
2 )
1 ,b
∆ R(b
0 1 2 3 4 5
Data / SM 0.5
1 1.5
2 )
1 ,b
∆ R(b
0 1 2 3 4 5
t Wt / t
0 0.5
1 1.5
STCR
[GeV]
m T
100 200 300 400 500 600 700 800 900
Events / 100 GeV
2 4 6 8 10
Data 2L tt
Single Top W+jets Other
+V tt
Total SM
) = (1.1,0.7) TeV
t
1,m ~
(m g~
) = (1.1,0.8) TeV
t
1,m ~
(m g~
Internal ATLAS
= 13 TeV, 3.2 fb -1
s SR1
[GeV] m T
100 200 300 400 500 600 700 800 900
Events / 100 GeV
2 4 6 8 10
Data 2L t
t
Single Top W+jets
Other +V
t t
Total SM
) = (1.1,0.7) TeV
t 1
,m ~
~ g
(m
) = (1.1,0.8) TeV
t 1
,m ~
~ g
(m Internal
ATLAS
= 13 TeV, 3.2 fb -1
s
SR1
100 m
T[GeV]
TZCR
with photon added [GeV]
miss
= E T miss
E ~ T
0 1 2 3 4 5
Events / 0.3
10 20 30
Data 2L tt
1L tt
Single Top W+jets
+V tt
VV
Total SM Internal
ATLAS
= 13 TeV, 3.2 fb -1
s
STCR1
2 )
1 ,b
∆ R(b
0 1 2 3 4 5
Data / SM 0.5
1 1.5
2 )
1 ,b
∆ R(b
0 1 2 3 4 5
t Wt / t
0 0.5
1 1.5
SR
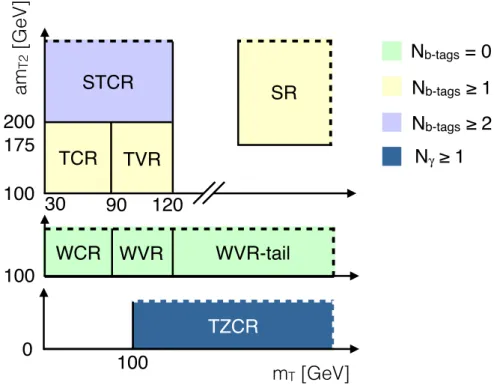
Figure 3: A schematic diagram for the various event selections used to estimate and validate the background normalizations. Solid lines indicate kinematic boundaries while dashed lines indicate that the events can extend beyond the boundary. CR, VR, and SR stand for control region, validation region, and signal region, respectively.
T, ST, TZ, and W stand for t t ¯ , single top, t t ¯ + Z , and W +jets, respectively.
6 Background Estimates
The dominant background processes are t¯ t , single top W t , t¯ t + Z (→ ν ν), and ¯ W +jets. Most of the t¯ t and W t events in the signal regions (SR) have both W bosons decaying leptonically (where one of the two leptons is ‘lost’, meaning it is either not reconstructed, not identified, or removed by the overlap removal procedure) or one W boson decaying leptonically and the other via a hadronically decaying τ lepton.
Other background processes considered are dibosons, t¯ t + W , Z +jets, and multijet events. The combined t t ¯ + W and t t ¯ + Z background is referred to as t¯ t + V .
The main background processes are estimated by isolating each of them in a dedicated control region (CR), described in Section 6.1, normalizing simulation to match data in a simultaneous fit. The fit is performed separately for each SR with the associated CRs. The background modeling as predicted by the fits is tested in a series of validation regions (VR), discussed in Section 6.2. Figure 3 schematically illustrates the setup for one example SR and its associated CRs and VRs.
The contribution of multijet background is estimated and found to be negligible. All other small back- grounds are determined from simulation and normalized to the most accurate theoretical cross-section available.
11
6.1 Control Regions
A series of CRs are defined as event selections that are kinematically close to the SRs but with a few key variable requirements inverted to significantly reduce signal contamination and enhance the yield and purity of a particular background. These CRs are then used to constrain the background normalization.
Each SR has a dedicated CR for each of the following background processes: t¯ t (TCR), W +jets (WCR), single top (STCR), and t¯ t + W /Z (TZCR), except for bCbv where only TCR and WCR are defined as the contribution of W t and t¯ t + W/Z are found to be negligible after the b -veto requirement. The general strategy in constructing the CRs is to invert the transverse mass requirement from a high threshold to a low window. The requirements on several variables are loosened to increase the statistical power of the CR. The details of the TCR and the WCR are described in Section 6.1.1, while the STCR and TZCR are documented in Section 6.1.2 and 6.1.3, respectively. Tables 4 - 6 present an overview of the CR selections for the TCR, WCR, and STCR corresponding to all SRs. The TZCRs have a common selection and only differ on the jet p
Trequirements. To obtain a set of background predictions that are independent of the observations in the SRs, a likelihood fit is performed for each SR [111]. The fit can be configured to use only the CRs to constrain the four fit parameters corresponding to the normalizations of t t ¯ , single top, W +jets, and t t ¯ + W/Z events in the CRs. This fit configuration is referred to as the background-only fit.
The E
missT
distribution for the CRs associated with SR1 are shown in Figure 4.
6.1.1 Top and W CRs
The TCRs and WCRs are constructed by modifying the m
Tselection in the SRs to be a window whose upper edge is near the W boson mass. An additional upper bound on am
T2is applied to the TCRs in order to make them orthogonal to the STCRs, described in the next section. Furthermore, some other kinematic requirements are relaxed or removed to increase the event yields in the CRs. The resulting selections are enriched in semileptonic t¯ t events with purities that vary between 51% and 91%. The WCRs are built from the TCRs by changing the b -jet requirement to a b -jet veto, and the am
T2requirement is relaxed where needed to improve the statistics of the WCR. The b -jet veto suppresses t¯ t events and results in a W +jets purity of approximately 75% in the WCRs.
6.1.2 Single Top CRs
All of the expected single-top contributions in the SRs are from the W t process. This process can evade kinematic bounds from selections targeting the suppression of t¯ t . Nonetheless, isolating a pure sample of W t events kinematically close to the SRs is challenging due to the similarity of the W t and t t ¯ processes.
The W t events that pass event selections similar to those for the SRs often have a second b -jet within the acceptance. The am
T2variable is useful for discriminating W t events from t¯ t events because the mass of the W b system not from the resonant top quark is typically higher than for an on-shell top quark in the phase space selected by this analysis. Therefore, the STCRs all require am
T2> 200 GeV. Furthermore, to increase the purity of W t and reduce the W +jets contamination, events are required to have two b -tagged jets.
The t¯ t events can exceed the am
T2kinematic bound when one of the two b -tags used in the am
T2calculation
is a charm quark from the W decay misidentified as a b -tagged jet. When the mistagged jet is from the
same top quark as the other b -tagged jet, the ∆R between the two b -tags tends to be smaller than for the
W t events that have two b -jets from b -quarks. Therefore, to further increase the W t purity, events in the
Common event selection for tN
Trigger E
missT
trigger
Lepton exactly one signal lepton ( e , µ ), no additional baseline leptons Jets at least four signal jets, and |∆ φ( jet
i, ~ p
missT
) | > 0 . 4 for i ∈ { 1 , 2 } Hadronic τ veto veto events with a hadronic τ decay and m
τT2
< 80 GeV
Variable SR1 TCR / WCR STCR
≥ 4 jets with p
T> [GeV] ( 80 50 40 40 ) ( 80 50 40 40 ) ( 80 50 40 40 ) E
missT
[GeV] > 260 > 200 > 200
H
missT,sig
> 14 > 5 > 5
m
T[GeV] > 170 [30,90] [30,120]
am
T2[GeV] > 175 [100 , 200] / > 100 > 200
topness > 6 . 5 > 6 . 5 > 6 . 5
m
χtop
[GeV] < 270 < 270 < 270
∆R( b, `) < 3 . 0 – –
∆R( b
1, b
2) – – > 1 . 2
Number of b -tags ≥ 1 ≥ 1 / = 0 ≥ 2
Variable tN_high TCR / WCR STCR
≥ 4 jets with p
T> [GeV] ( 120 80 50 25 ) ( 120 80 50 25 ) ( 120 80 50 25 ) E
missT
[GeV] > 450 > 300 > 250
E
T,⊥miss[GeV] > 180 > 160 > 160
H
missT,sig
> 22 > 15 > 10
m
T[GeV] > 210 [30,90] [30,120]
am
T2[GeV] > 175 [100 , 200] / > 100 > 200
∆R( b, `) < 2 . 4 – –
∆R( b
1, b
2) – – > 1 . 2
Number of b -tags ≥ 1 ≥ 1 / = 0 ≥ 2
Leading large-R jet p
T[GeV] > 290 > 290 > 290
Leading large-R jet mass [GeV] > 70 > 70 > 70
∆φ( p ~
missT
, 2
ndlarge-R jet ) > 0 . 6 > 0 . 6 > 0 . 6
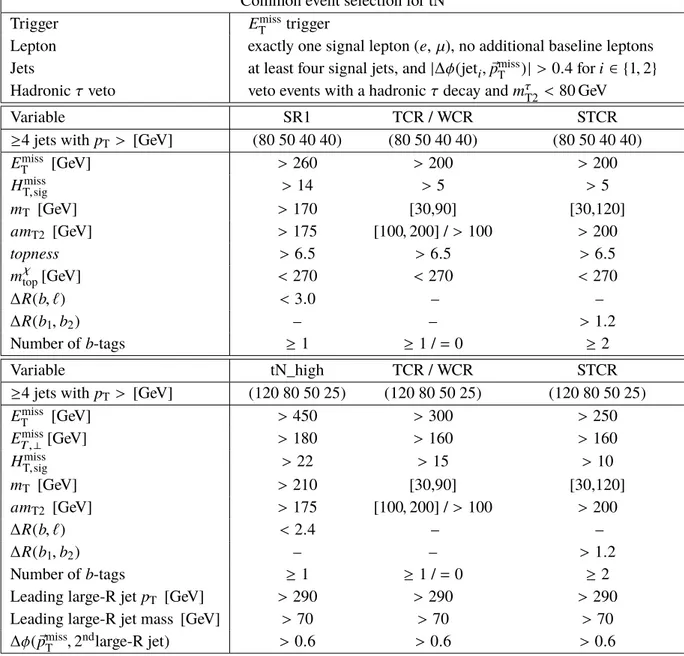
Table 4: Overview of the event selections for tN SRs and the associated t t ¯ (TCR), W +jets (WCR), and W t (STCR) control regions. Round brackets are used to describe lists of values and square brackets denote intervals.
13
Common event selection for bC
Trigger E
missT
trigger
Lepton exactly one signal lepton ( e , µ ), no additional baseline leptons Jets at least two signal jets, and |∆φ( jet
i, ~ p
missT
)| > 0 . 4 for i ∈ { 1 , 2 } Hadronic τ veto
∗veto events with a hadronic τ decay and m
τT2
< 80 GeV
Variable bC2x_diag TCR / WCR STCR
≥ 4 jets with p
T> [GeV] (70 60 55 25) (70 60 55 25) (70 60 55 25)
≥ 2 b -tagged jets with p
T> [GeV] ( 25 25 ) ( 25 25 ) / – ( 25 25 ) E
missT
[GeV] > 230 > 230 > 230
H
missT,sig
> 14 > 14 > 5
m
T[GeV] > 170 [30,90] [30,120]
am
T2[GeV] > 170 [100 , 200] / > 170 > 200
|∆φ(jet
i, ~ p
missT
) | (i = 1) > 1 . 2 > 1 . 2 > 1 . 2
|∆ φ( jet
i, ~ p
missT
) | (i = 2 ) > 0 . 8 > 0 . 8 > 0 . 8
∆R( b
1, b
2) – – > 1 . 4
Number of b -tags ≥ 2 ≥ 2 / = 0 ≥ 2
Variable bC2x_med TCR / WCR STCR
≥ 4 jets with p
T> [GeV] ( 170 110 25 25 ) ( 170 110 25 25 ) ( 170 110 25 25 )
≥ 2 b -tagged jets with p
T> [GeV] (105 100) (105 100) / – (105 100) E
missT
[GeV] > 210 > 210 > 210
H
missT,sig
> 7 > 7 > 7
m
T[GeV] > 140 [30,90] [30,120]
am
T2[GeV] > 210 [100 , 210] / > 210 > 210
|∆φ( jet
i, ~ p
missT
) | (i = 1 ) > 1 . 0 > 1 . 0 > 1 . 0
|∆φ(jet
i, ~ p
missT
) | (i = 2) > 0 . 8 > 0 . 8 > 0 . 8
∆R( b
1, b
2) – – > 1 . 2
Number of b -tags ≥ 2 ≥ 2 / = 0 ≥ 2
Variable bCbv TCR WCR
≥ 2 jets with p
T> [GeV] (120 80) (120 80) (120 80)
E
missT
[GeV] > 360 > 360 > 360
H
missT,sig
> 16 > 16 > 16
m
T[GeV] > 200 [30,90] [30,90]
Lepton p
T[GeV] > 60 > 60 > 60
|∆φ( jet
i, ~ p
missT
) | (i = 1 ) > 2 . 0 > 2 . 0 > 2 . 0
|∆φ(jet
i, ~ p
missT
) | (i = 2) > 0 . 8 > 0 . 8 > 0 . 8
Number of b -tags = 0 ≥ 1 = 0
Leading large-R jet mass [GeV] [70 , 100] [70 , 100] [70 , 100]
∆φ( p ~
missT
, `) > 1 . 2 – –
Table 5: Overview of the event selections for bC SRs and the associated t t ¯ (TCR), W +jets (WCR), and W t (STCR)
control regions. Round brackets are used to describe lists of values and square brackets denote intervals. The
hadronic tau veto is not applied to the bCbv SR, since the t t ¯ background is negligible.
Common event selection for DM
Trigger E
missT
trigger
Lepton exactly one signal lepton ( e , µ ), no additional baseline leptons Jets at least four signal jets, and |∆φ( jet
i, p ~
missT
) | > 0 . 4 for i ∈ { 1 , 2 } Hadronic τ veto veto events with a hadronic τ decay and m
τT2
< 80 GeV
Variable DM_low TCR / WCR STCR
≥ 4 jets with p
T> [GeV] (60 60 40 25) (60 60 40 25) (60 60 40 25) E
missT
[GeV] > 300 > 200 / > 230 > 200
H
missT,sig
> 14 > 8 > 8
m
T[GeV] > 120 [30,90] [30,120]
am
T2[GeV] > 140 [100 , 200] / > 100 > 200
min (∆φ( p ~
missT
, jet
i))(i ∈ { 1 − 4 } ) > 1 . 4 > 1 . 4 > 1 . 4
∆φ( p ~
missT
, `) > 0 . 8 > 0 . 8 –
∆R( b
1, b
2) – – > 1 . 8
Number of b -tags ≥ 1 ≥ 1 / = 0 ≥ 2
Variable DM_high TCR / WCR STCR
≥ 4 jets with p
T> [GeV] ( 50 50 50 25 ) ( 50 50 50 25 ) ( 50 50 50 25 ) E
missT
[GeV] > 330 > 300 / > 330 > 250
H
missT,sig
> 9 . 5 > 9 . 5 > 5
m
T[GeV] > 220 [30,90] [30,120]
am
T2[GeV] > 170 [100 , 200] / > 100 > 200
min( ∆φ( p ~
missT
, jet
i))(i ∈ { 1 − 4 } ) > 0 . 8 > 0 . 8 > 0 . 8
∆R( b
1, b
2) – – > 1 . 2
Number of b -tags ≥ 1 ≥ 1 / = 0 ≥ 2
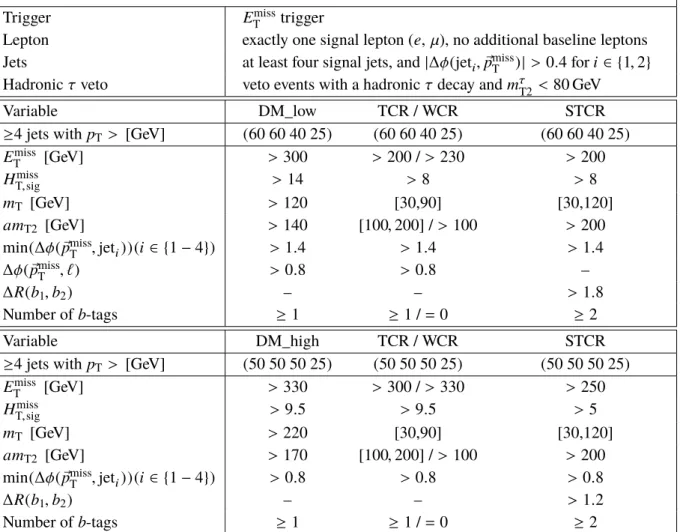
Table 6: Overview of the event selections for DM SRs and the associated t t ¯ (TCR), W +jets (WCR), and W t (STCR) control regions. Round brackets are used to describe lists of values and square brackets denote intervals.
STCRs are required to have ∆R(b
1, b
2) > 1 . 2 where b
1and b
2are the two highest- p
Tb -tagged jets. For DM_low and bC2x_diag STCRs, the requirement of the ∆R( b
1, b
2) is even tighter to increase the purity of W t events as shown in Tables 5 and 6. The expected purity for W t events varies between 40 and 50%
in the STCRs.
6.1.3 t t ¯ + Z CRs
Top quark pair production in association with a Z boson that decays into neutrinos is an irreducible background. The expected contributions of t¯ t + W in the seven SRs are less than 10% with respect to the expected t¯ t + Z yields, and the two processes are combined in the analysis. A CR using Z boson decays to charged leptons is not feasible given the small branching ratio to leptons and the limited dataset available.
However, a data-driven approach is still possible using a similar process: t¯ t + γ . The CR is designed to minimize the differences between the two processes, in order to reduce the theoretical uncertainties in the extrapolation. The main differences arise from the Z boson mass, which reduces the available phase space, causing differences in kinematic distributions. In addition, the bremsstrahlung rate for Z
15
bosons is highly suppressed at LHC energies, while there is a large contribution to the t t ¯ + γ cross-section from photons radiated from the top quark or its decay products. Both of these differences are mitigated if the boson p
Tis larger than the Z boson mass. In this limit, the impact of the mass difference on the available phase space is reduced and the rate of photon radiation from bremsstrahlung is suppressed [76].
The small contribution of photon radiations is fully accounted for in the simulation and any uncertainty in their modeling is subdominant compared to the uncertainties described in Section 7. In high- E
missT
t t ¯ + Z (→ ν ν) ¯ events, the Z boson p
Tis the dominant source of E
missT
. Hence most of t¯ t + Z events in the SRs have large Z boson p
T.
The event selection for the different TZCRs requires at least one signal photon, exactly one signal lepton and no additional baseline leptons, and at least four signal jets, of which at least one must be b -tagged.
Furthermore the TZCRs are required to have the same jet p
Tthresholds as the corresponding SRs. To mimic the Z → ν ν ¯ decay, the highest- p
Tphoton is vectorially added to ~ p
missT
and this sum is used to construct ˜ E
missT
= | p ~
missT
+ ~ p
γT
| , ˜ m
T, and ˜ H
missT,sig
. Events entering the TZCRs are required to satisfy E ˜
missT
> 120 GeV, ˜ m
T> 100 GeV, and ˜ H
missT,sig
> 5 in order to bring the region kinematically closer to the SRs. Finally, E
missT
< 200 GeV is imposed to ensure orthogonality between the TZCR and the other CRs and SRs. The resulting regions have over 90% t t ¯ + γ purity, with the main background being W + γ + jets.
Without scaling, the total number of events in data is about 30-47% higher than in simulation, but there is no significant evidence of mismodeling of the shapes of the various distributions within uncertainties.
6.2 Validation Regions
The background estimates are tested using VRs, which are disjoint from both the CRs and SRs. Background normalizations determined in the CRs are extrapolated to the VRs and compared with the observed data.
Each SR has associated VRs for the t¯ t (TVR) and W +jets (WVR) processes, and these are constructed with the same selection as the TCR/WCR except that m
Tis between 90 and 120 GeV.8 The VRs are not used to constrain parameters in the fit, but provide a statistically independent test of the background estimates made using the CRs. The potential signal contamination in the VRs is studied for all considered signal models and mass ranges, and found to be negligible.
A second set of VRs, not associated with any of the SRs, is used for further study of the main backgrounds.
Two of the more significant backgrounds are dileptonic t t ¯ and lepton+hadronic τ t¯ t events. The modeling of these backgrounds is validated in dedicated VRs that require either two signal leptons (electron or muon) or one signal lepton and one hadronic τ candidate. In Figure 5 the m
Tand am
T2distributions are shown for event selections requiring four jets, an electron-muon pair (left) and one lepton plus one τ candidate (right), respectively. The m
Tis constructed using the leading lepton. Additional VRs are constructed by considering (1) events with high E
missT
, high m
T, and low am
T2for dilepton t t ¯ events with a lost lepton or (2) high m
Tand a b -jet veto to probe the modeling of the resolution-induced m
Ttail in W +jets events (denoted WVR-tail region in Figure 3). There are no significant indications of mismodeling in any of the VRs.
8
A W t VR is not defined since the m
Trange in the STCR is extended upward to 120 GeV to accept more events.
[GeV]
miss
ET
200 250 300 350 400 450 500 550 600 650 700
events / 20 GeV
0 50 100 150 200 250
300 Data Total SM
t
t Z+jets
W+jets tt+V
Wt Diboson
ATLAS Preliminary = 13 TeV, 13.2 fb-1
s
obs_x_TCR_SR1_met1000
Data / MC
0 0.5 1 1.5 2
[GeV]
miss
ET
200 250 300 350 400 450 500 550 600 650 700
events / 20 GeV
0 100 200 300 400 500
600 Datatt Total SMZ+jets
W+jets tt+V
Wt Diboson
ATLAS Preliminary = 13 TeV, 13.2 fb-1
s
obs_x_WCR_SR1_met1000
Data / MC
0 0.5 1 1.5 2
[GeV]
miss
ET
200 250 300 350 400 450 500 550 600 650 700
events / 20 GeV
0 10 20 30 40 50 60
70 Datatt Total SMZ+jets
W+jets tt+V
Wt Diboson
ATLAS Preliminary = 13 TeV, 13.2 fb-1
s
obs_x_STopCR_SR1_met1000
Data / MC
0 0.5 1 1.5 2
with photon added [GeV]
miss
= ET miss
E~T
0 50 100 150 200 250 300 350 400 450 500
events / 20 GeV
0 5 10 15 20 25 30 35 40
45 Data Total SM
γ W+ tt+γ
t
t Z+jets
W+jets tt+V
Wt Diboson
ATLAS Preliminary = 13 TeV, 13.2 fb-1
s
obs_x_ttZCR_SR1_photon_met1000
Data / MC
0 0.5 1 1.5 2
Figure 4: Distributions of E
missT
(top left for TCR, top right for WCR and bottom left for STCR), and photon-corrected E
missT