ATLAS-CONF-2016-066 08August2016
ATLAS NOTE
ATLAS-CONF-2016-066
4th August 2016
Search for Supersymmetry in events with photons, jets and missing transverse energy with the ATLAS detector in 13 TeV p p collisions
The ATLAS Collaboration
Abstract
This note presents a search for the experimental signature of isolated photons, jets and high missing transverse momentum in excess of the Standard Model expectation in proton- proton collisions at a center-of-mass energy of 13 TeV. Such a final state may originate from supersymmetric models with gauge-mediated supersymmetry breaking in events where neutralinos decay into a photon and a gravitino. The search is performed using the dataset recorded with the ATLAS detector at the LHC in 2015 and early 2016, corresponding to an integrated luminosity of 13.3 fb
−1.
© 2016 CERN for the benefit of the ATLAS Collaboration.
Reproduction of this article or parts of it is allowed as specified in the CC-BY-4.0 license.
1. Introduction
This work describes a search for an excess of events with isolated high- p
Tphotons, jets and large missing transverse momentum (with magnitude denoted E
missT
). The search is performed with the Run 2 dataset of pp collisions at
√ s = 13 TeV recorded in 2015 and 2016 with the ATLAS detector at the LHC, corresponding to a total integrated luminosity of 13.3 fb
−1. This analysis is an extension of the one performed with the full dataset of the Run 1 of LHC which is included in Ref. [1].
Such a signature arises in models of supersymmetry (SUSY) [2–8], which is a theoretically well motivated candidate for physics beyond the Standard Model (SM). Theories of Gauge Mediated Symmetry Breaking (GMSB) [9–11] presume a hidden sector in which supersymmetry is broken, and the symmetry breaking is communicated to the visible sector through Standard Model gauge boson interactions. The lightest supersymmetric particle (LSP) in GMSB is the ultra-light gravitino ( ˜ G ), which under certain circumstances is a viable dark matter candidate [12, 13]. The phenomenology of GMSB models is determined by the nature of the next-to-lightest supersymmetric particle (NLSP), which for a large part of the GMSB parameter space is the lightest neutralino ˜ χ
01
. Neutralinos are mixtures of gaugino ( ˜ B , ˜ W
0) and higgsino ( ˜ H
u0, H ˜
d0) eigenstates, and therefore the lightest neutralino decays to a ˜ G and either a γ , Z , or h (the lightest neutral Higgs boson, assumed compatible with the observed Higgs boson in ATLAS and CMS). If the
χ ˜
01
is bino-like, the main decay mode is ˜ χ
01
→ γ G ˜ . If the ˜ χ
01
is higgsino-like, it decays as ˜ χ
01
→ h G ˜ . In addition, since the longitudinal polarization component of the Z boson is also a Goldstone mode of the Higgs field, a higgsino-like neutralino can also decay as ˜ χ
01
→ Z G ˜ . Consequently, a ˜ χ
01
pair produced in a collider can give rise to a signature containing two final-state bosons ( hh , hγ , hZ , Z γ , Z Z , γγ ) plus E
missT
from the stable, undetectable LSP particles ( ˜ G ). Several searches for these signatures have been performed at the Tevatron [14, 15] and the LHC [1, 16–25]. The scenarios considered in this analysis are the ones with at least one γ plus two ˜ G in the final state, expected in the case of ˜ χ
01
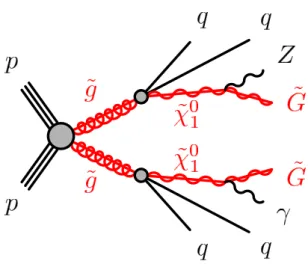
being a bino-higgsino admixture, as shown in Figure 1.
In recent years, the efforts to formulate GMSB in a model-independent way have led to the development of General Gauge Mediation (GGM) [26, 27]. GGM includes an observable sector with all the Minimal Supersymmetric Standard Model (MSSM) fields, together with a hidden sector that contains the source of SUSY breaking. In GGM, there need not be any mass hierarchy between colored and uncolored states, and therefore there is no theoretical constraint on the colored-states mass, thus putting these states within reach of the LHC.
2. The ATLAS detector
The ATLAS detector [28] consists of an inner tracking system surrounded by a superconducting solenoid, electromagnetic (EM) and hadronic (HAD) calorimeters, and a muon spectrometer (MS). The inner detector (ID) is immersed in a 2 T axial magnetic field, and consists of pixel and silicon microstrip (SCT) detectors inside a transition radiation tracker (TRT), providing charged-particle tracking in the region
|η | < 2 . 5.1 For the
√ s = 13 TeV run, a fourth layer of the pixel detector, the IBL [29], has been inserted at an average radius of 33 . 2 mm, providing an additional position measurement with 8 µ m resolution in
1ATLAS uses a right-handed coordinate system with its origin at the nominal interaction point (IP) in the centre of the detector and thez-axis along the beam pipe. The x-axis points from the IP to the centre of the LHC ring, and the y-axis points upwards. Cylindrical coordinates(r, φ) are used in the transverse plane, φbeing the azimuthal angle around the z-axis.
The pseudorapidity is defined in terms of the polar angleθasη =−ln tan(θ/2). Angular distance is measured in units of
Figure 1: Example of production diagram of gluinos and subsequent decay to a final state with a photon, jets, and missing transverse momentum (GGM).
the ( x, y) plane and 40 µ m along z . The EM calorimeter (ECAL) uses lead as the absorber and liquid argon (LAr) as the active material. In the central rapidity region, the EM calorimeter is divided into three longitudinal layers, one of them segmented in highly granular η strips for optimal γ / π
0separation, and augmented by a presampler layer for |η | < 1 . 8. Hadron calorimetry is based on different detector technologies, with scintillator tiles ( |η| < 1 . 7) or LAr (1 . 5 < |η| < 4 . 9) as the active medium, and with steel, copper, or tungsten as the absorber material. The MS consists of superconducting air-core toroids, a system of trigger chambers covering the range |η | < 2 . 4, and high-precision tracking chambers allowing muon momentum measurements for |η | < 2 . 7. ATLAS uses a two-level trigger system to select events [30]. A low-level hardware trigger is implemented in custom electronics and reduces the incoming data rate to a design value of ∼ 100 kHz using a subset of detector information. A high-level software trigger selects interesting final state events with software algorithms accessing the full detector information.
3. Monte Carlo simulated samples
Samples of the expected SUSY signals and SM backgrounds were simulated using dedicated Monte Carlo (MC) generators at
√ s = 13 TeV. All samples were passed through a GEANT4-based full simulation [31]
of the ATLAS detector, and reconstructed with the same algorithms used for the data. An event-by-event reweighting is applied to all MC samples to model the realistic machine conditions of the data sample under study, by matching the simulated distribution of the number of inelastic pp collisions per bunch crossing (pile-up) to the one observed in data.
The simulations are further corrected with efficiency scale factors and an additional smearing of the energy scale of photons, leptons and jets, to better describe the data.
The present analysis is motivated by signatures of the bino-higgsino admixture neutralino decay predicted by General Gauge Mediation models, namely a final-state signature that consists of at least one photon, jets, and high E
missT
. The bino component of the lightest neutralino couples to both the photon and the
∆R≡
q(∆η)2+(∆φ)2.
Z boson. The gluino is regarded as the only relevant coloured sparticle in order to set a conservative limit on the gluino mass. The signal cross sections are calculated to next-to-leading order in the strong coupling constant, adding the resummation of soft gluon emission at next-to-leading-logarithmic accuracy (NLO+NLL) [32–36]. The nominal cross section and its uncertainty are taken from an envelope of cross section predictions using different parton density function (PDF) sets and factorization and normalization scales, as described in Ref. [37].
Several SM processes can mimic a SUSY signal with photons, jets and missing transverse momentum.
They arise either from events with real photons or from events in which an electron or a jet is misidentified as a photon. The former source is expected to receive contributions from events in which a W or Z boson or a t¯ t pair is produced in association with at least one real photon, with neutrinos in the subsequent weak decays providing significant E
missT
. These sources of background are denoted Wγ , W γγ , Z γ , Zγγ and t tγ ¯ background. Events with real photons can also contribute to the background when significant E
missT
arises from instrumental sources. The W γ , t tγ ¯ and γ +jets backgrounds are estimated by scaling a corresponding MC sample to match the observed event count in a corresponding control regions (CRs) enriched in the given background process but otherwise kinematically similar to the corresponding signal region (SR). Smaller contributions from γγ , W γγ , Z γ and Z γγ are estimated directly from MC simulations.
The contamination from fake photon backgrounds due to electron and jet misidentification arising from W +jets, Z +jets, t t ¯ or multijets events are estimated in a data-driven way, as discussed in Section 6. Table 1 summarizes the main sources of background.
Table 1: SM processes contributing to the background.
Real E
missT
Instrumental E
missT
Real photon Z (→ νν) γ , Z γγ , W γ , W γγ
t¯ tγ γ +jets, γγ e /jet fakes W +jets, Z (→ νν) +jets
t t ¯ , dibosons Multijet, Z ( → ll )+jets
The production of Wγ , W γγ , Zγ , Z γγ , γγ and γ + jets was simulated using SHERPA 2.2.1 [38]. Matrix elements were calculated for up to four partons at LO and merged with the SHERPA parton shower [39]
using the MEPS@LO prescription [40]. The CT10 PDF set [41] was used in conjunction with a dedicated parton shower tuning developed by the SHERPA authors.
Samples of t¯ tγ events were generated with MG5_aMC@NLO [42] at leading order interfaced to the Pythia 8.186 parton shower model [43].
4. Object selection
The data sample was collected by making use of a single photon trigger, which selects events with at least one photon passing loose identification criteria on its electromagnetic shower shape [44] and with a transverse momentum threshold of 120 GeV (in 2015) and 140 GeV (in 2016). Events are removed from the data sample if they contain jets likely to be produced by beam backgrounds, cosmic rays or detector noise.
Photon, lepton and jet candidates are selected with some baseline requirements as described in the
following. After the initial selection, an overlap removal is applied to deal with the case of a same
particle being reconstructed as different objects by the detector. The missing transverse momentum is then computed from the baseline objects that pass the overlap removal. Finally, photon, lepton and jet candidates used to define the different control, validation and signal regions are required to fulfil extra requirements and are denoted “signal-region candidates” in the following.
In the offline selection, photon candidates are required to pass the tight identification criteria on the lateral and longitudinal shower shape, have a p
Tgreater than 25 GeV, and are removed if they are within the ECAL barrel-endcap transition region defined by 1 . 37 < |η | < 1 . 52. An extra requirement of p
T> 75 GeV is required for signal-region photons. To reduce the background from jets faking photons, a transverse isolation energy ( E
isoT
) requirement is further applied to signal-region photon candidates. The isolation energy is computed as the sum of the topological cluster transverse energies (calibrated at the electromagnetic scale) within an η − φ cone of radius ∆R = 0 . 4 around the photon candidate. This E
isoT
is required to be less than 2.45 GeV + 0.022 × p
T.
Electron candidates are required to have a p
T> 10 GeV, |η | < 2 . 47 and to originate from the primary vertex in both the r – z and r – φ planes. A loose set of identification criteria is imposed [45], which is based on the characteristics of the EM shower development, the quality of the associated reconstructed track, and the closeness between the track and the calorimeter deposition. Signal-region electrons are further required to satisfy calorimeter-based and track-based isolation criteria. The calorimeter-based isolation relies on the ratio of the total energy deposited in a cone of size ∆R = 0 . 2 centred at the electron cluster barycentre to the electron E
T. Likewise, the track-based isolation relies on the ratio of the scalar sum of transverse momenta of tracks within a cone of size ∆R = 10 GeV /p
Tto the transverse momentum of the electron track. Additionally signal-region electrons are required to have p
T> 25 GeV and |η | < 2 . 37, excluding the ECAL barrel-endcap transition region.
Muon candidates are reconstructed by a combination of the track information from the Muon Spectrometer and the Inner Detector [46]. Muon candidates are required to have p
T> 10 GeV and | η| < 2 . 7, and to originate from the primary vertex in both the r – z and r – φ planes. Signal-region muons are then selected with p
T> 25 GeV and satisfying an isolation requirement similar to electrons.
Jets are reconstructed using the anti- k
talgorithm [47] with a distance parameter R = 0.4 (in η − φ space) and are seeded by topological clusters of calorimeter cells [48]. The expected average energy contribution from pile-up clusters is subtracted using a factor that depends on the jet area. Track-based selection requirements are applied to reject jets with p
T< 60 GeV and |η | < 2.4 that originate from pile-up interactions [49]. Except for the E
missT
computation and event cleaning, where no η requirement is applied, jets are kept only if they are in the central region of the detector ( | η| < 2 . 8) and with p
T> 20 GeV [50].
Signal-region jets are selected with p
T> 30 GeV and |η| < 2 . 5.
Although b -jets are not explicitly used for the analysis selection, they are useful in the definition of control regions from which the W + γ and t¯ tγ MC normalization is extracted, as described in Section 5.
These b -jets are identified using an algorithm based on the long lifetime, high decay multiplicity, hard fragmentation and large mass of b -hadrons compared to light quarks and gluons [51]. The b -tagging algorithm has a nominal efficiency of 77% for b -jets [52].
Due to final-state object misidentification, a single object can be reconstructed as more than one object, being therefore effectively counted multiple times. A procedure to remove these overlaps is applied [53]
on pre-selected objects before the corresponding isolation requirements are imposed.
Missing transverse momentum is calculated with an object-based algorithm [54]. Calorimeter energy
deposits are associated to high- p
Tobjects in the following order: electrons, photons, jets and muons.
Deposits not associated with any such objects are included in the so-called Soft Term [55, 56] contribution to E
missT
. The E
missT
is calculated as the sum of the following terms:
( E
missT
)
x(y)= ( E
missT
)
ex(y)+ (E
Tmiss)
γx(y)+ (E
Tmiss)
jetx(y)+ (E
Tmiss)
xµ(y)+ (E
Tmiss)
Soft Termx(y), (1) where each term is computed from the negative sum of calibrated reconstructed objects in the respective category.
5. Event selection
The analysis is designed to compare the event yields observed in two signal regions, SR
Land SR
H, with the Standard Model predictions. The first signal region is optimized for high mass gluino and a low/intermediate mass neutralino, i.e. large mass differences between the gluino and the neutralino. It is characterized by large jet multiplicity and hadronic activity but moderate missing energy. The second signal region targets the more compressed scenarios, where the gluino and neutralino masses are close to each other. This results in lower jet multiplicity and hadronic activity, while producing hard photons and high E
missT
in the final state.
The selection criteria for SR
Land SR
Hare given in Table 2, and the selection variables are described and motivated in what follows. Given the high mass of the gluinos produced in the GGM model-space explored in this analysis, the total visible transverse energy is expected to be large. This results in a large value for the variable H
T, defined as the scalar sum of the transverse momentum of all individual signal jets and the leading photon in the final state. The selection of signal events includes a requirement on m
eff, defined as the scalar sum of H
Tand E
missT
. In both SRs events are required to contain at least one photon and zero leptons. In addition, more than four jets are required in SR
Lwhile more than two jets are required in SR
H.
In events characterized by large fake E
missT
, the missing transverse momentum vector tends to be aligned with either the photon or one of the two leading jets. A selection based on the angular separation between these objects and the E
missT
vector ( ∆ φ( jet , E
missT
) and ∆ φ(γ, E
missT
) ) provides a large suppression of these background processes.
The variable R
4T
(eq. 2) is the ratio of the scalar sum of p
Tfor the four highest- p
Tjets, and the scalar sum of p
Tfor all jets in the event:
R
4T
= P
4i=1
p
iT
P
jets
p
jT
. (2)
SUSY signals considered in this analysis are characterized by hard multijet events in a wide region of parameter space. Even more, the sub-leading jets are comparatively harder than those in SM background events. As a consequence, for signal processes with hard jets, R
4T
usually takes values lower than one, while for SM background with fewer and softer jets, R
4T
is typically closer to unity.
The event selection for both signal regions is summarized in Table 2.
The selection criteria are optimized so as to cover large regions of the GMSB parameter space and ensure
a relatively smooth efficiency distribution over the parameter space explored.
Table 2: Final selection for both SRLand SRHregions.
SR
LSR
HN
photons> 0 > 0
p
leading−γT
> 145 GeV > 400 GeV
N
leptons0 0
N
jets> 4 > 2
∆ φ( jet , E
missT
) > 0 . 4 > 0 . 4
∆φ(γ, E
missT
) > 0 . 4 > 0 . 4
E
missT
> 200 GeV > 400 GeV m
eff> 2000 GeV > 2000 GeV R
4T
< 0 . 90 -
Three control regions (CRs) are associated with each SR. The CRs are labeled CRW, CRT, and CRQ, and are used to determine the MC normalization for the Wγ , t¯ tγ , and QCD γ + jets events, respectively. The selection criteria for the CRs associated with the SRs are presented in Table 3. The dedicated selection for CRQ is defined from the corresponding SR but applying a low E
missT
requirement ( < 50 GeV), and a looser m
effselection applied to increase the size of the control sample for SR
L. The CRW and CRT samples are enriched in W γ and t¯ tγ events, respectively. The CRW sample is defined by requiring a photon, a lepton and 100 GeV < E
missT
< 200 GeV. A b -jet veto requirement is applied to reduce the contamination from t tγ ¯ . The CRT sample is defined by requiring a photon, a lepton, jets and 50 GeV < E
missT
< 200 GeV.
More than one b -tagged jet is required in CRT to enhance the population of t¯ tγ events. Looser E
missT
requirements are also applied in both cases to increase statistics. No R
4T
requirement is applied for the same reason. A maximum E
missT
requirement is applied to reduce the signal contamination.
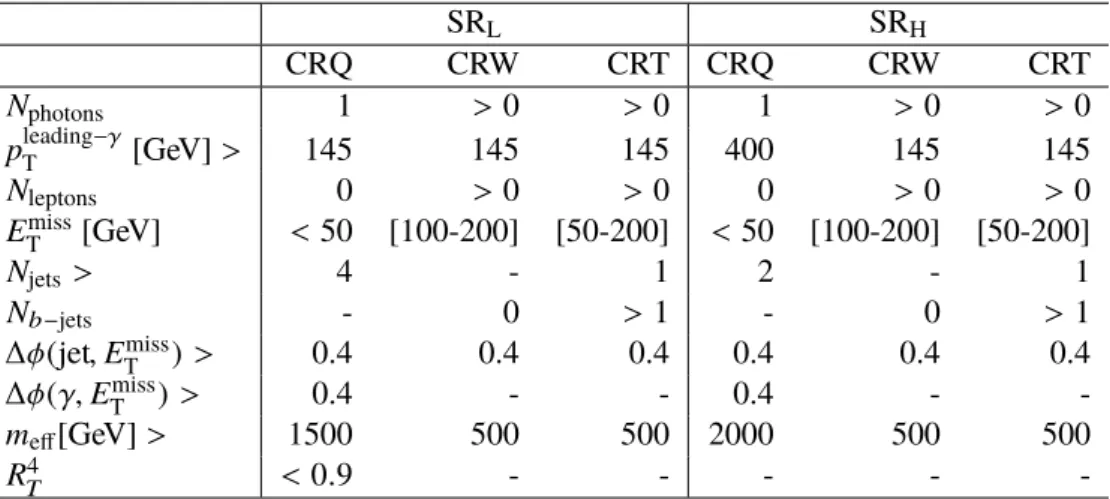
Table 3: Selection criteria (based on signal objects) for the control regions associated with the signal regions. Note that the selection for CRW and CRT are the same for both signal regions.
SR
LSR
HCRQ CRW CRT CRQ CRW CRT
N
photons1 > 0 > 0 1 > 0 > 0
p
leading−γT
[GeV] > 145 145 145 400 145 145
N
leptons0 > 0 > 0 0 > 0 > 0
E
missT
[GeV] < 50 [100-200] [50-200] < 50 [100-200] [50-200]
N
jets> 4 - 1 2 - 1
N
b−jets- 0 > 1 - 0 > 1
∆φ(jet , E
missT
) > 0.4 0.4 0.4 0.4 0.4 0.4
∆φ(γ, E
missT
) > 0.4 - - 0.4 - -
m
eff[GeV] > 1500 500 500 2000 500 500
R
4T< 0 . 9 - - - - -
A further set of event selections (Validation Regions, VRs) are used to check the results of the background
estimation procedure. They were designed to be kinematically similar to the signal region, but with one or
more criteria inverted or modified to reduce a possible signal contamination. VRL regions are designed to
enrich the W γ and t¯ tγ backgrounds, while VRM and VRD regions are used to validate the extrapolation
of the γ + jets background from the CR to the SR. A good agreement between the background prediction
and the observed yields in all VRs was observed.
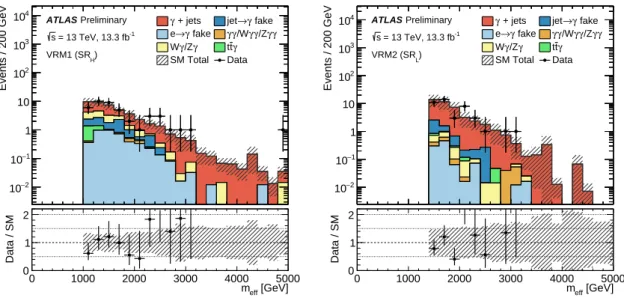
As example, the m
effdistributions in two VRs defined with the same selection as for the SRs but with lower E
missT
values and looser m
effrequirements are shown in Figure 2. VRM1 (SR
H) 2 is defined with m
eff> 1000 GeV and 125 GeV < E
missT
< 175 GeV while VRM2 (SR
L) corresponds to m
eff> 1500 GeV and 75 GeV < E
missT
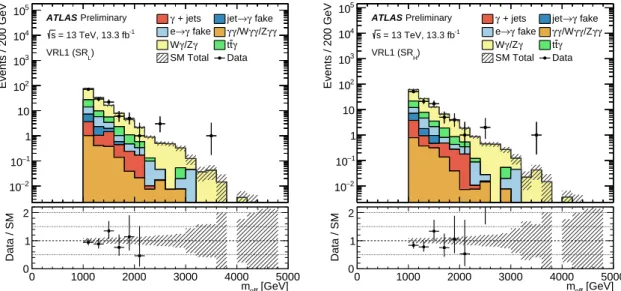
< 175 GeV. Another VR, named VRL1, is defined to enhance Wγ and t¯ tγ with the same selection as the SR but requiring at least one lepton, E
missT
< 200 GeV and m
eff> 1000 GeV. The distributions of m
effin VRL1 for both SR
Land SR
Hare shown in Figure 3.
Events / 200 GeV
−2
10
−1
10 1 10 102
103
104 γ + jets jet→γ fake
fake γ
→
e γγ/Wγγ/Zγγ γ
γ/Z
W ttγ
SM Total Data Preliminary
ATLAS
= 13 TeV, 13.3 fb-1
s
H) VRM1 (SR
[GeV]
meff
0 1000 2000 3000 4000 5000
Data / SM
0 1 2
Events / 200 GeV
−2
10
−1
10 1 10 102
103
104 γ + jets jet→γ fake
fake γ
→
e γγ/Wγγ/Zγγ γ
γ/Z
W ttγ
SM Total Data Preliminary
ATLAS
= 13 TeV, 13.3 fb-1
s
L) VRM2 (SR
[GeV]
meff
0 1000 2000 3000 4000 5000
Data / SM
0 1 2
Figure 2: Observedmeff distributions in the validation regions VRM1 (left) and VRM2 (right) associated with SRHand SRLrespectively, after the background-only fit. Uncertainties are shown as hatched bands for the various expected sources of SM background (statistical only) and error bars for data. The lower panels show the ratio between the data and the SM prediction.
6. Background estimation
The dominant SM background contributions to the SRs are expected to be the Wγ and t¯ tγ production, followed by prompt photon production with fake E
missT
. These three contributions are determined by a MC normalization in each CR, as described in previous section. The smaller background sources, W γγ , Zγ , Zγγ and γγ , are obtained directly from MC.
The backgrounds with fake photons from electrons and jets are determined with the data-driven techniques described in the following. Jets can be misidentified as photons (fake photons) if they contain a π
0that carries most of the jet energy and decays to a pair of collimated photon. This background primarily arises from QCD multijets, W +jets and semi-leptonic t¯ t events. As the jet-to-photon misidentification rate is not expected to be accurately modeled in MC, a data-driven determination has been used. The so-called ABCD method makes use of the different isolation profiles expected for real and fake photons as described in Ref.
[44]. The method implemented in this analysis is based on the one applied in Ref. [53], but extracted with a different photon selection. Following the description in Ref. [53], the jet-faking-photon background is enriched by using an inverted isolation requirement defined in Section 4, so as to be non-isolated.
2A few VRs were designed for each set with different requirements, indicated by the number in the name.
Events / 200 GeV
−2
10
−1
10 1 10 102
103
104
105
+ jets
γ jet→γ fake fake
γ
→
e γγ/Wγγ/Zγγ γ
γ/Z
W ttγ
SM Total Data Preliminary
ATLAS
= 13 TeV, 13.3 fb-1
s
L) VRL1 (SR
[GeV]
meff
0 1000 2000 3000 4000 5000
Data / SM
0 1 2
Events / 200 GeV
−2
10
−1
10 1 10 102
103
104
105
+ jets
γ jet→γ fake fake
γ
→
e γγ/Wγγ/Zγγ γ
γ/Z
W ttγ
SM Total Data Preliminary
ATLAS
= 13 TeV, 13.3 fb-1
s
H) VRL1 (SR
[GeV]
meff
0 1000 2000 3000 4000 5000
Data / SM
0 1 2
Figure 3: Observedmeff distributions in the validation region VRL1 associated with SRL (left) and SRH (right) after the background-only fit. Uncertainties are shown as hatched bands for the various expected sources of SM background (statistical only) and error bars for data. The lower panels show the ratio between the data and the SM prediction.
The relative probability of an energy cluster being reconstructed as an isolated, rather than non-isolated, photon is called the photon-isolation fake factor, and is measured in an orthogonal “non-tight” sample of photons. The selection of this sample requires that all the tight photon identification requirements be satisfied, with the exception that at least one of the requirements on the calorimeter variables defined only with the first (strip) layer of the electromagnetic calorimeter fails. This leads to a sample enriched in identified (non-tight) photon candidates that are mostly π
0decays within jets. The correlation between the E
isoT
and the photon identification requirements was found to be small. The fake factors depend upon p
Tand η , and vary between 10% and 15%. The jet-faking-photon background is then estimated by weighting events with non-isolated photons by the applicable photon-isolation fake factor.
A significant background from SM processes such as W/Z + jets and t¯ t events is expected in cases where one high- p
Telectron is misidentified as a photon. The electron-to-photon fake rate is obtained from the yields of Z (→ ee ) decays reconstructed as e
+e
−or eγ [53]. This background is then estimated by weighting the number of electron events observed in an electron control sample by the electron-to-photon fake rate. This electron sample is obtained by inverting the roles of photons and electrons in the signal region selection, a high- p
Tisolated electron is requested, and signal photons are vetoed.
7. Systematic uncertainties
Systematic uncertainties affect all background processes estimated by making use of the MC and the
signal predictions. The systematic uncertainties originate from two kinds of sources: experimental and
theoretical ones. These systematic uncertainties can impact the expected event yields in both the control
and signal regions.
The preliminary uncertainty on the combined 2015+2016 integrated luminosity is 2.9%. It is derived, following a methodology similar to that detailed in Refs. [57], from a preliminary calibration of the luminosity scale using x – y beam-separation scans performed in August 2015 and May 2016.
Photon identification uncertainties are estimated from the effect of differences between shower-shape variable distributions in data and simulation. From the studies done in Ref. [58], this procedure is found to provide a conservative estimate of the uncertainties. The same conclusion is found for studies performed with 2015 data [59]. The photon energy scale is determined using samples of Z → ee and J/ψ → ee events [60]. For electrons [61] and muons [46], similar to photons, the uncertainty for the identification efficiency, energy scale and resolution are determined from Z → l
+l
−and J/ψ → l
+l
−and W
±→ l
±ν control samples. For jets, the energy scale and resolution uncertainties are derived following the procedure described in Refs. [56] and [62]. For E
missT
, the uncertainties of all underlying objects from which it is constructed are propagated to the calculation and additional uncertainties on the Soft Term contribution are included.
The total theoretical uncertainty for the signal model is taken from an envelope of the cross section pre- dictions using different PDF sets and factorisation and renormalisation scales, as described in Ref. [37].
The theoretical uncertainty for t¯ tγ and W γ production associated to the choice of the MC simulation is assessed by considering variations of the event generation with respect to the default setting taking into account different families of PDFs and uncertainties [63].
For prompt photon production a uncertainty is assessed by comparing the yields for the nominal SHERPA sample to variation samples generated changing the renormalization, factorization, resummation and CKKW matching scales at generator level.
Of the other MC backgrounds, the main MC-based background in the signal channels comes from Zγ events, for which a normalization uncertainty is conservatively set to 100%.
8. Results
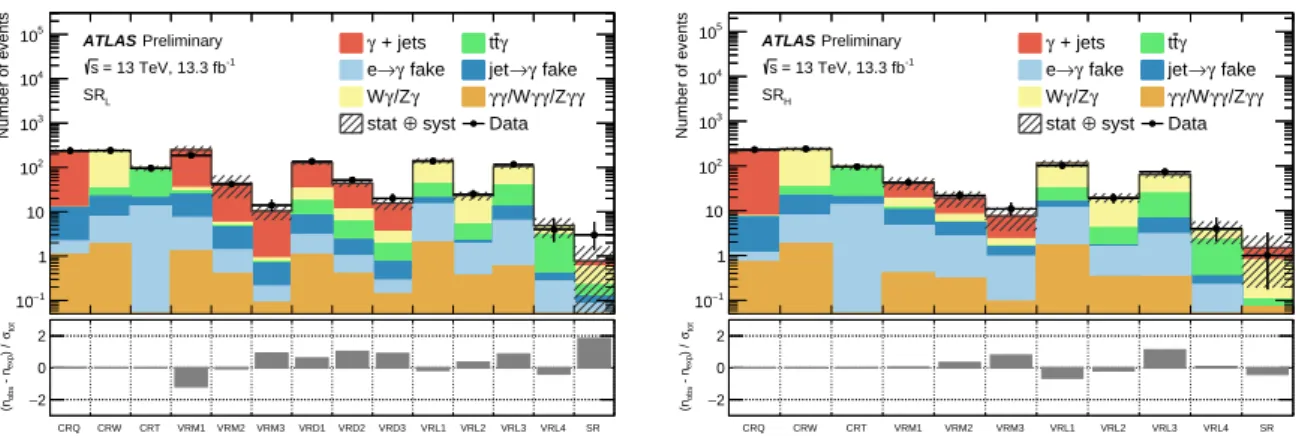
Figure 4 shows a summary of the results in all different control, validation and signal regions together with the corresponding pull distributions. A good agreement is found between data and SM background predictions in the validation regions, and no significant excess exists in the signal region.
The compatibility of the observed number of events with the Standard Model, the limits expected on the visible cross sections, and the exclusion limits are assessed with a profile log likelihood ratio (LLR) approach [64]. The profile LLR is obtained from a simultaneous fit to the contributions from Standard Model and supersymmetric model signals in a given signal region and its associated background control regions, which are all by design statistically independent. The fit is based on the SRs and CRs listed in Table 2 and 3 and it takes into account all the systematic uncertainties discussed in Section 7. When fitting the CRs simultaneously, common normalization factors for each of the W γ , t¯ tγ , and QCD γ + jets events are allowed in order to correctly take into account the other background contamination in a given CR.
Experimental systematic uncertainties are correlated across the CRs and the corresponding SR. Sample- dependent theory systematics are uncorrelated. Uncertainties on the background expectations are treated as Gaussian-distributed nuisance parameters in the maximum-likelihood fit.
Table 4 shows the number of observed events and the estimated SM background for the two signal regions
used in this analysis.
CRQ CRW CRT VRM1 VRM2 VRM3 VRD1 VRD2 VRD3 VRL1 VRL2 VRL3 VRL4 SR
Number of events
−1
10 1 10 102
103
104
105 ATLAS Preliminary = 13 TeV, 13.3 fb-1
s SRL
+ jets
γ ttγ
fake γ
→
e jet→γ fake
γ γ/Z
W γγ/Wγγ/Zγγ syst
⊕
stat Data
CRQ CRW CRT VRM1 VRM2 VRM3 VRD1 VRD2 VRD3 VRL1 VRL2 VRL3 VRL4 SR totσ) / exp - nobs(n 2−
0
2 CRQ CRW CRT VRM1 VRM2 VRM3 VRL1 VRL2 VRL3 VRL4 SR
Number of events
−1
10 1 10 102
103
104
105 ATLAS Preliminary = 13 TeV, 13.3 fb-1
s SRH
+ jets
γ ttγ
fake γ
→
e jet→γ fake
γ γ/Z
W γγ/Wγγ/Zγγ syst
⊕
stat Data
CRQ CRW CRT VRM1 VRM2 VRM3 VRL1 VRL2 VRL3 VRL4 SR
totσ) / exp - nobs(n 2−
0 2
Figure 4: The observed and expected yields in the control, validation and signal regions targeting a low-mass neutralino (SRL, left) and a high-mass neutralino (SRH, right). The lower panel shows the difference in standard deviations between the observed and expected yields (pulls). The pull is calculated from the systematic and statistical uncertainties on the background expectation (σtot).
Table 4: Observed events and background estimates in both SRLand SRHsignal regions in 13.3 fb−1ofppcollisions at
√s=13 TeV.
Signal Region SR
LSR
HObserved events 3 1
Expected SM events 0 . 78 ± 0 . 18 1 . 49 ± 0 . 45 γ + jets 0 . 18 ± 0 . 11 0 . 70 ± 0 . 24 W γ 0 . 30 ± 0 . 07 0 . 37 ± 0 . 09 Z γ 0 . 08 ± 0 . 08 0 . 32 ± 0 . 32 t¯ tγ 0 . 10 ± 0 . 04 0 . 03 ± 0 . 01 e → γ fakes 0 . 07 ± 0 . 03 0 . 00 ± 0 . 00 jet → γ fakes 0 . 04 ± 0 . 01 0 . 00 ± 0 . 00
γγ/W γγ/Z γγ 0 . 01 ± 0 . 00 0 . 07 ± 0 . 01
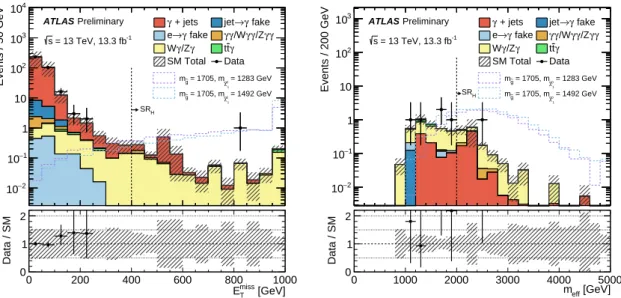
Observed E
missT
and m
effdistributions in the signal regions SR
Land SR
Hare shown in Figures 5 and 6, respectively. The predicted distributions for selected signals with gluino and neutralino masses near the expected sensitivity are also shown for comparison. For each plot, all the SRs selection requirements are applied except the one on the variable being shown.
Based on the number of observed events in the SRs and the background expectation shown in Table 4 , 95% confidence level (CL) upper limits are set for each SR on the number of events from any scenario of physics beyond the SM, using the profile likelihood and CL
sprescriptions [64].
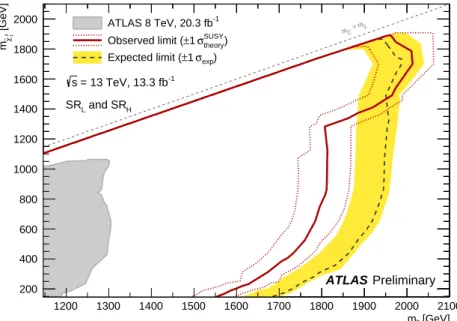
Figure 7 shows the expected and observed limits (using pseudo-data experiments) on the GGM signal model
described in Section 3. As expected, SR
Ldrives the exclusion in the heavy gluino and low/intermediate-
mass neutralino region, while SR
Hcovers the more compressed phase space. A combined exclusion limit
is obtained by using the signal region with the best expected sensitivity at each point. The dashed line in
the figure indicates the expected limit at 95% CL along with its 1 standard deviation ( σ ) range (yellow
Events / 50 GeV
−2
10
−1
10 1 10 102
103
+ jets
γ jet→γ fake fake
γ
→
e γγ/Wγγ/Zγγ γ
γ/Z
W ttγ
SM Total Data = 239 GeV
0 χ∼1
= 1705, m
g~
m
= 652 GeV
0 χ∼1
= 1705, m
g~
m Preliminary
ATLAS
= 13 TeV, 13.3 fb-1
s
SRL
[GeV]
miss
ET
0 200 400 600 800 1000
Data / SM
0 1 2
Events / 200 GeV
−2
10
−1
10 1 10 102
103
+ jets
γ jet→γ fake fake
γ
→
e γγ/Wγγ/Zγγ γ
γ/Z
W ttγ
SM Total Data = 239 GeV
0 χ∼1
= 1705, m
g~
m
= 652 GeV
0 χ∼1
= 1705, m
g~
m Preliminary
ATLAS
= 13 TeV, 13.3 fb-1
s
SRL
[GeV]
meff
0 1000 2000 3000 4000 5000
Data / SM
0 1 2
Figure 5: Observed (points with error bars) and expected background (solid histograms) distributions forEmiss
T (left) andmeff (right) in the signal region SRLafter the background-only fit. The predicted signal distributions for two selected values of the the gluino and neutralino masses are also shown for comparison.
Events / 50 GeV
−2
10
−1
10 1 10 102
103
104
+ jets
γ jet→γ fake fake
γ
→
e γγ/Wγγ/Zγγ γ
γ/Z
W ttγ
SM Total Data = 1283 GeV
0 χ∼1
= 1705, m g~ m
= 1492 GeV
0 χ∼1
= 1705, m g~ m Preliminary
ATLAS
= 13 TeV, 13.3 fb-1
s
SRH
[GeV]
miss
ET
0 200 400 600 800 1000
Data / SM
0 1 2
Events / 200 GeV
−2
10
−1
10 1 10 102
103 γ + jets jet→γ fake
fake γ
→
e γγ/Wγγ/Zγγ γ
γ/Z
W ttγ
SM Total Data = 1283 GeV
0 χ∼1
= 1705, m g~ m
= 1492 GeV
0 χ∼1
= 1705, m g~ m Preliminary
ATLAS
= 13 TeV, 13.3 fb-1
s
SRH
[GeV]
meff
0 1000 2000 3000 4000 5000
Data / SM
0 1 2
Figure 6: Observed (points with error bars) and expected background (solid histograms) distributions forEmiss
T (left) andmeff (right) in the signal region SRHafter the background-only fit. The predicted signal distributions for two selected values of the the gluino and neutralino masses are also shown for comparison.
band). The observed limits (red curves) are shown for the nominal SUSY model cross-section expectation, as well as for a SUSY cross section increased and decreased by one standard deviation of the cross-section systematic uncertainty.
Calculated p -values and model independent limits on the number of events from non-SM processes in
Table 5: Left to right: 95% CL upper limits on the visible cross section (hσi95
obs) and on the number of signal events (S95
obs). The third column (Sexp95) shows the 95% CL upper limit on the number of signal events, given the expected number (and±1σexcursions on the expectation) of background events. The last two columns indicate the CLB
value, i.e. the confidence level observed for the background-only hypothesis, and the discoveryp-value (p(s=0)) together with the equivalent significanceZ.
hσi
95obs
[fb] S
95obs
S
95exp
CL
Bp(s = 0 ) ( Z )
SR
L0 . 48 6 . 4 3 . 7
+1−0..220 . 97 0 . 02 ( 2 . 01 )
SR
H0 . 28 3 . 7 4 . 4
+0−0..990 . 34 0 . 65 ( − 0 . 39)
each SR are listed in Table 5. Also shown is the 95% confidence-level upper limit on the visible cross section, derived by simply dividing the limit in the number of events by the integrated luminosity.
[GeV]
g~
m
1200 1300 1400 1500 1600 1700 1800 1900 2000 2100
[GeV]01χ∼m
200 400 600 800 1000 1200 1400 1600 1800 2000
g~ > m
0 χ∼1
m
= 13 TeV, 13.3 fb-1
s
Preliminary ATLAS
and SRH
SRL
ATLAS 8 TeV, 20.3 fb-1 theory) σSUSY
±1 Observed limit (
exp) σ
±1 Expected limit (
Figure 7: Observed and expected exclusion limit at 95% CL for SRLand SRHanalyses using the signal region with the best expected sensitivity at each point, for 2015+2016 data corresponding to an integrated luminosity of 13.3 fb−1.
9. Conclusion
A search for the experimental signature of isolated high- p
Tphotons, jets and high missing transverse momentum has been performed using 13.3 fb
−1of pp collision data at
√ s = 13 TeV produced by the LHC and collected by the ATLAS detector in 2015 and 2016.
Two different signal regions, SR
Land SR
H, were designed for the present search. SR
Lis optimized for
high mass gluino and a low/intermediate mass neutralino and SR
Htargets those scenarios where the gluino
and neutralino masses are close to each other. Three events are observed in SR
Land one event in SR
H,
where the estimated SM background are 0 . 78 and 1 . 49, respectively. Within the statistical and systematic uncertainties, the observed results are consistent with the Standard Model.
In a GGM scenario with a NLSP neutralino that is a mixture of higgsino and bino, a lower limit is set
on the mass of a degenerate octet of gluino states of 1800 GeV for a large range of neutralino masses,
increasing to 2000 GeV in the case of a high mass neutralino.
Appendix
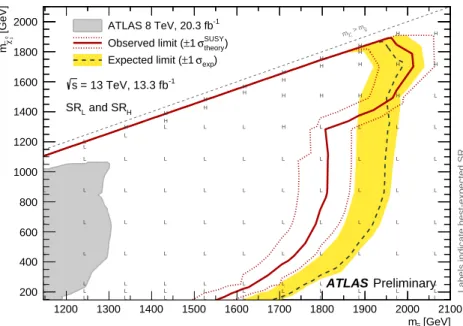
A. Best-expected signal region
The exclusion limit in the signal model is shown in Figure 8 with labels indicating the best-expected SR for each signal point.
[GeV]
g~
m
1200 1300 1400 1500 1600 1700 1800 1900 2000 2100
[GeV]01χ∼m
200 400 600 800 1000 1200 1400 1600 1800 2000
g~ > m
0 χ∼1
m
= 13 TeV, 13.3 fb-1
s
Preliminary ATLAS
and SRH
SRL
Labels indicate best-expected SR
ATLAS 8 TeV, 20.3 fb-1 theory) σSUSY
±1 Observed limit (
exp) σ
±1 Expected limit (
H
L
L
H
L H
L L
H
L
L
L L
H
L
L
L
L
L
L L
L L
L
H
H
H
L L
H
L
L L
L
L
H
L
L L
L L H
L
L L
L
L
L L
L L
L L
L L
L L
H
L L
L L
L L
H
L L
L L
L
L L
L
L
L
L L L
H H
H
L L
H
L L
L H
L L
L
L L
L
L H
H H
L
L L
L L
L
L L
L
L H
L
H
L
Figure 8: Observed and expected exclusion limit at 95% CL for SRL and SRH analyses using the signal region with the best expected sensitivity at each point, for 2015+2016 data corresponding to an integrated luminosity of 13.3 fb−1. The labels indicate the best-expected signal region for each point, where L and H mean SRLand SRH
selections, respectively.
References
[1] ATLAS Collaboration, Search for photonic signatures of gauge-mediated supersymmetry in 8 TeV pp collisions with the ATLAS detector , Phys. Rev. D 92 (2015) 072001,
arXiv: 1507.05493 [hep-ex] . [2] Y. A. Gol’fand and E. P. Likhtman,
Extension of the Algebra of Poincare Group Generators and Violation of p Invariance , JETP Lett. 13 (1971) 323, [Pisma Zh.Eksp.Teor.Fiz. 13:452-455,1971].
[3] D. V. Volkov and V. P. Akulov, Is the Neutrino a Goldstone Particle? , Phys. Lett. B 46 (1973) 109.
[4] J. Wess and B. Zumino, Supergauge Transformations in Four-Dimensions , Nucl. Phys. B 70 (1974) 39.
[5] J. Wess and B. Zumino, Supergauge Invariant Extension of Quantum Electrodynamics ,
Nucl. Phys. B 78 (1974) 1.
[6] S. Ferrara and B. Zumino, Supergauge Invariant Yang-Mills Theories , Nucl. Phys. B 79 (1974) 413.
[7] A. Salam and J. A. Strathdee, Supersymmetry and Nonabelian Gauges , Phys. Lett. B 51 (1974) 353.
[8] S. P. Martin, A Supersymmetry primer , (1997), [Adv. Ser. Direct. High Energy Phys.18,1(1998)], arXiv: hep-ph/9709356 [hep-ph] .
[9] M. Dine and W. Fischler,
A Phenomenological Model of Particle Physics Based on Supersymmetry , Phys. Lett. B 110 (1982) 227.
[10] L. Alvarez-Gaume, M. Claudson and M. B. Wise, Low-Energy Supersymmetry , Nucl. Phys. B 207 (1982) 96.
[11] C. R. Nappi and B. A. Ovrut, Supersymmetric Extension of the SU(3) x SU(2) x U(1) Model , Phys. Lett. B 113 (1982) 175.
[12] H. Goldberg, Constraint on the photino mass from cosmology , Phys. Rev. Lett. 50 (1983) 1419.
[13] J. Ellis et al., Supersymmetric relics from the big bang , Nucl. Phys. B 238 (1984) 453.
[14] D0 Collaboration, Search for supersymmetry in di-photon final states at √
s = 1.96 TeV , Phys. Lett. B 659 (2008) 856, arXiv: 0710.3946 [hep-ex] .
[15] V. Buescher et al., Combination of CDF and D0 limits on a gauge mediated SUSY model using diphoton and missing transverse energy channel , (2005), arXiv: hep-ex/0504004 [hep-ex] . [16] ATLAS Collaboration, Search for diphoton events with large missing transverse momentum in
1 fb
−1of 7 TeV proton–proton collision data with the ATLAS detector , Phys. Lett. B 710 (2012) 519, arXiv: 1111.4116 [hep-ex] .
[17] ATLAS Collaboration, Search for supersymmetry in events with photons, bottom quarks, and missing transverse momentum in proton–proton collisions at a centre-of-mass energy of 7 TeV with the ATLAS detector , Phys. Lett. B 719 (2013) 261, arXiv: 1211.1167 [hep-ex] .
[18] ATLAS Collaboration, Search for Diphoton Events with Large Missing Transverse Energy in 7 TeV Proton–Proton Collisions with the ATLAS Detector , Phys. Rev. Lett. 106 (2011) 121803, arXiv: 1012.4272 [hep-ex] .
[19] ATLAS Collaboration, Search for Diphoton Events with Large Missing Transverse Energy with 36 pb
−1of 7 TeV Proton–Proton Collision Data with the ATLAS Detector ,
Eur. Phys. J. C 71 (2011) 1744, arXiv: 1107.0561 [hep-ex] .
[20] ATLAS Collaboration, Search for supersymmetry in events with at least one photon, one lepton, and large missing transverse momentum in proton–proton collision at a center-of-mass energy of 7 TeV with the ATLAS detector , ATLAS-CONF-2012-144, 2012,
url: http://cdsweb.cern.ch/record/1493483 .
[21] CMS Collaboration, Search for Supersymmetry in pp Collisions at √
s = 7 TeV in Events with Two Photons and Missing Transverse Energy , Phys. Rev. Lett. 106 (2011) 211802,
arXiv: 1103.0953 [hep-ex] .
[22] CMS Collaboration, Search for supersymmetry in events with a lepton, a photon, and large missing transverse energy in pp collisions at √
s = 7 TeV , JHEP 1106 (2011) 093,
arXiv: 1105.3152 [hep-ex] .
[23] CMS Collaboration, Search for stealth supersymmetry in events with jets, either photons or leptons, and low missing transverse momentum in pp collisions at 8 TeV ,
Phys. Lett. B 743 (2015) 503, arXiv: 1411.7255 [hep-ex] .
[24] CMS Collaboration, Search for supersymmetry with photons in pp collisions at √
s = 8 TeV , Phys. Rev. D 92 (2015) 072006, arXiv: 1507.02898 [hep-ex] .
[25] ATLAS Collaboration, Summary of the ATLAS experiment’s sensitivity to supersymmetry after LHC Run 1 — interpreted in the phenomenological MSSM , JHEP 1510 (2015) 134,
arXiv: 1508.06608 [hep-ex] .
[26] C. Cheung, A. L. Fitzpatrick and D. Shih, (Extra)ordinary gauge mediation , JHEP 0807 (2008) 054, arXiv: 0710.3585 [hep-ph] .
[27] P. Meade, N. Seiberg and D. Shih, General Gauge Mediation ,
Prog. Theor. Phys. Suppl. 177 (2009) 143, arXiv: 0801.3278 [hep-ph] .
[28] ATLAS Collaboration, The ATLAS Experiment at the CERN Large Hadron Collider , JINST 3 (2008) S08003.
[29] ATLAS Collaboration, ATLAS Insertable B-Layer Technical Design Report , ATLAS-TDR-19, 2010, url: http://cds.cern.ch/record/1291633 ,
ATLAS Insertable B-Layer Technical Design Report Addendum , ATLAS-TDR-19-ADD-1, 2012,
URL