ATLAS-CONF-2016-067 05/07/2017
ATLAS NOTE
ATLAS-CONF-2016-067
8th August 2016
Measurement of fiducial, di ff erential and production cross sections in the H → γγ decay channel with 13.3 fb
−1of 13 TeV
proton-proton collision data with the ATLAS detector
The ATLAS Collaboration
Abstract
This note presents preliminary measurements of the Higgs boson properties measured in the H
→γγdecay channel using 13.3 fb
−1of proton-proton collision data taken at
√s
=13 TeV by the ATLAS experiment at the LHC. Fiducial and differential cross section measurements are presented in a variety of phase space regions and as a function of several kinematic vari- ables. The fiducial cross section is measured to be
σfid =43.2
±14.9 (stat.)
±4.9 (syst.) fb for a Higgs boson of mass 125.09 GeV decaying to two isolated photons that have trans- verse momentum greater than 35% and 25% of the diphoton invariant mass and each with absolute pseudorapidity
|η| <2.37, excluding the region 1.37
< |η| <1.52. The Standard Model prediction for the same fiducial region is 62.8
+−4.43.4fb. Finally, production cross section measurements for a Higgs boson rapidity
|yH| <2.5 and in the full phase space are presen- ted for gluon fusion, vector boson fusion, and Higgs boson production in association with a vector boson or a top-antitop pair. In addition, the signal strength, defined as the ratio of the observed signal yield to the expected signal yield, is measured for the same production processes as well as globally. No significant deviation from the Standard Model expectations is observed.
Changes made on December 1, 2016: fixed mistake in
∆φj jdi
fferential cross section meas-
urement, fixed description of how the background composition is determined and how the
γj
and j j components are derived for background shape studies, fixed invariant mass window
used for the veto of the same-flavor lepton pair in the leptonic t¯ tH category selection, fixed
description of constraint on energy resolution nuisance parameter, added clarification that
the uncertainty due to the choice of the signal model is only applied in the measurement of
the fiducial and di
fferential cross sections, added a clarification to caption of Figure 9, fixed
c
2017 CERN for the benefit of the ATLAS Collaboration.
Reproduction of this article or parts of it is allowed as specified in the CC-BY-4.0 license.
1 Introduction
In July 2012, the ATLAS [1] and CMS [2] experiments announced the discovery of a Higgs boson [3, 4] using proton–proton collision data collected at centre-of-mass energies
√s
=7 TeV and 8 TeV at the CERN Large Hadron Collider (LHC). Subsequent measurements of its properties were found to be con- sistent with the expectation of the Standard Model (SM) Higgs boson [5]. Following the upgrade of the LHC to allow proton-proton collisions at
√s
=13 TeV, it is important to continue these studies and probe the Higgs sector more deeply. The dataset already collected at
√s
=13 TeV allows inclusive Higgs boson measurements to be repeated with similar precision to those done at
√s
=7, 8 TeV. Furthermore, the increased centre-of-mass energy results in much larger cross sections for events at high partonic centre- of-mass energy. This implies improved sensitivity to a variety of interesting physics processes, such as Higgs bosons produced at high transverse momentum or Higgs bosons produced in association with a top-antitop pair.
The Higgs boson decay into two photons (H
→γγ) is a particularly attractive way to study the propertiesof the Higgs boson. Despite the small branching ratio, a reasonably large signal yield can be obtained thanks to the high photon reconstruction and identification e
fficiency at ATLAS. Furthermore, due to the excellent photon energy resolution of the ATLAS calorimeter, the signal manifests itself as a narrow peak in the diphoton invariant mass spectrum on top of a smoothly falling background, and the Higgs boson signal yield can be measured using an appropriate fit.
In this note, we present preliminary results for measurements of Higgs boson properties in the diphoton decay channel using 13.3 fb
−1of pp collision data taken at
√s
=13 TeV. All measurements are per- formed under the assumption that the Higgs boson mass is 125.09
±0.21(stat.)
±0.11(syst.) GeV [6]. The measurements performed are as follows:
1. Fiducial cross sections are measured in a variety of phase space regions sensitive to inclusive Higgs boson production, vector boson fusion production, and Higgs boson production in association with a charged lepton. Differential cross sections are measured as a function of the diphoton transverse momentum
1( p
γγT), the rapidity of the diphoton system (|y
γγ|), the cosine of the angle between thebeam axis and the photons in the Collins–Soper frame [7] of the Higgs boson (|cos
θ∗|), the jetmultiplicity (N
jets), the transverse momentum of the leading jet (p
Tj1), the azimuthal angle between the leading two jets (|
∆φj j|) and the invariant mass of the leading two jets (mj j). The p
γγTand
|yγγ|distributions probe the perturbative-QCD modelling of the gluon fusion production mechanism, which dominates inclusive Higgs boson production. The N
jets, p
Tj1and m
j jdistributions are sens- itive to the di
fferent production mechanisms, with gluon fusion dominating at low jet multiplicity and other production mechanisms becoming increasingly important for events with two-or-more jets. The
|cosθ∗|and
|∆φj j|distributions probe the spin-CP nature of the Higgs boson [8, 9]. The results are compared to state-of-the-art predictions. Fiducial and di
fferential cross sections are the most model-independent measurements of the Higgs boson’s properties and have previously been measured at
√s
=8 TeV in the H
→γγdecay channel by both ATLAS [10] and CMS [11].
2. Simplified template cross sections are measured at so-called ‘stage 0’ [12], which corresponds to a
measurement of the production cross sections for Higgs boson absolute rapidity less than 2.5. They
are measured for gluon fusion, vector boson fusion and Higgs boson production in association with a vector boson (splitting leptonic and hadronic decays of the vector boson) as well as with a top- antitop pair. Simplified template cross sections are designed to measure the di
fferent Higgs boson production processes in specific regions of phase space and in a way that can be combined easily with other decay channels where model-independent measurements are not yet possible. The data is separated into exclusive event categories enriched in specific production processes, as for the signal strength measurements performed during Run-I of the LHC [5]. The measurements presented in this note provide a first step towards more detailed measurements in the simplified template cross section framework.
3. Total production cross sections (extrapolated to the full phase space) are measured for gluon fusion, vector boson fusion and Higgs boson production in association with a vector boson as well as with a top-antitop pair. In addition, measurements of the signal strength, which is the ratio of the measured cross section to the cross section predicted by the SM, are given for the different production processes. They allow easy comparison between measurements at different centre-of- mass energies. The measurements in this note closely follow the strategy used for studies at
√s
=7 and
√s
=8 TeV during Run-I of the LHC [13].
This note is organised as follows. Section 2 provides a brief description of the ATLAS detector, and Sec- tion 3 describes the selected dataset. The Monte Carlo simulations are described in Section 4. Section 5 gives an overview of the object and event selection, and Section 6 explains the signal and background modelling used in the signal measurement. Section 7 builds on the previous sections to describe the measurement of the fiducial and di
fferential cross sections. Similarly, Section 8 describes the measure- ments of the Higgs boson production cross sections and signal strengths. The systematic uncertainties are detailed in Section 9. Section 10 presents the results and Section 11 gives a short summary.
2 ATLAS detector
The ATLAS detector [1] covers almost the entire solid angle about the proton-proton interaction point.
Charged-particle tracks and interaction vertices are reconstructed using information from the silicon pixel detector (including the newly installed insertable B-layer), the silicon microstrip detector, and the trans- ition radiation tracker (TRT), which are collectively referred to as the inner detector. The inner detector has full azimuthal coverage over the pseudorapidity interval
|η|<2.5, and is immersed in a 2 T axial field to allow charged-particle transverse momentum reconstruction. The TRT offers substantial discrimina- tion between electrons and charged hadrons through the detection of transition radiation photons, used for the reconstruction of converted photons and the identification of electrons. During operation, several leaks developed in the TRT exhaust system, leading to a large loss of the xenon gas. In order to reduce the operational cost, several parts of the TRT (internal layer of the barrel TRT and one endcap wheel on each side of the detector in 2015, plus the middle layer of the TRT barrel and three additional endcap wheels in 2016) were operating with argon instead of xenon in the gas mixture.
The energies of photons and electrons are measured in the electromagnetic (EM) liquid-argon sampling
calorimeter, which is split into barrel and end-cap regions that cover
|η| <1.475 and 1.375
< |η| <3.2,
respectively. For
|η| <2.5, the EM calorimeter is divided into three layers, longitudinally in depth. The
first layer has a fine
ηsegmentation in the regions
|η|<1.4 and 1.5
<|η|<2.4 to facilitate the separation of
photons from neutral hadrons and to allow shower directions to be measured. The majority of the photon
and electron energy is deposited in the second layer. In the range of
|η|<1.8 a presampler layer allows for
the correction of energy losses upstream of the calorimeter. The energies of jets are measured in the EM and hadronic calorimeters. The hadronic calorimeter is divided into three sub-regions; the barrel region (|η|
<1.7) consists of active scintillator tiles and steel absorbers, whereas the end-cap (1.5
< |η| <3.2) and forward (3.1
<|η|<4.9) regions are based on liquid-argon technology.
The muon spectrometer comprises separate trigger and precision tracking chambers, with the latter provid- ing muon reconstruction over the region
|η| <2.7. The spectrometer is immersed in the magnetic field provided by three air-core toroids, deflection in which allows the muon momenta to be determined.
3 Dataset
The proton-proton collision data were collected by the ATLAS experiment in 2015 and 2016, with the LHC operating at a centre-of-mass energy of 13 TeV. The analysis only considers events taken during stable beam conditions and when the full detector was operational. After the application of data quality requirements, the dataset amounts to 13.3 fb
−1, of which 3.2 fb
−1were collected in 2015 and 10.1 fb
−1were collected in 2016. The mean number of proton-proton interactions per bunch crossing is 13.7 in the 2015 dataset and 21.6 in the 2016 dataset. The 2015 and 2016 datasets are analysed together and treated as one combined dataset.
The data used in this analysis was selected by a diphoton trigger, which relies on two clusters formed from energy depositions in the electromagnetic calorimeter. In the last step of the trigger chain, the transverse energy of the leading (highest transverse energy) cluster is required to be at least 35 GeV, while the transverse energy of the subleading (next highest transverse energy) cluster is required to be at least 25 GeV. Both clusters are required to fulfill requirements on the shape of the energy deposition to be loosely consistent with that expected from an electromagnetic shower initiated by a photon. The diphoton trigger has an e
fficiency greater than 99% for events that pass the final event selection.
4 Monte Carlo simulation
Higgs boson production via gluon fusion (ggH) is simulated at next-to-leading-order (NLO) accuracy in QCD using the Powheg Box [14–17], with the CT10 parton distribution function (PDF) [18]. The mass and width of the Higgs boson are chosen to be m
H =125 GeV
2and
ΓH =4.07 MeV [19], respectively.
The parton-level events produced by the P
owhegB
oxare passed to P
ythia8 [20] to provide parton shower- ing, hadronisation and multiple parton interactions (MPI), using the AZNLO set of parameters that are tuned to data [21]. The sample is reweighted at the particle-level to reproduce the transverse momentum spectrum predicted by H
res[22] and normalised such that it reproduces the total cross section predicted by a next-to-next-to-next-to-leading-order (N
3LO) QCD calculation with NLO electroweak corrections applied [23–28]. The normalisation of all Higgs boson samples also accounts for the H
→γγbranching ratio calculated with HDECAY [28–30].
Higgs boson production via vector-boson fusion (VBF) is generated to NLO accuracy in QCD using the
P
owhegB
ox[31] with the CT10 PDF. The parton-level events are passed to P
ythia8 to provide parton
showering, hadronisation and MPI, using the AZNLO parameter set. The VBF sample is normalised to an approximate-NNLO QCD cross section with NLO electroweak corrections applied [27, 28, 32–
34]. Higgs boson production in association with a vector boson (ZH, W H) is produced at leading-order (LO) accuracy in QCD as q q ¯
0 →V H using P
ythia8 with the NNPDF2.3LO PDF set [35] and the A14 parameter set [36]. The samples are normalised to cross sections calculated at NNLO in QCD, taking into account the contribution from
gg→ZH, with NLO electroweak corrections [27, 28, 37–39].
Higgs boson production in association with a top-antitop pair (t¯ tH) is produced at NLO accuracy in QCD using MG5_aMC [40] with the NNPDF2.3 PDF and interfaced to P
ythia8 to provide parton showering, hadronisation and MPI, using the A14 parameter set. The t¯ tH sample is normalised to a cross-section calculation accurate to NLO in QCD with NLO electroweak corrections applied [27, 28, 41–44].
Higgs boson production via bottom-quark fusion (b bH) is produced using MG5_aMC interfaced to P ¯
y-
thia8, and is normalised to a cross-section calculation accurate to NNLO in QCD [27, 28, 45, 46]. The sample includes the effect of interference with the gluon fusion production mechanism. Higgs boson production in association with a single top-quark and a W-boson (tHW ) is produced at LO accuracy using MG5_aMC interfaced to H
erwig++[47–49], with the UEEE5 parameter set for MPI. Higgs bo- son production in association with a single top-quark, a b-quark and a light quark (tH jb) is produced at LO accuracy using MG5_aMC interfaced to P
ythia8 using the A14 parameter set. The tHW and tH jb samples are normalised to calculations accurate to NLO in QCD [27, 28, 50].
The particle-level Higgs boson events are passed through a Geant 4 [51, 52] simulation of the ATLAS detector [53] and reconstructed using the same analysis software as used for the data. Additional proton- proton interactions (pileup) are included in the simulation such that the average number of interactions per bunch crossing reproduces that observed in the data. The inelastic proton–proton collisions were produced using P
ythia8 with the A2 parameter set that are tuned to data.
Simulated background samples are used to study the properties of the non-resonant diphoton continuum background. Samples of
γγevents are simulated with up to three additional partons in the final state using the S
herpaevent generator [54], with the CT10 PDF and the generator authors’ default tune for underlying event activity. Vγγ event samples are produced using Sherpa with up to two additional partons in the final state. The large sample size required for the modelling of the
γγbackground processes prevents the use of the full ATLAS detector simulation and a fast simulation model [53] is used. Pileup is again included in the simulations by adding inelastic proton–proton collisions with the average number of interactions per bunch crossing reproducing that observed in the data.
5 Object and event selection
5.1 Photon selection
The reconstruction of photons [55] is seeded by energy clusters in the electromagnetic calorimeter with
transverse energy (E
T) greater than 2.5 GeV in a region of
∆η×∆φ=0.075
×0.125. The reconstruction is
designed to separate electrons, unconverted photons and converted photons, where the latter arise from the
conversion of photons into electron-positron pairs in the detector material. Conversion vertex candidates
are reconstructed from either two tracks consistent with originating from a photon conversion, or one
track that does not have any hits in the innermost pixel layer, and the tracks are required to have an
electron response in the TRT to suppress backgrounds from non-electron tracks. Clusters without any
matching track or conversion vertex are classified as unconverted photon candidates, while clusters with a matching conversion vertex are classified as converted photon candidates.
The photon energy is measured from a cluster size of
∆η×∆φ =0.075×0.175 in the barrel region of the calorimeter and
∆η×∆φ =0.125
×0.125 in the calorimeter endcaps. The photon energy is correc- ted in four steps using a combination of simulation-based and data-driven calibration factors [56]. The simulation-based calibration procedure was reoptimised for the 13 TeV data. Its performance is found to be compatible with that of Run-I [56] in the full pseudorapidity range, and is improved in the barrel- endcap transition region, due to the use of information from additional scintillation detectors in this region [57]. The uniformity corrections and the intercalibration of the longitudinal calorimeter layers are unchanged compared to Run-I [56], and the data-driven calibration factors used to set the absolute energy scale are determined from Z
→e
+e
−events collected during 2015. The photon resolution in simulation is corrected to match the resolution in the data. This correction is derived simultaneously with the energy calibration factors using Z
→e
+e
−events by adjusting the electron energy resolution such that the width of the reconstructed Z peak in simulation matches the width observed in data [57].
The identification of photons [55, 58] is based on the lateral and longitudinal shape of the electromagnetic shower in the calorimeter. Two working points, loose and tight, are defined. Photon candidates are required to deposit only a small fraction of their energy in the hadronic calorimeter and to have a lateral shower shape consistent with that expected from a single electromagnetic shower. The information on the shape of the shower in the high granularity first layer is used to discriminate single photons from hadronic jets in which a neutral meson carries most of the jet energy. The selection requirements are tuned separately for unconverted and converted photon candidates. The impact on the photon identification efficiency from the difference in the converted photon reconstruction between the 2015 and 2016 datasets due to the different TRT gas composition has been studied with simulated samples and shown to be small.
The identification e
fficiency of unconverted (converted) photons ranges from 85% to 95% (88% to 98%) between 25 GeV and 200 GeV. Corrections are applied to the electromagnetic shower shape variables of simulated photons, to account for small differences observed between data and simulation.
To further reject hadronic jet backgrounds, the photon candidates are required to be isolated from any other activity in the calorimeter and the tracking detectors. The calorimeter isolation is computed as the sum of transverse energies of positive-energy topological clusters [59] in the calorimeter within a cone of
∆
R
= p(
∆η)2+(
∆φ)2 =0.2 centered around the photon candidate. The transverse energy of the photon
candidate is removed. The contributions of the underlying event and pileup are subtracted based on the
method suggested in [60]. The track isolation is computed as the scalar sum of the transverse momenta
of all tracks in a cone of
∆R
=0.2 with p
T >1 GeV which pass some loose track quality criteria and
originate from the diphoton primary vertex, i.e. the most likely production vertex of the diphoton pair
(see Sec. 5.2). For converted photon candidates, the tracks associated to the conversion are removed. The
calorimeter (track) isolation is required to be less than 6.5% (5%) of the photon transverse energy. The
efficiency of the calorimeter isolation ranges from 84% to 97% (83% to 97%) for unconverted (converted)
photons between 25 GeV and 200 GeV that pass the identification requirements. The efficiency of the track
isolation ranges from 96% to 100% (93% to 97%) for unconverted (converted) photons between 25 GeV
and 200 GeV that pass the identification and calorimeter isolation requirements.
5.2 Event selection and selection of the diphoton primary vertex
Events are preselected by requiring at least two photon candidates with E
T >25 GeV and
|η| <2.37 (excluding 1.37
< |η| <1.52) that fulfill the loose photon identification criteria [55]. The two photon candidates with the highest E
Tare defined as the diphoton pair and used to identify the ‘diphoton primary vertex’ among all reconstructed vertices, using a neural-network algorithm that is based on track and primary vertex information as well as the two photon directions measured in the calorimeter and inner detector [13]. The neural network algorithm selects a diphoton vertex within 0.3 mm of the true H
→γγproduction vertex in 81% of simulated gluon fusion events. The performance of the neural network algorithm is validated using Z
→e
+e
−events in data and simulation (with the tracks removed from the electron candidates) and good agreement is found. The diphoton primary vertex is used to redefine the direction of the photon candidates, resulting in an improved diphoton invariant mass resolution.
Following the identification of the diphoton vertex, the leading and subleading photon candidates in the diphoton pair are required to have E
T/mγγ >0.35 and 0.25, respectively, and are required to satisfy the tight identification criteria as well as the calorimeter and track isolation requirements. In total, 124137 events are selected with a diphoton invariant mass m
γγbetween 105 GeV and 160 GeV.
5.3 Reconstruction and selection of hadronic jets, b-jets, leptons and missing transverse momentum
Jets are reconstructed using the anti-k
talgorithm [61] with a radius parameter of 0.4. The inputs to the algorithm are three-dimensional topological clusters. The jets are corrected on an event-by-event basis for soft energy deposits originating from pileup [62] and then calibrated using a combination of simulation- based and data-driven correction factors, which correct for calorimeter non-compensation and inactive regions of the calorimeter [63, 64]. Jets are required to have p
T >25 GeV for
|η|<2.4 and p
T >30 GeV for 2.4
<|η|<4.4
3. Jets that do not originate from the diphoton primary vertex are identified using the jet vertex tagging algorithm (JVT) [64] and for jets with p
T <60 GeV and
|η|<2.4 a medium working point is used which has an e
fficiency greater than 92% for non-pileup jets with p
T >30 GeV. The e
fficiency of the JVT algorithm in the simulation is corrected to match that observed in the data. Jets are discarded if they are within
∆R
=0.4 of an isolated photon candidate or within
∆R
=0.2 of an isolated electron candidate.
Jets consistent with the decay of a b-quark are identified using a multivariate discriminant with informa- tion from track impact parameters and secondary vertices as input [65, 66]. The efficiency of identifying jets originating from a b-quark is 70%. Data-driven correction factors are applied to the simulation such that the b-tagging efficiency of jets originating from b-quarks, c-quarks and light-quarks are consistent with that observed in the data.
The reconstruction and calibration of electron candidates proceeds similarly as for photon candidates.
Electromagnetic calorimeter clusters with a matching track in the inner detector are reconstructed as electron candidates and calibrated using dedicated calibration factors. Electron candidates are required to have p
T >10 GeV
4and
|η|<2.47 (excluding 1.37
<|η|<1.52). Electrons must satisfy impact parameter requirements and loose identification criteria [67], which have been retuned for the conditions expected
3The jet selection is tightened topT>30 GeV within|y|<4.4 for the measurement of fiducial and differential cross sections.
4The electron selection is tightened topT>15 GeV for the measurement of fiducial and differential cross sections.
in 2016. Electron candidates are required to pass requirements on the calorimeter and track isolation that have a combined efficiency of 99% over the full p
Trange.
Muon candidates are primarily built from tracks reconstructed in the inner detector and the muon spectro- meter, but are complemented by candidates reconstructed only in the muon spectrometer that are compat- ible with originating from the interaction point [68]. Muon candidates are required to have p
T >10 GeV
5and
|η|<2.7, and pass the ‘medium’ identification criteria. Muon candidates are also required to be isol- ated using a track isolation requirement, which is 99% efficient over the full p
Trange.
The magnitude of the missing transverse momentum E
missTis measured from all photon, electron and muon candidates, all hadronic jets after accounting for overlaps between jets and other objects, as well as an estimate of soft contributions based on tracks originating from the diphoton vertex which pass a set of quality criteria. A full description of this algorithm can be found elsewhere [69, 70]. The E
Tmisssignificance is defined as E
Tmiss/√PE
T, where
PE
Tis the sum of the transverse energies of all objects used in the estimation of the missing transverse momentum.
6 Signal and background modelling of diphoton mass spectrum
The Higgs boson signal is measured through a maximum-likelihood fit to the diphoton invariant mass spectrum in the range 105 GeV< m
γγ <160 GeV for each fiducial region, each bin of a differential dis- tribution, and each event category used in extracting the production cross sections and signal strengths as discussed in Sections 7 and 8. The mass range is chosen to be large enough to allow a reliable de- termination of the background from the data in almost all regions, and at the same time small enough to avoid large uncertainties from the choice of the background parameterisation. The signal and background shapes are modelled as described below, and the background model parameters are freely floated in the fit to the m
γγspectra for almost all regions (exceptions are noted in Section 8.1). The measurement of the background composition is performed for each region.
6.1 Signal model
The Higgs boson signal manifests itself as a narrow peak in the m
γγspectrum. Due to the narrow width
of the Higgs boson, the shape of the distribution is governed by the resolution of the measured photon
energies. The signal distribution is modelled as a double-sided Crystal Ball function centred on the
previously measured Higgs boson mass of m
H =125.09 GeV [6]. The non-Gaussian contributions to
the mass resolution arise mostly from converted photons with at least one electron losing a significant
fraction of its energy through bremsstrahlung in the inner detector material. The parameters of the model
that define the shape of the signal distribution are determined using a fit to a simulated H
→γγsample
(with m
H =125 GeV). The parameterisation is derived separately for each region. In the fits to the data
described in Sections 7.2 and 8.2, the parameters that determine the position and the resolution of the
signal peak are constrained to their expected values within their uncertainties.
[GeV]
γ
mγ
110 120 130 140 150 160
Events / GeV
0 2000 4000
Preliminary ATLAS
= 13 TeV, 13.3 fb-1
s γ γ γ-jet jet-jet Stat. Unc.
Tot. Unc.
[GeV]
γ
mγ
110 120 130 140 150 160
Fraction [%]
0 20 40 60 80 100
Preliminary
ATLAS s = 13 TeV, 13.3 fb-1
γ γ γ-jet jet-jet Stat. Unc.
Tot. Unc.
Figure 1: The data-driven determination of event yields (left) and event fractions (right) forγγ,γjand j jevents as a function ofmγγin the baseline diphoton event selection. The shaded regions show the total uncertainty on the measured yield and fraction, and the error bars show the statistical uncertainties.
6.2 Background composition
The
γγ,γj and j j background composition is studied using a double two-dimensional sideband method [71].
In the signal region, each photon is required to pass the tight photon identification as well as photon isol- ation criteria. Control regions are defined by reversing one or both of these requirements (when the tight identification is reversed, the photon is still required to pass a modified loose identification, which di
ffers from the tight identification by four shower shape variables). The number of events from each background source in each region are related via the photon and jet efficiencies for passing the photon identification and isolation requirements. The small signal leakage into the control regions is obtained from simulation.
The data in the signal and control regions are used to extract the contribution of the different backgrounds in the signal region along with the efficiency for jets to pass the photon isolation requirements. The dominant systematic uncertainties are due to the definition of the background control regions.
The number and relative fraction of the
γγ,γj and j j backgrounds is shown in Figure 1 as a function of m
γγfor the baseline diphoton event selection. The total fraction of each of these background sources is 78.9
±0.2
+−4.01.9%, 18.6
±0.2
+−1.73.5% and 2.5
±0.1
+−0.40.5% respectively, which are comparable to previous results at
√s
=7 and 8 TeV [10,13].
6.3 Background model
The background functional form is chosen, in each region, to minimise the bias observed in the extrac-
ted signal yield [3]. For the majority of regions, the potential bias (or ‘spurious signal’) is estimated by
performing a signal+background fit to a background-only distribution. This is constructed from the
γγsimulated sample. The contributions from
γj, jγ, and j j are included by reweighting the
γγsimulated
sample, with the normalisation of the
γj, jγ, and j j contributions determined using the data-driven back-
ground measurement described in Section 6.2 and the shape of each contribution determined in data by
reversing the photon identification criteria of one or both photon candidates for
γ-jet, jet-γ, and jet-jet,respectively. The di
fferent contributions are normalised according to their relative fractions determined
in the previous section. The spurious signal is required to be less than 10% of the expected signal yield or
less than 20% of the expected statistical uncertainty on the extracted signal yield. In the case when two
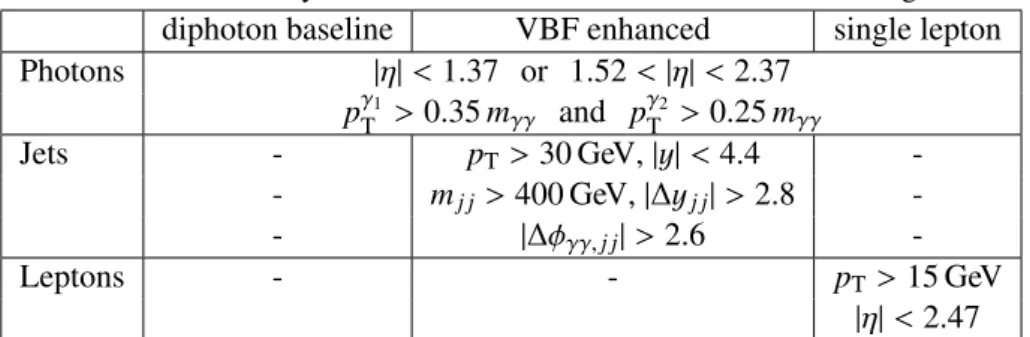
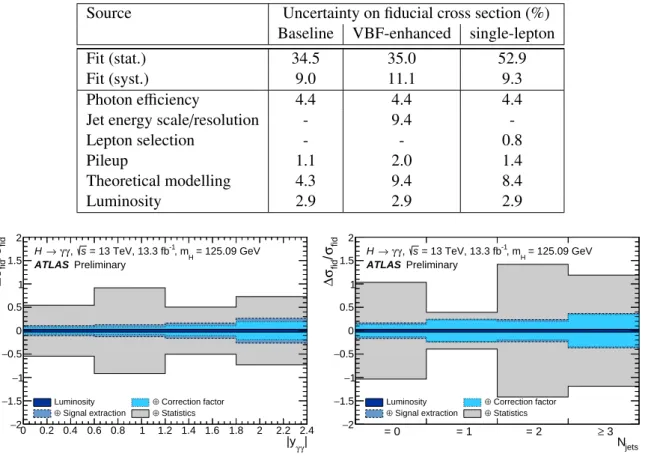
Table 1: The summary of the selection criteria that define the fiducial regions.
diphoton baseline VBF enhanced single lepton Photons
|η|<1.37 or 1.52
<|η|<2.37
p
γT1 >0.35 m
γγand p
γT2 >0.25 m
γγJets - p
T>30 GeV,
|y|<4.4 -
- m
j j >400 GeV,
|∆yj j|>2.8 -
-
|∆φγγ,j j|>2.6 -
Leptons - - p
T >15 GeV
|η|<
2.47
or more functions satisfy those requirements, the background model with the least number of parameters is chosen. The background distribution is found to be well modelled in all regions by the exponential of a first- or second-order polynomial, or by a third- or fourth-order Bernstein polynomial. Exceptions to the procedure above are needed for some event categories and are discussed further in Section 8.1.
7 Measurement of fiducial and di ff erential cross sections
7.1 Definition of fiducial regions and di ff erential distributions
Fiducial and differential cross sections are measured in several phase space regions. For these measure- ments, jets are required to have transverse momentum greater than 30 GeV and
|y|<4.4, and electron and muon candidates are required to have transverse momentum greater than 15 GeV.
Three fiducial phase space regions are defined by the criteria shown in Table 1, they are:
1. Diphoton baseline: The diphoton event selection presented in Section 5.
2. VBF-enhanced: The baseline selection plus at least two jets that have m
j j >400 GeV,
∆yj j >2.8, and
∆φγγ,j j >2.6, where m
j jis the invariant mass of the dijet system,
∆yj jis the separation of the two jets in rapidity,
∆φγγ,j jis the azimuthal angle between the dijet and the diphoton systems, and the quantities are computed using the two highest transverse momentum jets in the event.
3. Single-lepton: The baseline selection plus at least one charged lepton. This region is mainly sens- itive to the V H production mechanism.
Di
fferential cross sections are measured in bins of the diphoton transverse momentum, the rapidity of the
diphoton system, the cosine of the angle between the beam axis and the photons in the Collins–Soper
frame, the jet multiplicity, the transverse momentum of the leading jet for events with at least one jet
(H
+1jet events), and the azimuthal angle between the leading two jets and the invariant mass of the
leading two jets in events with at least two jets (H
+2jet events). The binning in each variable is chosen
such that each bin has similar expected signal significance.
m_yy
110 120 130 140 150 160
Events / GeV
0 1000 2000 3000 4000 5000
6000 ATLASPreliminary
Inclusive = 13 TeV, 13.3 fb-1 s
= 125.09 GeV , mH
γ γ
→ H Data
Background Signal + background Signal
[GeV]
γ
mγ
110 120 130 140 150 160
data - bkg 200−
0
200 m_yy
110 120 130 140 150 160
Events / GeV
0 20 40 60 80
100 ATLASPreliminary
VBF-enhanced = 13 TeV, 13.3 fb-1 s
= 125.09 GeV , mH
γ γ
→ H Data
Background Signal + background Signal
[GeV]
γ
mγ
110 120 130 140 150 160
data - bkg 20−
0 20
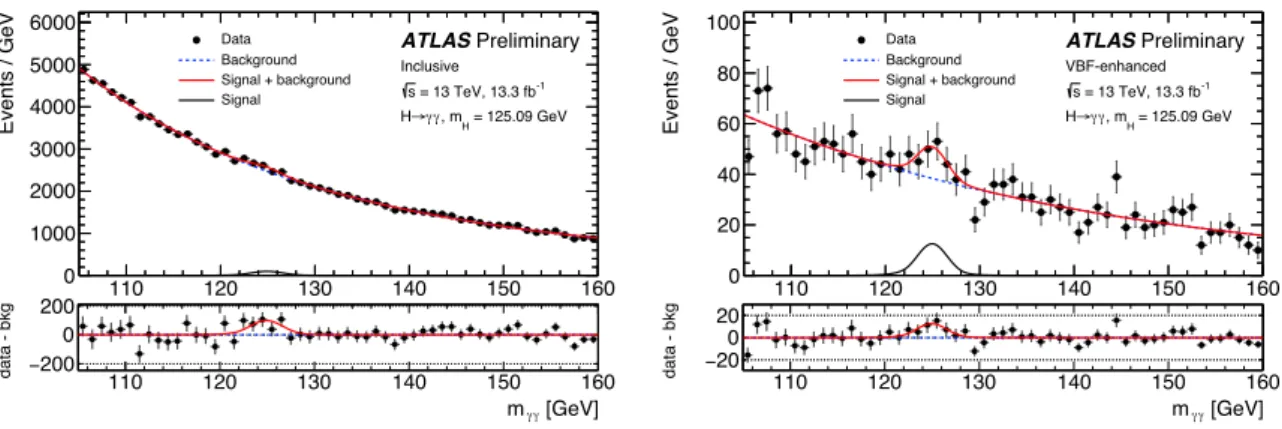
Figure 2: The diphoton invariant mass spectrum for the diphoton baseline (left) and VBF-enhanced (right) phase space regions. The dashed blue line shows the background-only prediction, the solid red line is the result of the combined signal and background fit to the data, and the black line shows the signal component. The bottom inset displays the residuals of the data with respect to the fitted background component (bkg).
7.2 Extracting the signal yields
An unbinned maximum likelihood fit is performed on the m
γγspectrum in each fiducial region or bin of a differential distribution. The likelihood function,
L, is given byL=Y
i
e
−νin
i!
ni
Y
j
hνsigi Fisig
(m
γγj , θ;m
H)
+νbkgi Fibkg(m
γγj)
i
× Y
l
G
l(θ) (1)
where i labels the regions or bins being simultaneously fitted,
νsigiis the fitted number of signal events,
νbkgiis the fitted number of background events,
νi = νsigi + νbkgiis the mean value of the underlying Poisson distribution for the n
ievents, m
γγjis the diphoton invariant mass for event j,
Fisig(m
γγj; m
H) and
Fibkg(m
γγj) are the signal and background probability distribution functions discussed in Section 6, and the G
lincorporate the constraints from the uncertainties on the photon energy scale and resolution, as well as the uncertainty on the fitted peak position from the chosen background parameterisation, with nuisance parameters
θ. The uncertainties on the photon energy scale and resolution, as well as from the choice ofbackground parameterisation are treated as correlated between all bins of a differential distribution. The extracted yield is not constrained to be positive and the Higgs boson mass is constrained to its measured value [6] within its uncertainties. The signal-plus-background fit to the m
γγspectrum in the diphoton baseline and VBF-enhanced fiducial regions is shown in Figure 2.
7.3 Correcting for detector e ff ects
The cross section (σ
i) in a fiducial region, and the differential cross section (dσ
i/dx) in a bin of variablex, are given by
σi= νsigi
c
iR
L dt and dσ
idx
= νsigic
i∆x
iR
L dt
,(2)
where
RL dt is the integrated luminosity of the dataset, c
iis a correction factor that accounts for the
di
fference in the event yield at detector- and particle-levels, which arises from detector ine
fficiency and
resolution, and
∆x
iis the bin width. The correction factors are determined using the simulated samples discussed in Section 4.
The particle-level is defined using particles with a mean lifetime cτ > 10 mm. The selection criteria applied to the particles are chosen to be similar to the criteria applied at detector level to ensure minimal model dependence of the final measurement. The two highest transverse momentum photons with
|η| <2.37 (excluding 1.37
< |η| <1.52) that do not originate from the decay of a hadron are required to satisfy p
T/mγγ>0.35 and p
T/mγγ>0.25, respectively. Furthermore for these two photons, the summed transverse momentum of charged particles with p
T >1 GeV within a cone of
∆R
=0.2 centred on the photon direction is required to be less than 5% of the photon transverse momentum. Leptons are required to have p
T >15 GeV,
|η| <2.47 and not to originate from the decay of a hadron, and electrons are excluded in the region 1.37
< |η| <1.52. The lepton four momentum is defined as the combination of an electron (or muon) and all nearby photons with
∆R
<0.1 that do not originate from the decay of a hadron. Electrons are also rejected if they lie within
∆R
<0.4 of a photon with p
T >15 GeV. Jets are reconstructed from all particles, excluding muons and neutrinos, using the anti-k
talgorithm with a radius parameter of 0.4. Jets are required to have p
T >30 GeV,
|y| <4.4 and be well separated from photons with p
T >15 GeV (∆ R
>0.4) and electrons (∆ R
>0.2). The missing transverse momentum is defined as the vector sum of neutrino transverse momenta, for neutrinos that do not originate from the decay of a hadron.
The fiducial phase space definitions at particle-level are chosen to match the definitions at detector level.
The correction factor is 0.77 in the baseline region and is dominated by the photon reconstruction and identification e
fficiency. The correction factor also accounts for migrations caused by the finite photon energy resolution and removes a small fraction of events that originate from Dalitz decays. No correction is applied to the data for signal-background interference. The correction factor is different in fiducial regions defined by associated jet activity and ranges, for example, from 0.63 for N
jets =0 to 1.20 for N
jets>2.
8 Measurement of simplified template and total production mode cross sections and signal strengths
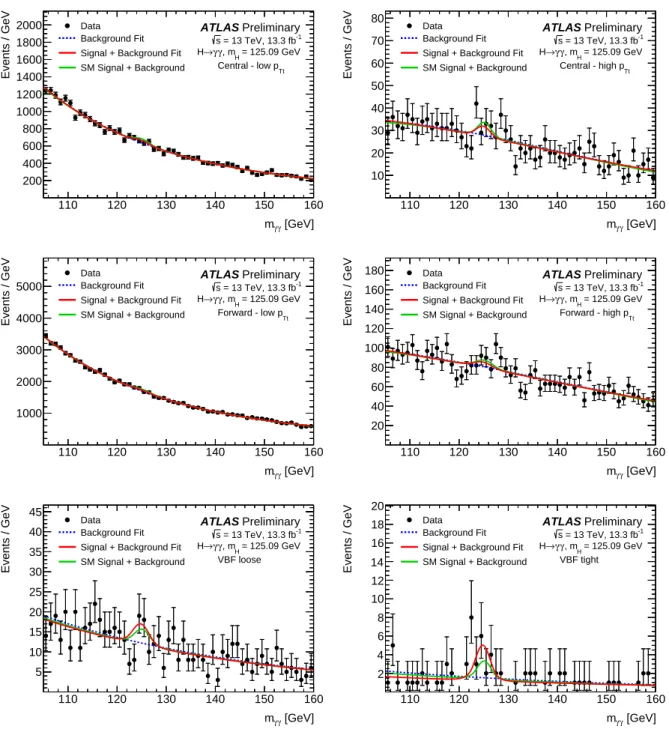
8.1 Event categorisation
The events selected in the diphoton baseline region are split into exclusive categories that are optimised for the best separation of the Higgs boson production processes. Each category is enriched with events of a given production mode, selected based on the reconstructed event kinematics and topology. A combined fit to the event categories, described in Section 8.2, is then performed to determine simplified template (with
|yH| <2.5) and total production mode cross sections and signal strengths (in the full phase space).
The selection starts from the nominal diphoton selection discussed in Section 5. The categorisation
proceeds from the production modes with the smallest expected cross sections to the production modes
with largest expected cross sections, in the order as described below.
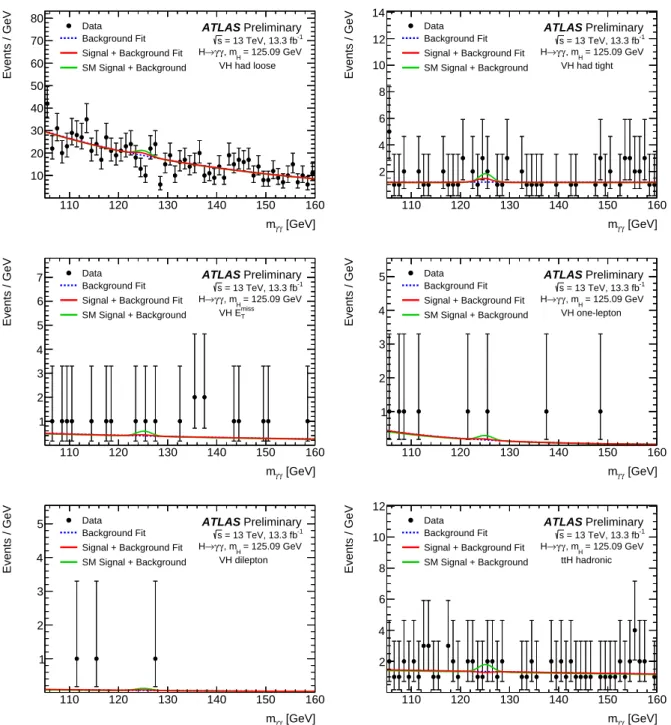
8.1.1 tt H¯ enriched categories
Two t¯ tH categories are defined to select events in which at least one top quark decays leptonically or in which both top quarks decay hadronically. In the following definitions, jets are required to be within
|η|<2.5 to allow b−tagging of all jets in the event.
The leptonic t¯ tH category requires at least one lepton and at least two jets. The events are then required to have at least two b-tagged jets, or at least one b-tagged jet and E
Tmiss>20 GeV. To reduce contamination from Z
+jets andZH, events are rejected if the invariant mass of any electron and any of the signal photons is between 84 GeV and 94 GeV, which accounts for the miscalibration of an electron as a photon, or if the invariant mass of any same-flavor lepton pair is between 81 GeV and 101 GeV.
The hadronic t¯ tH category requires zero selected leptons and at least five jets with p
T >30 GeV in the event, with at least one of them b-tagged.
For the t¯ tH categories, the choice of background function and the estimation of the potential bias (see Section 6.3) is carried out using data in dedicated control regions, where at least one of the two photons is required either to fail the tight identification (still passing loose identification) or isolation criteria. The control region for the hadronic category requires at least five jets with p
T >25 GeV, whereas the control region for the leptonic category requires at least three jets with p
T>25 GeV and E
missT >20 GeV.
8.1.2 V Henriched categories
Five categories are enriched in Higgs boson production in association with a vector boson, based on di
fferent decays of the vector bosons.
The V H dilepton category targets ZH production with Z
→``. The category requires the presence of atleast two same-flavor, opposite-sign leptons with an invariant mass between 70 GeV and 110 GeV.
The V H one-lepton category targets W H production with W
→`ν. It requires exactly one selected leptonand an E
missTsignificance of at least 4.5. The transverse momentum of the diphoton system is required to be greater than 60 GeV. A veto is applied to events in which any selected jet is b-tagged, as well as to events for which the invariant mass of a selected electron and any of the two signal photons is between 84 GeV and 94 GeV.
The V H missing transverse momentum category targets ZH production with Z
→ννand W
→`νwhere the lepton was not reconstructed or identified. Events are required to have E
missTsignificance of at least 7 and the transverse momentum of the diphoton system to be greater than 90 GeV.
Two V H hadronic categories target V H production with a hadronically decaying vector boson. Events are required to have at least two jets with 50
<m
j j <150 GeV. A boosted decision tree (BDT) classifies the events using the following information: the dijet invariant mass, the p
Ttof the diphoton system, the rapidity di
fference between the dijet and the diphoton system and cos
θ∗γγ,j j. The p
Ttof the diphoton system is defined as the orthogonal component of the diphoton momentum when projected on the axis given by the di
fference of the 3-momenta of the two photons. The angle
θ∗γγ,j jis the angle of the diphoton system with respect to the direction of motion of the diphoton-dijet system in the Collins–Soper frame.
Using the BDT, a V H hadronic tight category is defined with an expected fraction of V H events (among
all Higgs events in this category) of 45%, while a V H hadronic loose category is defined with an expected
fraction of V H events of 27.5%.
ηjj
∆
2 3 4 5 6 7 8
jjη∆1/N dN/d
0 0.02 0.04 0.06 0.08 0.1
0.12 γγ, γ-jet, jet-jet
data sideband VBF ggH ATLASPreliminary
=13TeV, 13.3 fb-1
s
=125 GeV , mH
γ γ H→
γ,jj
φγ
∆
0 0.5 1 1.5 2 2.5 3
,jjγγφ∆1/N dN/d
0 0.05 0.1 0.15 0.2 0.25 0.3 0.35 0.4
0.45 γγ, γ-jet, jet-jet
data sideband VBF ggH ATLASPreliminary
=13TeV, 13.3 fb-1
s
=125 GeV , mH
γ γ H→
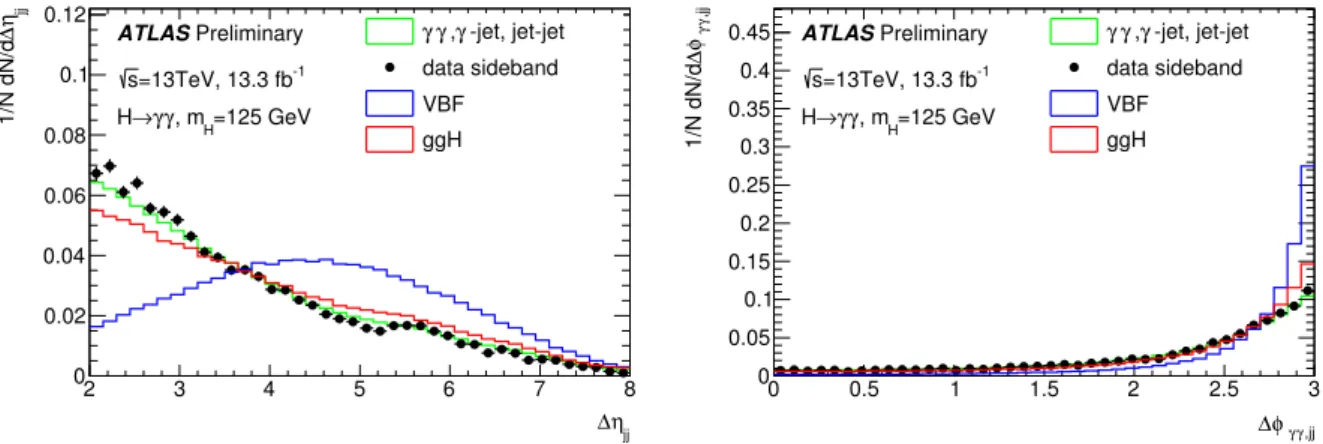
Figure 3: The distributions of two kinematic variables used for the selection of the VBF categories:∆ηj j(left) and
∆φγγ−j j(right) for events after the first step of the selection (see text) for simulatedH→ γγevents produced via vector boson fusion (blue) and gluon fusion (red), for simulatedγγ,γjand j jevents (green), and for events from data with 105 GeV<mγγ<120 GeV or 130 GeV<mγγ<160 GeV.
For the V H dilepton, one lepton, and missing transverse energy categories, the choice of background function used to extract the signal and the estimation of the potential bias from that choice (see Sec- tion 6.3) is determined using dedicated simulated samples of Wγγ and Zγγ. Due to the low event yield in the V H dilepton category, the background function is taken to be an exponential function, the parameters of which are determined from the Z(→
``)γγsimulated sample after correcting the yield for the expected contribution from Zγ j and Z j j events. These parameters are allowed to vary by 100% in the fit to data.
8.1.3 VBF enriched categories
Two categories are defined to enhance the contribution of vector boson fusion production. Events are required to have at least two hadronic jets and the dijet system is defined using the two leading jets in the event. The pseudorapidity separation
∆ηj jbetween the two leading jets is required to be greater than 2, and
|ηγγ−0.5(η
j1+ηj2)
|is required to be less than 5. A BDT is then used to classify events, using six kinematic variables: m
j j;
∆ηj j; the azimuthal difference of the diphoton and the dijet system,
∆φγγ−j j; p
Tt; the minimum angular separation between either of the two signal photons and either of the two leading jets,
∆R
minγj; and
|ηγγ−0.5(η
j1+ηj2)|. Any requirement on
∆φγγ−j je
ffectively vetoes additional jets in the event by restricting the phase space for additional emissions and, to avoid uncontrolled theoretical uncertainties, the BDT does not use shape information for events with
∆φγγ−j j >2.94 by merging these events into one bin. Two categories are defined by cuts on the BDT output value. The VBF tight category has an expected fraction of VBF events (among all Higgs events in this category) of 75%, while the VBF loose category has an expected fraction of VBF events of 52%.
Figure 3 shows the distributions of
∆ηj jand
∆φγγ−j jin simulated H
→γγevents, simulated
γγ,γj and j j
events and events selected from the m
γγsidebands in data. The variables show a good separation between
VBF events and both gluon fusion events and background events.
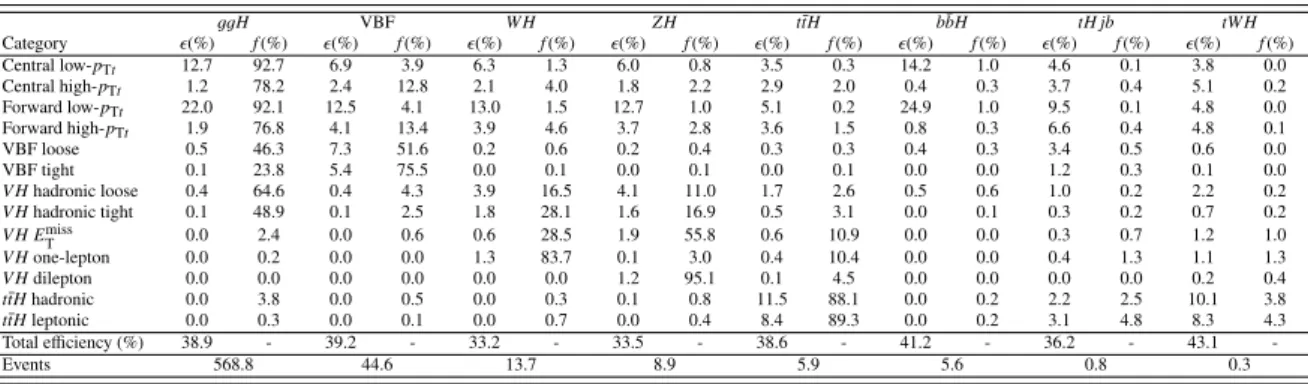
Table 2: The expected signal efficiencies times acceptances, denoted as, and the expected signal event fractions f per production mode for each category, given for the full phase space (no requirement on|yH|). The number of expected signal events per production process is also given. The category names denote the particular production process or kinematic properties the category targets. The relative statistical uncertainties on the efficiencies and event fractions are typically a few percent.
ggH VBF W H ZH t¯tH bbH¯ tH jb tW H
Category (%) f(%) (%) f(%) (%) f(%) (%) f(%) (%) f(%) (%) f(%) (%) f(%) (%) f(%)
Central low-pTt 12.7 92.7 6.9 3.9 6.3 1.3 6.0 0.8 3.5 0.3 14.2 1.0 4.6 0.1 3.8 0.0
Central high-pTt 1.2 78.2 2.4 12.8 2.1 4.0 1.8 2.2 2.9 2.0 0.4 0.3 3.7 0.4 5.1 0.2
Forward low-pTt 22.0 92.1 12.5 4.1 13.0 1.5 12.7 1.0 5.1 0.2 24.9 1.0 9.5 0.1 4.8 0.0
Forward high-pTt 1.9 76.8 4.1 13.4 3.9 4.6 3.7 2.8 3.6 1.5 0.8 0.3 6.6 0.4 4.8 0.1
VBF loose 0.5 46.3 7.3 51.6 0.2 0.6 0.2 0.4 0.3 0.3 0.4 0.3 3.4 0.5 0.6 0.0
VBF tight 0.1 23.8 5.4 75.5 0.0 0.1 0.0 0.1 0.0 0.1 0.0 0.0 1.2 0.3 0.1 0.0
V Hhadronic loose 0.4 64.6 0.4 4.3 3.9 16.5 4.1 11.0 1.7 2.6 0.5 0.6 1.0 0.2 2.2 0.2
V Hhadronic tight 0.1 48.9 0.1 2.5 1.8 28.1 1.6 16.9 0.5 3.1 0.0 0.1 0.3 0.2 0.7 0.2
V H ETmiss 0.0 2.4 0.0 0.6 0.6 28.5 1.9 55.8 0.6 10.9 0.0 0.0 0.3 0.7 1.2 1.0
V Hone-lepton 0.0 0.2 0.0 0.0 1.3 83.7 0.1 3.0 0.4 10.4 0.0 0.0 0.4 1.3 1.1 1.3
V Hdilepton 0.0 0.0 0.0 0.0 0.0 0.0 1.2 95.1 0.1 4.5 0.0 0.0 0.0 0.0 0.2 0.4
t¯tHhadronic 0.0 3.8 0.0 0.5 0.0 0.3 0.1 0.8 11.5 88.1 0.0 0.2 2.2 2.5 10.1 3.8
t¯tHleptonic 0.0 0.3 0.0 0.1 0.0 0.7 0.0 0.4 8.4 89.3 0.0 0.2 3.1 4.8 8.3 4.3
Total efficiency (%) 38.9 - 39.2 - 33.2 - 33.5 - 38.6 - 41.2 - 36.2 - 43.1 -
Events 568.8 44.6 13.7 8.9 5.9 5.6 0.8 0.3
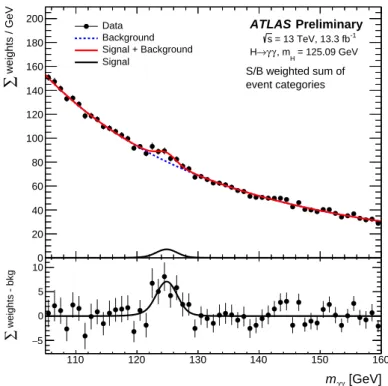
8.1.4 Untagged categories
The remaining events are split into four categories, which contain mostly events produced through gluon fusion. The categorisation separates events with di
fferent expected diphoton invariant mass resolution and signal-to-background ratio to improve the precision with which the gluon fusion production cross section is measured.
The central high-p
Ttand low-p
Ttcategories require both photons to be within
|η|<0.95 and select events with p
Tt >70 GeV and p
Tt <70 GeV, respectively. The forward high- p
Ttand low-p
Ttcategories require at least one photon to have
|η|>0.95 and select events with p
Tt >70 GeV and p
Tt <70 GeV, respectively.
The high-p
Ttcategories improve the separation of gluon fusion and vector boson fusion production due to the on average higher p
Ttin vector boson fusion events.
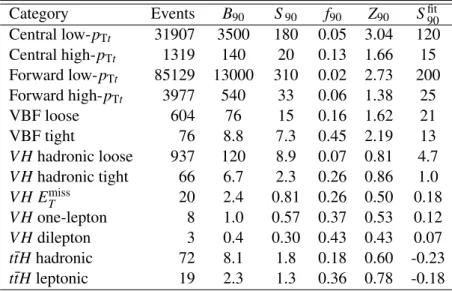
8.1.5 Categorisation summary
The predicted signal e
fficiencies, including geometric and kinematic acceptances, and the event fractions per production mode for each category are given in Table 2, along with the expected number of signal events per category.
8.2 Statistical procedure to measure simplified template and total production process cross sections and signal strengths
The statistical procedure follows very closely that of previous analyses [13]. The signal yield in a category k can be written as a sum over all Higgs boson production processes i with cross section
σi,
N
ksig=Xi
σi· B
(H
→γγ)·ik·A
ik· ZL dt (3)
where A
ikis the acceptance for category k for events produced through production process i,
ikis the ef- ficiency for category k for events produced through production process i and
B(H→γγ) is the branchingratio for the decay into two photons. The
σi · B(H →γγ) are the parameters of interest extracted fromthe data, defined as total production cross sections or simplified template cross sections accordingly.
For the measurement of the signal strengths,
σi· B(H →γγ) is expressed asµi·σSMi · B(H → γγ)SM, where
σSMiand
B(H→γγ)SMare the respective values predicted by the SM and the signal strength
µiis determined from the data.
A maximum likelihood fit is performed on the m
γγspectrum in each event category and simultaneously extracts either the
σi· B(H→γγ) orµifor all production modes considered. The fit is unbinned for event categories with fewer than 550 selected events, and binned otherwise. The likelihood
Lis defined as a product of the likelihoods for each category
Lk:
L=Y
k
Lk=Y
k
P(n
k|Nk(θ))
·nk
Y
j=1
Fk
(m
γγj , θ)·Yl
G
l(θ), (4)
where P is a Poisson distribution, n
kis the observed number of events, N
kis the expected number of events,
Fk(m
γγj) is the probability density function of the invariant mass evaluated for event j,
θare nuisance parameters, and G
l(θ) are unit Gaussian constraints on certain nuisance parameters. In the fit, the Higgs boson mass is constrained to its measured value [6] within its uncertainties. The invariant mass distribution is given by
Fk
(m
γγj)
=
X
i
N
iksig(θ
yieldik , θmigik ,m
H)
+N
kspur·θspurk
· Fksig
(m
γγj , θsshapek)
+N
kbkg· Fkbkg(m
γγj , θbshapek)
/Nk,
(5) where N
iksigis the expected number of signal events produced via process i, N
kspuris the spurious signal, N
kbkgis the number of background events, and
Fsigk
and
Fbkgk