A TLAS-CONF-2016-104 29 September 2016
ATLAS NOTE
ATLAS-CONF-2016-104
28th September 2016
Search for new phenomena in t t ¯ final states with additional heavy-flavour jets in 13.2 fb −1 of p p collisions at √
s = 13 TeV with the ATLAS detector
The ATLAS Collaboration
Abstract
A search for new phenomena in t¯ t final states with additional heavy-flavour jets is presented.
The search targets a variety of signals, including the pair production of a vector-like top quark ( T ) with a significant branching ratio to a top quark and either a Standard Model Higgs boson or a Z boson; four-top-quark production, both within the Standard Model and in several new physics scenarios; and heavy Higgs bosons (neutral and charged) produced in association with, and decaying into, third generation quarks. The analysis uses pp collisions at
√ s = 13 TeV recorded in 2015 and 2016 with the ATLAS detector at the CERN Large Hadron Collider. The dataset corresponds to an integrated luminosity of 13.2 fb − 1 . Data are analysed in the lepton-plus-jets final state, characterised by an isolated electron or muon with high transverse momentum, large missing transverse momentum and multiple jets, as well as the jets+ E miss
T final state, characterised by multiple jets and large missing transverse momentum. The search exploits the high multiplicity of b -jets, the high scalar sum of transverse momenta of all final state objects, and the presence of boosted, hadronically- decaying resonances reconstructed as large-radius jets characteristic of signal events. In the absence of a significant excess above the Standard Model expectation, 95% CL upper limits are derived for the signal models in a number of benchmark scenarios, in most cases significantly extending the reach of previous searches.
© 2016 CERN for the benefit of the ATLAS Collaboration.
Reproduction of this article or parts of it is allowed as specified in the CC-BY-4.0 license.
1. Introduction
The discovery of a new particle consistent with the Standard Model (SM) Higgs boson by the ATLAS [1]
and CMS [2] collaborations is a major milestone in high-energy physics. However, the underlying nature of electroweak symmetry breaking (EWSB) remains unknown. Naturalness arguments [3] require that quadratic divergences that arise from radiative corrections to the Higgs boson mass must be cancelled by some new mechanism in order to avoid fine-tuning. To that effect, several explanations have been proposed in theories beyond the SM (BSM). In Supersymmetry [4–6], the cancellation comes from assigning superpartners to the SM bosons and fermions. A common prediction of supersymmetric models, as in many other BSM scenarios, is the presence of an extended Higgs sector.
Alternatively, Little Higgs [7, 8] and Composite Higgs [9, 10] models introduce a spontaneously broken global symmetry, with the Higgs boson emerging as a pseudo–Nambu–Goldstone boson [11]. Such models predict the existence of vector-like quarks, defined as colour-triplet spin-1/2 fermions whose left- and right-handed chiral components have the same transformation properties under the weak-isospin SU(2) gauge group [12, 13]. In these models vector-like quarks are expected to couple preferentially to third-generation quarks [12, 14] and they can have flavour-changing neutral current decays, in addition to the charged-current decays characteristic of chiral quarks. As a result, an up-type quark T with charge +2 / 3 can decay not only to a W boson and a b -quark, but also to a Higgs or Z boson and a top quark ( T → W b , Zt , and Ht ). Similarly, a down-type quark B with charge − 1 / 3 can decay to a Higgs or Z boson and a b -quark, in addition to decaying to a W boson and a top quark ( B → W t , Z b , and H b ). In order to be consistent with the results from the precision electroweak measurements, a small mass splitting between vector-like quarks belonging to the same SU(2) multiplet is required [15], which forbids cascade decays such as T → W B and leaves direct decays into SM particles as the only possibility. Couplings between the vector-like quarks and the first and second quark generations, although not favoured, are not excluded [16, 17]. This leads to a rich phenomenology at the LHC, which the experiments are investigating.
Using the Run 1 dataset, the ATLAS and CMS collaborations have carried out a broad program of searches for pair production of a vector-like T quark, T T ¯ , taking into account all three possible decay modes into third-generation SM quarks [18–23]. Considering the most restrictive limits set by any of the Run 1 ATLAS searches, the resulting observed (expected) lower limits on the T quark mass vary between 730 GeV and 950 GeV (715 GeV and 885 GeV), depending on the values of the branching ratios into the three decay modes assumed. The corresponding observed (expected) lower limits from the combination of the Run 1 CMS searches range between 720 GeV and 920 GeV (740 GeV and 900 GeV). The increased centre-of-mass energy of
√ s = 13 TeV in Run 2 results in a significantly larger pair-production cross section compared to Run 1, particularly at high values of the vector-like T -quark mass, enhancing the discovery potential. Early Run 2 searches for T T ¯ production have been performed by the ATLAS [24–26]
and CMS [27] collaborations, respectively using 3.2 fb − 1 and 2.3 fb − 1 of pp collisions at
√ s = 13 TeV recorded in 2015. Among them, the ATLAS search for T T ¯ → Ht +X in the single-lepton channel [24]
has obtained observed (expected) 95% CL limits of m T > 800 (900) GeV and m T > 750 (780) GeV for a weak-isospin doublet and singlet, respectively. The searches presented in this note represent a significant extension, both in integrated luminosity and scope, over that search.
The top quark plays a prominent role in many BSM scenarios, often participating in new interactions related to electroweak symmetry breaking, or preferentially coupling to new degrees of freedom. Such BSM scenarios often predict an enhanced rate of events containing four top quarks ( t¯ tt¯ t ) in the final state, compared to the SM production via the strong interaction. Examples include top quark compositeness [28–
30] or universal extra dimensions [31–33]. Using the full Run 1 dataset, the CMS Collaboration has
performed a search for SM t tt¯ ¯ t production [34], while the ATLAS Collaborations has performed searches for t¯ tt t ¯ production within the SM as well as in several BSM scenarios [18, 20]. Early Run 2 searches [24, 25, 35, 36] have already achieved more restrictive bounds than those obtained in Run 1.
The addition of another SU(2) doublet of fields to the Higgs sector is one of the simplest extensions of the SM and defines a large class of models, which are collectively referred to as two-Higgs-doublet models (2HDMs) (see e.g. Ref. [37] for a review). In the case where the Higgs potential of the 2HDM is CP conserving, the Higgs bosons after electroweak symmetry breaking are two CP-even ( h and H ), one CP-odd ( A ) and two charged ( H ± ) Higgs bosons. In general, the model allows to have the lightest CP-even Higgs boson ( h ) correspond to the one discovered at the LHC, i.e. it has a mass of 125 GeV. Existing constraints from direct searches for heavy neutral and charged Higgs bosons by the ATLAS and CMS collaborations (for recent results at
√ s = 13 TeV see Refs. [38–44] and [45–49] respectively), as well as those resulting from the measurements of SM Higgs-boson couplings [50–52], restrict the available parameter-space to the so-called “alignment limit". In this limit the couplings of h are the same as for the SM Higgs boson. For masses of the heavy neutral Higgs bosons above twice the top quark mass, the dominant decay mode is H/A → t¯ t . Inclusive searches for H/A → t¯ t are challenging because of negative interference effects with the SM background that largely dilute a resonant peak in the t¯ t invariant mass spectrum [53], although first results have been obtained by the ATLAS Collaboration [54]. Another possibility is to search for associated production with third generation quarks, bbH/ A(→ tt ) and tt H/ A(→ tt) . Charged Higgs bosons are mainly produced via associated production with third-generation quarks, and they decay dominantly into a top quark and a bottom quark as soon as kinematically allowed, tbH ± (→ tb).1 Direct searches for tbH ± (→ tb) have been performed by the ATLAS [44, 55] and CMS [56] collaborations.
The importance of these search modes and their complementarity to probe an extended Higgs sector has recently been highlighted in a number of phenomenological studies [57–60].
This note presents a broad search for new phenomena in t¯ t final states with additional heavy-flavour jets, resulting from either T T ¯ production, t¯ tt t ¯ production (both within the SM and in several BSM scenarios), as well as t t H/A ¯ → t¯ tt t ¯ , b bH/ ¯ A → b bt ¯ t ¯ and tbH ± → tbtb production. This search uses 13.2 fb − 1 of data at
√ s = 13 TeV recorded in 2015 and 2016 by the ATLAS Collaboration, and it follows closely the analysis strategy developed in Ref. [24] for the single-lepton channel (referred to as “1-lepton" in the following). In addition, it includes a new search channel with no leptons and large missing transverse momentum (referred to as “0-lepton" in the following). The two channels are combined, yielding significant improvements in sensitivity to T T ¯ production compared to the individual searches.
This note is organised as follows. After a brief overview of the ATLAS detector in Section 2, the main reconstructed physics objects used in this search are summarised in Section 3. Section 4 is devoted to a discussion of the dataset and event preselection requirements. Sections 5 and 6 summarise the simulated samples used for signal and background modelling, respectively. A discussion of the analysis strategy, including the final event selection requirements, the event categorisation and final discriminating variable used, is presented in Section 7. A detailed discussion of the systematic uncertainties considered in this search is given in Section 8. The statistical analysis and results obtained are presented in Sections 9 and 10, respectively. Finally, the summary and conclusions are given in Section 11.
1
In the following, tbH
±(→ tb) is used to denote ¯ tbH
+(→ t b) ¯ and its charge conjugate, t bH ¯
−(→ tb) ¯ .
2. ATLAS detector
The ATLAS detector [61] at the LHC covers almost the entire solid angle around the collision point, and consists of an inner tracking detector surrounded by a thin superconducting solenoid magnet producing a 2 T axial magnetic field, electromagnetic and hadronic calorimeters, and a muon spectrometer incorporating three large toroid magnet assemblies. The inner detector consists of a high-granularity silicon pixel detector, including the newly-installed insertable B-layer [62], and a silicon microstrip tracker, together providing a precise reconstruction of tracks of charged particles in the pseudorapidity2 range |η | < 2 . 5, complemented by a transition radiation tracker providing tracking and electron identification information for |η | < 2 . 0. The electromagnetic (EM) sampling calorimeter uses lead as the absorber material and liquid-argon (LAr) as the active medium, and is divided into barrel ( |η | < 1 . 475) and end-cap (1 . 375 < |η| < 3 . 2) regions. Hadron calorimetry is also based on the sampling technique, with either scintillator tiles or LAr as the active medium, and with steel, copper, or tungsten as the absorber material.
The calorimeters cover |η | < 4 . 9. The muon spectrometer measures the deflection of muons with |η| < 2 . 7 using multiple layers of high-precision tracking chambers located in a toroidal field of approximately 0.5 T and 1 T in the central and end-cap regions of ATLAS, respectively. The muon spectrometer is also instrumented with separate trigger chambers covering |η | < 2 . 4. A two-level trigger system [63], consisting of a hardware-based Level-1 trigger followed by a software-based High Level Trigger (HLT), is used to reduce the event rate to a maximum of around 1 kHz for offline storage.
3. Object reconstruction
Interaction vertices from the proton-proton collisions are reconstructed from at least two tracks with transverse momentum ( p T ) larger than 400 MeV that are consistent with originating from the beam collision region in the x – y plane. If more than one primary vertex candidate is found, the one that has the largest sum of the squared p T of its associated tracks [64] is selected as the hard-scatter primary vertex.
Basic selections are applied to define candidates for electrons, muons and jets in the event. An overlap removal procedure is applied to these candidates to prevent double-counting of the objects. Further requirements are then made to select the final leptons and jets from the remaining objects. The details of the object selections and of the overlap removal procedure are given below.
Electron candidates [65–67] are reconstructed from energy clusters in the EM calorimeter that are matched to reconstructed tracks in the inner detector and have |η cluster | < 2 . 47, excluding the transition region 1 . 37 < |η cluster | < 1 . 52 between sections of the EM calorimeter. They are also required to satisfy
“medium” quality requirements [65] based on calorimeter, tracking and combined variables that provide good separation between electrons and jets. Muon candidates [68] are reconstructed from track segments in the various layers of the muon spectrometer that are matched with tracks found in the inner detector. The resulting muon candidates are refitted using the complete track information from both detector systems and are required to have | η| < 2 . 5. Electron (muon) candidates are matched to the primary vertex by requiring that the significance of their transverse impact parameter, d 0 , satisfies |d 0 /σ( d 0 ) | < 5 ( 3 ) ,
2
ATLAS uses a right-handed coordinate system with its origin at the nominal interaction point (IP) in the centre of the detector and the z -axis coinciding with the axis of the beam pipe. The x -axis points from the IP to the centre of the LHC ring, and the y -axis points upward. Cylindrical coordinates (r,φ) are used in the transverse plane, φ being the azimuthal angle around the beam pipe. The pseudorapidity is defined in terms of the polar angle θ as η = − ln tan (θ/ 2 ) . Angular distance is measured in units of ∆R ≡
q (∆η)
2+ (∆φ)
2.
where σ(d 0 ) is the measured uncertainty on d 0 , and their longitudinal impact parameter, z 0 , satisfies
| z 0 sin θ | < 0 . 5 mm. Furthermore, they are required to have p T > 10 GeV and to survive the overlap removal procedure discussed below.
Candidate jets are reconstructed with the anti- k t algorithm [69–71] with a radius parameter R = 0 . 4 (referred to as “small- R jets”), using topological clusters3 [72, 73] built from energy deposits in the calorimeters calibrated to the electromagnetic scale. The reconstructed jets are then calibrated to the particle level by the application of a jet energy scale derived from simulation and in situ corrections based on
√ s = 13 TeV data [74, 75]. Quality criteria are imposed to reject events that contain any jets arising from non-collision sources or detector noise [76]. To reduce the contamination due to jets originating from pile-up interactions, an additional requirement on the Jet Vertex Tagger (JVT) [77] output to be less than 0.59 is made for jets with p T < 60 GeV and |η | < 2 . 4. Candidate jets with p T > 25 GeV and
|η | < 2 . 5 are used in the overlap removal procedure discussed below.
Jets containing b -hadrons are identified ( b -tagged) via an algorithm [78, 79] that uses multivariate tech- niques to combine information from the impact parameters of displaced tracks as well as topological properties of secondary and tertiary decay vertices reconstructed within the jet. For each jet, a value for the multivariate b -tagging discriminant is calculated. The jet is considered b -tagged if this value is above a given threshold. The threshold used in this search corresponds to an average 77% efficiency to tag a b -quark jet, with a light-jet4 rejection factor of ∼ 126 and a charm-jet rejection factor of ∼ 4.5, as determined for jets with p T > 20 GeV and |η | < 2 . 5 in simulated t¯ t events.
Overlaps between candidate objects are removed sequentially. Firstly, electron candidates that lie within
∆R = 0 . 01 of a muon candidate are removed to suppress contributions from muon bremsstrahlung.
Overlaps between electron and jet candidates are resolved next, and finally, overlaps between remaining jet candidates and muon candidates are removed. Clusters from identified electrons are not excluded during jet reconstruction. In order to avoid double-counting of electrons as jets, the closest jet whose axis is within ∆R < 0 . 2 of an electron is discarded. If the electron is within ∆R < 0 . 4 of the axis of any jet after this initial removal, the jet is retained and the electron is removed. The overlap removal procedure between the remaining jet candidates and muon candidates is designed to remove those muons that are likely to have arisen in the decay chain of hadrons and to retain the overlapping jet instead. Jets and muons may also appear in close proximity when the jet results from high- p T muon bremsstrahlung, and in such cases the jet should be removed and the muon retained. Such jets are characterised by having very few matching inner detector tracks. Therefore, if a muon lies within ∆R = 0 . 4 of the axis of a jet, the jet is removed if either it has fewer than three matching tracks or it has a p T less than 50% of the p T of the muon.
If any of these conditions on the jet are not fulfilled, then the muon is removed and the jet is kept.
The candidate small- R jets surviving the overlap procedure discussed above are used as inputs for further jet re-clustering [80] using the anti- k t algorithm with a radius parameter R = 1 . 0. In order to suppress contributions from pile-up and soft radiation, the re-clustered large- R jets are trimmed [81] by removing all small- R (sub-)jets within a re-clustered jet that have p T below 5% of the p T of the re-clustered jet (i.e. f cut = 0 . 05). Due to the pileup suppression and p T > 25 GeV requirements made on the small- R jets, the average fraction of small- R jets removed by the trimming requirement is less than 1%. The resulting large- R jets are used to identify high- p T hadronically-decaying top quark and Higgs boson candidates by requiring them to have p T > 300 GeV, |η | < 2.0 and mass5 above 100 GeV. In order to ensure that
3
Each cluster in the calorimeter is considered a massless object.
4
Light-jet denotes a jet originating from the hadronisation of a light quark ( u , d , s ) or a gluon.
5
The re-clustered jet mass is computed from the sum of the four-momenta of the associated small- R (sub-)jets.
the mass of the large- R jet originates from the p T and angular separation of the sub-jets, instead of from the un-calibrated small- R jet mass, a requirement of ≥ 2 sub-jets is made. In this way it is possible to evaluate the uncertainty on the mass of the large- R jets coming from the calibration of its constituents by varying the energy scale and resolution of small- R jets. The fraction of re-clustered jets rejected by this requirement is about 1% in t¯ t simulated events and up to about 10% for the highest-mass simulated signals considered in this search. The resulting large- R jets will be referred to as “mass-tagged" jets.
After resolving the overlaps, the final lepton candidates used in the analysis must have p T > 25 GeV. The resulting electron candidates must also satisfy “tight” quality requirements [65]. Finally, to reduce the background from non-prompt electrons or muons resulting from semileptonic decays of b - or c -hadrons, and from jets with a high fraction of their energy deposited in the EM calorimeter, lepton (electron or muon) candidates are required to be isolated. These criteria include both track and calorimeter information and are designed to give an average efficiency of ≈ 90% for leptons from Z boson decays with p T of 25 GeV, rising to ≈ 99% for p T of 60 GeV.
The missing transverse momentum p ~ T miss (with magnitude E miss
T ) is defined as the magnitude of the negative vector sum of the p T of all selected and calibrated objects in the event, including a term to account for energy from soft particles in the event that is not associated to any of the selected objects.
This soft term is calculated from inner detector tracks matched to the selected primary vertex to make it more resilient to contamination from pileup interactions [82, 83].
Simulated signal and background events are processed through the same reconstruction software as the data. They are corrected so that the object identification efficiencies, energy scales and energy resolutions match those determined from data control samples. Details on signal and background modelling are provided in Sections 5 and 6.
4. Data sample and event preselection
This search is based on pp collision data at
√ s = 13 TeV and with 25 ns bunch spacing collected by the ATLAS experiment between August and November 2015 and between April and July 2016. Only events recorded with a single-electron trigger, a single-muon trigger, or a E miss
T trigger under stable beam conditions and for which all detector subsystems were operational are considered, corresponding to an integrated luminosity of 13 . 2 fb − 1 .
Single-lepton triggers with low p T threshold and lepton isolation requirements are combined in a logical OR with higher-threshold triggers without isolation requirements to give maximum efficiency. For muon triggers, the lowest p T threshold is 20 (24) GeV in 2015 (2016), while the higher p T threshold is 40 (50) GeV. For electrons, isolated triggers with a p T threshold of 24 GeV are used with non-isolated triggers at 60 GeV in both years, along with a 120 (140) GeV trigger which also uses looser identification criteria. The E miss
T trigger [63] considered uses an E miss
T threshold at the HLT level of 70 (100) GeV in 2015 (2016).
Events satisfying the trigger selection are required to have at least one primary vertex candidate. They are then classified into the “1-lepton" or “0-lepton" channels depending on the multiplicity of selected leptons. Events in the 1-lepton channel are required to satisfy a single lepton trigger and to have exactly one selected electron or muon that matches, with ∆R < 0 . 15, the lepton reconstructed by the trigger. In the following, 1-lepton events satisfying either the electron or muon selections are combined and treated as a single analysis channel. Events in the 0-lepton channel are required to satisfy the E miss
T trigger and
Preselection requirements
Requirement 1-lepton channel 0-lepton channel Trigger Single-lepton trigger E miss
T trigger Leptons =1 isolated e or µ =0 isolated e or µ
Jets ≥ 5 jets ≥ 6 jets
b -tagging ≥ 2 b -tagged jets ≥ 2 b -tagged jets E miss
T E miss
T > 20 GeV E miss
T > 200 GeV Other E miss
T -related E miss
T + m W
T > 60 GeV ∆ φ 4 min j > 0 . 4 Table 1: Summary of preselection requirements for the 1-lepton and 0-lepton channels. Here m
WT
is the transverse mass of the lepton and the E
missT
vector, and ∆φ
4jminis the minimum azimuthal separation between the E
missT
vector and the four highest- p
Tjets.
to have no selected leptons. In addition, events in the 1-lepton (0-lepton) channel are required to have ≥ 5 ( ≥ 6) small- R jets. In the following, all selected small- R jets are considered, including those used to build large- R jets. For both channels, backgrounds not including b -quark jets are suppressed by requiring at least two b -tagged jets.
Additional requirements are made to suppress the background from multijet production. In the case of the 1-lepton channel, requirements are made on E miss
T as well as on the transverse mass of the lepton and E miss
T system ( m W
T ):6 E miss
T > 20 GeV and E miss
T + m W
T > 60 GeV. In the case of the 0-lepton channel, the requirements are E miss
T > 200 GeV (for which the E miss
T trigger is fully efficient) and ∆φ 4 min j > 0 . 4, where ∆φ 4 min j is the minimum azimuthal separation between p ~ T miss and the four highest- p T jets. The later requirement is very effective in the 0-lepton channel to suppress multijet events, where the large E miss
T
results from the mismeasurement of a high- p T jet or the presence of neutrinos emitted close to a jet axis.
The above requirements are referred to as the “preselection" and are summarised in Table 1.
5. Signal modelling
This section describes the different signal scenarios considered in the interpretation of the results, together with details of how they are modelled.
5.1. Vector-like quark pair production
Figure 1 depicts a representative Feynman diagram for the signals probed by the search discussed in this note. More details on the phenomenology of T T ¯ production and decay can be found in Ref. [24].
Samples of simulated T T ¯ events are generated with the leading-order (LO) generator Protos 2.2 [13, 84] using the NNPDF2.3 LO [85] PDF set and passed to Pythia 8.186 [86] for parton showering and fragmentation. The A14 [87] set of optimised parameters for the underlying event (UE) description
6
m
WT
= q 2 p
`T
E
missT
( 1 − cos ∆φ) , where p
`T
is the transverse momentum (energy) of the muon (electron) and ∆φ is the azimuthal
angle separation between the lepton and the direction of the missing transverse momentum.
T
T ¯ W
−, H, Z
¯ b, ¯ t, ¯ t t
H
g g
Figure 1: Representative leading-order Feynman diagram for the main T T ¯ production process probed by this search.
t
¯ t t
¯ t g
g
(a)
g
g
t
t
t ¯
¯ t
¯ t t
(b)
u
g
g(1,1) u(1,1)L
g(1,1)
¯ c c(1,1)L
c Z(1,1)
µ+ µ−(1,1)
A(1,1)µ µ− W+(1,1)
d τ+
ν(1,1)τ A(1,1)µ
ντ
t
t¯ t
¯t
(c)
Figure 2: Representative leading-order Feynman diagrams for four-top-quark production (a) within the SM, (b) via an effective four-top-quark interaction in an effective field theory model, and (c) via cascade decays from Kaluza–Klein excitations in a universal extra dimensions model with two extra dimensions compactified using the geometry of the real projective plane.
using the NNPDF2.3 LO PDF set, referred to as the “UE tune”, is used. The vector-like quarks are forced to decay with a branching ratio of 1 / 3 to each of the three modes ( W, Z, H ). Arbitrary sets of branching ratios consistent with the three decay modes summing to unity are obtained by reweighting the samples using generator-level information. Samples are generated assuming singlet couplings and for heavy-quark masses between 350 GeV and 1500 GeV in steps of 50 GeV. Additional samples are produced at three mass points (700 GeV, 950 GeV and 1200 GeV) assuming doublet couplings, in order to confirm that kinematic differences arising from the different chirality of singlet and doublet couplings, after reweighting the singlet and doublet samples to the same branching ratios, have negligible impact on this analysis. In all samples (both signal and background) used in this search, the top quark and SM Higgs boson masses are set to 172 . 5 GeV and 125 GeV respectively. The T T ¯ samples are normalised using the theoretical cross section computed using Top++ v2.0 [88] at next-to-next-to-leading order (NNLO) in QCD, including resummation of next-to-next-to-leading logarithmic (NNLL) soft gluon terms [89–93], and using the MSTW 2008 NNLO [94, 95] set of parton distribution functions (PDF).
5.2. Four-top-quark production
Figure 2 depicts representative LO Feynman diagrams for four-top-quark production within the SM and
two different BSM scenarios considered in this analysis: via an effective field theory (EFT) involving
a four-fermion contact interaction among right-handed top quarks [96], and within a Universal Extra Dimensions (UED) model with two extra dimensions that are compactified using the geometry of the real projective plane (2UED/RPP) [31]. More details on these BSM scenarios can be found in Ref. [24].
Samples of simulated four-top-quark events for the three production mechanisms discussed above are generated at LO with the Madgraph5_aMC@NLO [97] generator (referred to in the following as MG5_aMC; the versions used are 2.2.2, 2.2.3 and 1.5.14 for SM, EFT and 2UED/RPP, respectively) and the NNPDF2.3 LO PDF set, interfaced to Pythia 8 (the versions used are 8.186, 8.205 and 8.186 for SM, EFT and 2UED/RPP, respectively) and the A14 tune [87]. The SM t¯ tt t ¯ sample is normalised to a cross section of 9.2 fb (computed at NLO with MG5_aMC), while the EFT t¯ tt t ¯ sample is normalised assuming |C 4 t |/Λ 2 = 4 π TeV − 2 , which yields a cross section of 928 fb. In the case of the 2UED/RPP model, samples are generated for four different values of m KK (1000 to 1800 GeV in steps of 200 GeV) and the Bridge [98] generator is used to decay the pair-produced excitations from tier (1,1) generated by Madgraph5.
5.3. Associated heavy Higgs boson production
A 2HDM has a very rich phenomenology, depending on the vacuum expectation values of the Higgs doublets (parameterised by tan β ), the CP properties of the Higgs potential and the values of its parameters, and the Yukawa couplings of the Higgs doublets with the fermions. A CP-conserving 2HDM of either Type-I or Type-II is used as a benchmark scenario in this analysis. Denoting the two Higgs doublet fields in this model as Φ 1 and Φ 2 , in a Type-I 2HDM all fermions couple only to Φ 1 , whereas in a Type-II 2HDM up-type right-handed fermions couple to Φ 2 and down-type right-handed fermions to Φ 1 . For instance, the Higgs sector of the minimal supersymmetric SM (MSSM) [4–6, 99–101] is an example of a Type-II 2HDM. In both 2HDM types the couplings of the h and H Higgs bosons to the vector bosons are the same as the couplings of the SM Higgs boson times sin ( β − α) and cos ( β − α) respectively, where α is the mixing angle between the two CP-even bosons, whereas for the A Higgs boson these couplings vanish.
The alignment limit of the 2HDM is defined as the regime in which cos( β − α) → 0. In this limit, the couplings of the neutral heavy Higgs bosons, H and A , to fermions are proportional to the couplings of the SM Higgs boson times cot β , in the case of a Type-I 2HDM, or cot β for up-type fermions and tan β for down-type fermions, in the case of a Type-II 2HDM. In the case of the H ± bosons, the couplings to fermions not only depend on their masses and tan β , but also on their chirality. For instance, in a Type-I (Type-II) 2HDM the coupling strengths for the ¯ f R 0 f L H + and ¯ f L 0 f R H + interactions are proportional to m f
0cot β and m f cot β ( m f tan β ) respectively. See Ref. [37] for the general expressions of these couplings without the restriction of cos ( β − α) = 0.
The above couplings drive the phenomenology of an extended Higgs sector. In the alignment limit, the
H/ A → t¯ t decay mode is dominant for m H/A > 2 m t at low tan β , whereas the H + → t b ¯ decay mode is
dominant for m H
+> m t + m b for any value of tan β . The cross sections for associated production of heavy
Higgs bosons and third generation quarks depend strongly on the coupling strengths. Taking into account
the product of cross section times branching ratio, the most promising search modes are bbH/ A(→ tt)
production (for tan β ∼ 5 in a Type-II 2HDM), tt H /A(→ tt ) production (for tan β ≤ 1 in both Type-I and
Type-II 2HDMs), and tbH ± (→ tb) production (for tan β ≤ 1 in both Type-I and Type-II 2HDMs, and
also for high tan β in a Type-II 2HDM). Figure 3 depicts representative LO Feynman diagrams for each
of these associated production modes.
g
g
b
t
t¯
¯b
¯b
b H/A
(a)
g
g
t
t
t¯
¯t
¯t
t H/A
(b)
g
g
b
t
¯b
¯t
¯b
t H+
(c)
Figure 3: Representative leading-order Feynman diagrams for (a) bbH/A(→ tt) production, (b) tt H /A(→ tt) production, and (c) tbH
±(→ tb) production, where H ( A ) and H
±denote the heavy Higgs bosons appearing in a 2HDM. All diagrams are in the four-flavour number scheme.
Samples of simulated bbH (→ tt) and tt H (→ tt) events are generated assuming a Type-II 2HDM model using the MG5_aMC 2.3.3 generator, interfaced to Pythia 8.210 [102] and the A14 tune. The matrix element calculation is performed at LO in QCD in four-flavour-number scheme (4FNS) and the corres- ponding 4FNS CTEQ6L1 PDF set [103] is used. Spin correlations are taken into account in the decays of top quarks and W bosons. Samples are generated for heavy Higgs boson masses between 400 GeV and 1000 GeV in steps of 100 GeV. These samples can also be used to model bbA(→ tt) and tt A(→ tt) production, as generator level studies showed no significant differences in the kinematics of the decay products for processes involving the production of a CP-even or CP-odd Higgs boson of the same mass.
The tbH ± (→ tb) samples are generated at next-to-leading-order (NLO) in QCD using MG5_aMC 2.2.2 with the NNPDF2.3 PDF set, interfaced to Pythia 8.212 with the A14 tune. A Type-II 2HDM model is assumed. The width of the charged Higgs boson has been set to zero. Samples are generated for charged Higgs boson masses between 200 GeV and 2000 GeV.
All bbH (→ tt) , tt H (→ tt) , and tbH ± (→ tb) samples are normalised to a reference cross section times branching ratio of 1 pb. For the interpretation of results, cross sections and branching ratios are computed separately for Type-I and Type-II 2HDMs, as a function of heavy Higgs boson mass, tan β and cos ( β − α) . In the case of bbH (→ tt) and tt H (→ tt) production, the predictions are obtained using the codes SusHi 1.5.0 [104], which implements calculations from Refs. [105–109], and 2HDMC 1.7.0 [110]. The tt H (→ tt) cross sections are computed at NLO in QCD, whereas the bbH (→ tt) cross sections are obtained from the so-called “Santander matching" of NLO cross sections in 4FNS and NNLO cross sections in 5FNS [111]. Similarly, the tbH ± (→ tb) cross sections are obtained using the “Santander matching" of 4FNS NLO and 5FNS NNLO cross sections [112–115]. The charged Higgs boson branching ratios are also obtained using 2HDMC.
All simulated signal samples utilise EvtGen [116] to model the decays of heavy flavour hadrons. Events from minimum-bias interactions are simulated with the Pythia 8.186 generator with the MSTW 2008 LO [117] PDF set and the A2 tune [118]. They are overlaid on the simulated signal events according to the luminosity profile of the recorded data. The contributions from these pile-up interactions are modelled both within the same bunch crossing as the hard-scattering process and in neighbouring bunch crossings.
Finally, the generated samples are processed through a simulation [119] of the detector geometry and
response using Geant4 [120]. In the case of the bbH ( → tt) , tt H ( → tt) and tbH ± ( → tb) samples a fast
simulation of the calorimeter response [119] is used.
6. Background modelling
After the event preselection, the main background is t¯ t production, often in association with jets, denoted by t t ¯ +jets in the following. Small contributions arise from single-top-quark, W /Z +jets, multijet and diboson ( W W, W Z, Z Z ) production, as well as from the associated production of a vector boson V ( V = W, Z ) or a Higgs boson and a t¯ t pair ( t¯ tV and t¯ t H ). All backgrounds are estimated using samples of simulated events and initially normalised to their theoretical cross sections, with the exception of the multijet background, which is estimated using data-driven methods. Similarly to the signal samples, the simulated background samples use EvtGen, include the contribution from pile-up interactions, and are processed through a full Geant4 detector simulation. Further details about the modelling of each of the backgrounds are provided below. The background prediction is further improved during the statistical analysis by performing a likelihood fit to data using multiple signal-depleted control regions, as discussed in Section 7.
Samples of t¯ t +jets events are generated with the next-to-leading-order (NLO) generator7 Powheg-Box 2.0 [121–124] using the CT10 PDF set [125]. All samples are generated assuming a top quark mass ( m t ) of 172 . 5 GeV and top quarks decaying exclusively through t → W b . The Powheg-Box model parameter h damp , which controls matrix element to parton shower matching and effectively regulates the high- p T radiation, is set to m t , a setting which was found to describe the t¯ t system p T at
√ s = 7 TeV [126]. The nominal sample is interfaced to Pythia 6.428 [102] with the CTEQ6L PDF set and the Perugia 2012 (P2012) UE tune [127]. Alternative t¯ t simulation samples are generated using Powheg-Box interfaced to Herwig ++ 2.7.1 [128] and MG5_aMC 2.2.1 [97] interfaced to Herwig ++ 2.7.1. The effects of initial- and final-state radiation (ISR/FSR) are explored using two alternative Powheg-Box+Pythia samples, one with h damp set to 2 m t , the renormalisation and factorisation scales set to half the nominal value and using the P2012 radHi UE tune, giving more radiation (referred to as “radHi”), and one with the P2012 radLo UE tune, h damp = m t and the renormalisation and factorisation scales set to twice the nominal value, giving less radiation (referred to as “radLow”) [129]. All t¯ t +jets samples are normalised to the theoretical cross section of 832 +46 − 51 pb, obtained using Top++ at NNLO in QCD and including resummation of NNLL soft gluon terms.
The t¯ t samples are generated inclusively, but events are categorised depending on the flavour content of additional particle jets not originating from the decay of the t¯ t system (see Ref. [24] for details). Events labelled as either t¯ t + ≥ 1 b or t t ¯ + ≥ 1 c are generically referred to below as t¯ t +HF events, where HF stands for “heavy flavour”. A finer categorisation of t t ¯ +HF events is considered for the purpose of applying further corrections and assigning systematic uncertainties associated with the modelling of heavy-flavour production in different topologies (see Refs. [130, 131] for details). The remaining events are labelled as t t ¯ +light-jet events, including those with no additional jets. Small improvements to the modelling are made by reweighting all t t ¯ samples to match their top quark p T distribution to that predicted at NNLO accuracy in QCD [132, 133]. In previous analyses improved agreement between data and prediction has been observed, particularly for the top quark p T distribution, when comparing to NNLO calculations [134].
This correction is not applied to t¯ t + ≥ 1 b events, which instead is reweighted to an NLO prediction in 4FNS of t¯ t + ≥ 1 b including parton showering [135], based on Sherpa+OpenLoops [136, 137] (referred to as SherpaOL in the following) using the CT10 PDF set. This reweighting is performed separately for each of the above t t ¯ + ≥ 1 b topologies in such a way that their inter-normalisation and the shape of the relevant kinematic distributions are at NLO accuracy, while preserving the nominal t¯ t + ≥ 1 b cross section in Powheg-Box+Pythia. More details on the modelling of the t t ¯ +jets background can be found in Ref. [131].
7
In the following, NLO generator should be understood as referring to QCD.
Samples of single-top-quark background corresponding to the t -channel production mechanism are gen- erated using the Powheg-Box 2.0 [138] generator that uses the 4FNS for the NLO matrix element calculations and the fixed four-flavour CT10f4 [125] PDF set. Samples corresponding to the W t and s -channel production mechanisms are generated with Powheg-Box 2.0 using the CT10 PDF set. Overlaps between the t¯ t and W t final states are avoided using the “diagram removal” scheme [139]. The parton shower, hadronisation and the underlying event are modelled using Pythia 6.425 with the CTEQ6L1 PDF set in combination with the P2012 UE tune. The single-top-quark samples are normalised to the approximate NNLO theoretical cross sections [140–142].
Samples of W/ Z +jets events are generated with the Sherpa 2.2 [136] generator. The matrix-element calculation is performed using up to two partons at NLO and up to four partons at LO using Comix [143]
and OpenLoops [137]. The matrix element calculation is merged with the Sherpa parton shower [144]
using the ME+PS@NLO prescription [145]. The PDF set used for the matrix-element calculation is CT10 with a dedicated parton shower tuning developed for Sherpa. Separate samples are generated for different W /Z +jets categories using filters for a b -jet ( W/Z + ≥ 1 b +jets), a c -jet and no b -jet ( W/Z + ≥ 1 c +jets), and with a veto on b and c -jets ( W/Z +light-jets), which are combined into the inclusive W /Z +jets samples.
Both the W +jets and Z +jets samples are normalised to their respective inclusive NNLO theoretical cross sections in QCD calculated with FEWZ [146].
Samples of W W /W Z/ Z Z +jets events are generated with Sherpa 2.1.1 using the CT10 PDF set and include processes containing up to four electroweak vertices. The matrix-element includes zero additional partons at NLO and up to three partons at LO using the same procedure as for the W/Z +jets samples.
The final states simulated require one of the bosons to decay leptonically and the other hadronically. All diboson samples are normalised to their NLO theoretical cross sections provided by Sherpa.
Samples of t¯ tV and t¯ t H events are generated with MG5_aMC 2.3.2, using NLO matrix elements and the NNPDF3.0NLO [147] PDF set. Showering is performed using Pythia 8.210 and the A14 UE tune.
The t¯ tV samples are normalised to the NLO cross section computed with MG5_aMC. The t¯ t H sample is normalised using the NLO cross section [148–152] and the Higgs boson decay branching ratios calculated using Hdecay [153].
The background from multijet production (“multijet background” in the following) in the 1-lepton channel contributes to the selected data sample via several production and misreconstruction mechanisms. In the electron channel, it consists of non-prompt electrons (from semileptonic b - or c -hadron decays) as well as misidentified photons (e.g. from a conversion of a photon into an e + e − pair) or jets with a high fraction of their energy deposited in the EM calorimeter. In the muon channel, the multijet background is predominantly from non-prompt muons. The multijet background normalisation and shape are estimated directly from data by using the “matrix method” technique [154], which exploits differences in lepton identification and isolation properties between prompt leptons and leptons that are either non-prompt or result from the misidentification of photons or jets. Further details can be found in Ref. [18]. In the case of the 0-lepton channel, the preselection requirements discussed in Section 4 render the multijet background negligible, which is hence not considered in the following.
7. Analysis strategy
The searches discussed in this note are optimised for discovery of T T ¯ production where at least one of the
T quarks decays into a Higgs boson and a top quark resulting in the following processes: T T ¯ → Ht Ht ,
Jet multiplicity
5 6 7 8 9 10 11 12 13 14 15
Fraction of Events
0 0.1 0.2 0.3 0.4 0.5 0.6 0.7 0.8 0.9 1
Preselection
=13 TeV, 13.2 fb
-1s
Simulation Preliminary ATLAS
Total background doublet (1 TeV) T
T (EFT) t t t t
(1 TeV) tbH
±(a)
b-tagged jet multiplicity
2 3 4 5 6 7 8
Fraction of Events
0 0.2 0.4 0.6 0.8 1 1.2
≥
2b
≥
7j, 0l,
=13 TeV, 13.2 fb
-1s
Simulation Preliminary ATLAS
Total background doublet (1 TeV) T
T
singlet (1 TeV) T
T
(1 TeV) t
→
ZtZ T T
(b)
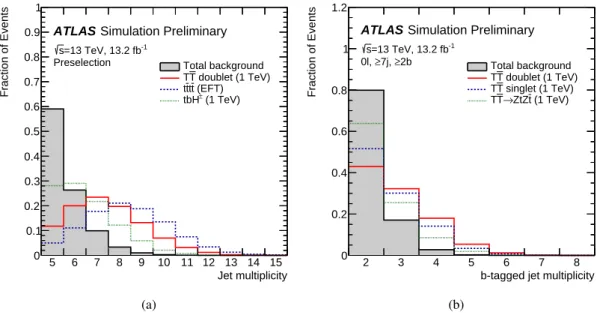
Figure 4: Comparison of the shape of (a) the jet multiplicity distribution in the 1-lepton channel after preselection, and (b) the b -tag multiplicity distribution in the 0-lepton channel after preselection plus the requirement of ≥ 7 jets, between the total background (shaded histogram) and several signal scenarios considered in this search. The signals shown are: T T ¯ production in the weak-isospin doublet and singlet scenarios, and for BR (T → Zt ) = 1, assuming m
T= 1 TeV; t tt ¯ t ¯ production within an EFT model; and tbH
±( → tb) production assuming m
H±= 1 TeV. The last bin in both figures contains the overflow.
Ht Zt and HtW b . For the dominant H → b b ¯ decay mode, the final-state signature is characterised by high jet8 and b -tag multiplicities, which provide a powerful experimental handle to suppress the background.
The presence of high-momentum Z bosons decaying into ν ν ¯ or W bosons decaying leptonically, either to an electron or muon that is not reconstructed, or to a hadronically-decaying τ -lepton that is identified as a jet, yields in addition high E miss
T , which is exploited by the 0-lepton search. Both searches have also some sensitivity to T T ¯ → Zt Zt and ZtW b , with Z → b b ¯ . High jet and b -tag multiplicities are also characteristic of t¯ tt t ¯ events (both within the SM and in BSM extensions), as well as of bbH(→ tt) tt H (→ tt) and tbH ± (→ tb) production. Since most of these signal scenarios do not feature large E miss
T , only the 1-lepton search is used to probe them, without a dedicated re-optimisation.
In Figure 4(a) the shape of the jet multiplicity distribution in the 1-lepton channel after preselection (described in Section 4) is compared between the total background and several signal scenarios, chosen to illustrate differences among various types of signals the search is sensitive to. In both the 1-lepton and 0-lepton channels, signal events have, on average, higher jet multiplicity than the background, which after preselection is dominated by t t ¯ +jets processes. The higher b -quark content of signal events results in a higher b -tag multiplicity than for the background, as illustrated in Figure 4(b) for events in the 0-lepton channel after preselection plus the requirement of ≥ 7 jets.
Compared to Run 1, the larger centre-of-mass energy in Run 2 allows probing of higher-mass signals, which decay into boosted heavy SM particles ( W and Z bosons, Higgs bosons, and top quarks), potentially giving rise to a high multiplicity of large- R jets capturing their decay products. This fact can be exploited
8
In the following, the term “jet” is used to refer to a small- R jet, while the term “mass-tagged jet” denotes a large- R jet satisfying
several kinematic criteria described in Section 3.
Large-R jet mass [GeV]
0 50 100 150 200 250 300 350 400 450 500
Fraction of Jets / 10 GeV
0 0.02 0.04 0.06 0.08 0.1 0.12 0.14
≥
2b
≥
6j, 1l,
=13 TeV, 13.2 fb
-1s
Simulation Preliminary ATLAS
Total background doublet (1 TeV) T
T (EFT) t t t t
(1 TeV) tbH
±(a)
Mass-tagged jet multiplicity
0 1 2 3 4 5
Fraction of Events
0 0.2 0.4 0.6 0.8 1 1.2
≥
2b
≥
7j, 0l,
=13 TeV, 13.2 fb
-1s
Simulation Preliminary ATLAS
Total background doublet (1 TeV) T
T
singlet (1 TeV) T
T
(1 TeV) t
→
ZtZ T T
(b)
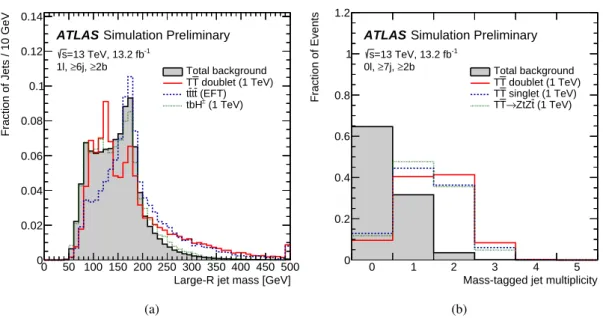
Figure 5: Comparison of the shape of (a) the invariant mass distribution of selected large- R jets (prior to mass- tagging requirements), and (b) the mass-tagged jet multiplicity distribution, between the total background (shaded histogram) and several signal scenarios considered in this search. The signals shown are: T T ¯ production in the weak-isospin doublet and singlet scenarios, and for BR (T → Zt ) = 1, assuming m
T= 1 TeV; t¯ tt t ¯ production within an EFT model; and tbH
±( → tb) production assuming m
H±= 1 TeV. The selection used in (a) corresponds to events in the 1-lepton channel satisfying the preselection requirements and ≥ 6 jets, whereas the selection used in (b) corresponds to events in the 0-lepton channel satisfying the preselection requirements and ≥ 7 jets. The last bin in both figures contains the overflow.
to further discriminate signal from background events. Figure 5(a) compares the shape of the invariant mass distribution of large- R jets satisfying the kinematic requirements described in Section 3, except for the mass requirement, between the total background and several signal scenarios. The requirement that the large- R jet mass is above 100 GeV is used in this analysis to identify boosted top-quark and Higgs-boson candidates. While t¯ t +jets events in the 1-lepton and 0-lepton channels are expected to contain up to one mass-tagged jet from a boosted, hadronically-decaying top quark, the signal events of interest are characterised by higher mass-tagged jet multiplicity, as illustrated in Figure 5(b).
In order to optimise the sensitivity of the searches, the selected events are categorised into different regions
depending on the jet multiplicity (5 and ≥ 6 jets in the 1-lepton channel; 6 and ≥ 7 jets in the 0-lepton
channel), b -tag multiplicity (2, 3 and ≥ 4) and mass-tagged jet multiplicity (0, 1 and ≥ 2). In the following,
channels with N mass-tagged jets, n jets, and m b -tagged jets are denoted as ( N J, n j, m b). In addition,
events in particular regions are further categorised by exploiting the kinematic features of the signal and
the background. In the case of the T T ¯ → Ht +X signal at high values of m T , the Higgs boson from the
T → Ht decay has high p T , and the b b ¯ pair from the Higgs boson decay has smaller angular separation
than pairs resulting from combinatorial background. Figure 6(a) shows the distribution of the invariant
mass of the two b -tagged jets with lowest ∆R separation, m min bb ∆R , for events in the (1J, ≥ 6j, ≥ 4b) region
of the 1-lepton channel. This distribution, which for signal shows a clear peak near 125 GeV, allows the
classification of events into two regions depleted or enriched in T → Ht , H → b b ¯ decays, by requiring
m min bb ∆R < 100 GeV (referred to as “LM”, standing for “low mass”) or m min bb ∆R > 100 GeV (referred to
as “HM”, standing for “high mass”). The m min bb ∆R variable is only used in the 1-lepton channel. In the
[GeV]
∆R min
m
bb0 50 100 150 200 250 300 350 400 450 500
Fraction of Events / 10 GeV
0 0.02 0.04 0.06 0.08 0.1 0.12 0.14 0.16 0.18 0.2
≥
4b
≥
6j, 1l, 1J,
=13 TeV, 13.2 fb
-1s
Simulation Preliminary ATLAS
Total background doublet (1 TeV) T
T (EFT) t t t t
(1 TeV) tbH
±(a)
[GeV]
b T,min
m
0 100 200 300 400 500 600 700
Fraction of Events / 20 GeV
0 0.02 0.04 0.06 0.08 0.1 0.12 0.14 0.16 0.18
7j, 3b
≥
≥
2J, 0l,
=13 TeV, 13.2 fb
-1s
Simulation Preliminary ATLAS
Total background doublet (1 TeV) T
T
singlet (1 TeV) T
T
(1 TeV) t
→
ZtZ T T
(b)
Figure 6: Comparison of the shape of (a) the invariant mass distribution of the two b -tagged jets with lowest ∆R separation ( m
minbb∆R), and (b) the distribution of the minimum transverse mass between E
missT
and any of the three leading b -tagged jets in the event ( m
bT,min
), between the total background (shaded histogram) and several signal scenarios considered in this search. The signals shown are: T T ¯ production in the weak-isospin doublet and singlet scenarios, and for BR (T → Zt) = 1, assuming m
T= 1 TeV; t tt ¯ t ¯ production within an EFT model; and tbH
±(→ tb) production assuming m
H±= 1 TeV. The selection used in (a) corresponds to events in the (1J, ≥ 6j, ≥ 4b) region of the 1-lepton channel, whereas the selection used in (b) corresponds to events in the ( ≥ 2J, ≥ 7j, 3b) region of the 0-lepton channel. The last bin in both figures contains the overflow.
0-lepton channel, a different variable is used: m b
T , min , the minimum transverse mass between E miss
T and
any of the three leading b -tagged jets in the event. This variable exhibits excellent separation between signal and background, which shows a jabobian peak around the top quark mass, as shown in Figure 6(b) for events in the ( ≥ 2J, ≥ 7j, ≥ 3b) region of the 0-lepton channel. Therefore, two regions are defined:
m b
T , min < 160 GeV (referred to as "LM", standing for "low mass") and m b
T , min > 160 GeV (referred to as
"HM", standing for "high mass"), the latter having a higher signal-to-background ratio than the former.
The regions with ≥ 6 jets ( ≥ 7 jets) are used to perform the actual search in the 1-lepton (0-lepton) channel, whereas the regions with exactly 5 jets (6 jets) are used to validate the background modelling in different regimes of event kinematics and heavy-flavour content. A total of eight search regions and six validation regions are considered in the 1-lepton channel, whereas twelve search regions and nine validation regions are considered in the 0-lepton channel, defined in Tables 2 and 3 respectively.
To further improve the separation between the T T ¯ signal and background, the distinct kinematic features of
the signal are exploited. In the case of T T ¯ signal, the large T quark mass results in leptons and jets with large
energy in the final state and the effective mass ( m eff ), defined as the scalar sum of the transverse momenta
of the lepton, the selected jets and the missing transverse momentum, provides a powerful discriminating
variable between signal and background. In this case, the m eff distribution peaks at approximately 2 m T
for signal events and at lower values for the t t ¯ +jets background. The different t tt¯ ¯ t signals, particularly
those from BSM scenarios, also populate high values of m eff , whereas signals from associated heavy
Higgs boson production are typically softer in this variable. The m eff distribution is used in all regions
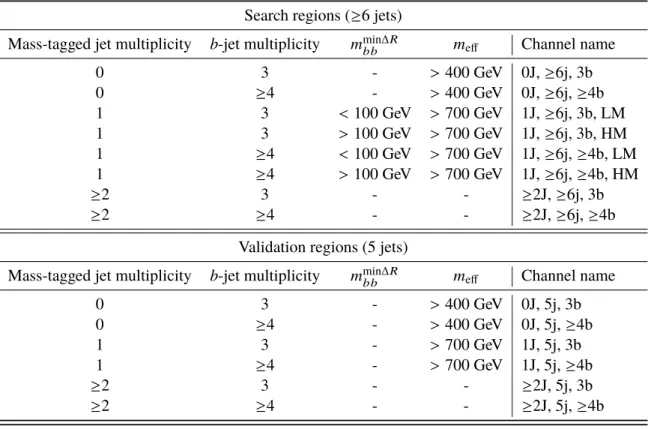
Search regions ( ≥ 6 jets)
Mass-tagged jet multiplicity b -jet multiplicity m min bb ∆R m eff Channel name
0 3 - > 400 GeV 0J, ≥ 6j, 3b
0 ≥ 4 - > 400 GeV 0J, ≥ 6j, ≥ 4b
1 3 < 100 GeV > 700 GeV 1J, ≥ 6j, 3b, LM
1 3 > 100 GeV > 700 GeV 1J, ≥ 6j, 3b, HM
1 ≥ 4 < 100 GeV > 700 GeV 1J, ≥ 6j, ≥ 4b, LM
1 ≥ 4 > 100 GeV > 700 GeV 1J, ≥ 6j, ≥ 4b, HM
≥ 2 3 - - ≥ 2J, ≥ 6j, 3b
≥ 2 ≥ 4 - - ≥ 2J, ≥ 6j, ≥ 4b
Validation regions (5 jets)
Mass-tagged jet multiplicity b -jet multiplicity m min bb ∆R m eff Channel name
0 3 - > 400 GeV 0J, 5j, 3b
0 ≥ 4 - > 400 GeV 0J, 5j, ≥ 4b
1 3 - > 700 GeV 1J, 5j, 3b
1 ≥ 4 - > 700 GeV 1J, 5j, ≥ 4b
≥ 2 3 - - ≥ 2J, 5j, 3b
≥ 2 ≥ 4 - - ≥ 2J, 5j, ≥ 4b
Table 2: Definition of the search and validation regions (see text for details) in the 1-lepton channel.
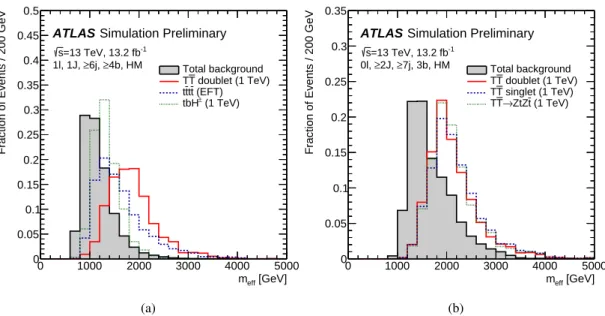
considered in this search. In the 1-lepton channel, an additional selection requirement of m eff > 400 GeV ( m eff > 700 GeV) is made for regions with exactly zero (one) mass-tagged jets, in order to minimise the effect of a possible mismodelling of the m eff distribution at low values originating from small backgrounds with large systematic uncertainties, such as multijet production. Since the T T ¯ signal is characterised by having at least one mass-tagged jet and large values of m eff , this minimum requirement on m eff has no impact on the search sensitivity. As an example, Figure 7 compares the m eff distribution between signal and background for events in two signal-rich regions of the 0-lepton and 1-lepton channels. The kinematic requirements in these regions result in a significantly harder m eff spectrum for the background than in regions without mass-tagged jets, but this variable still presents good discrimination between signal and background.
The overall rate and composition of the t t ¯ +jets background strongly depends on the jet and b -tag multi- plicities, as illustrated in Figure 8. The t¯ t +light-jets background is dominant in events with exactly two or three b -tagged jets. The former typically consists of events with the two b -quarks from the top quark decays being tagged, while the latter is dominated by events where in addition a charm quark from the hadronic W boson decay is tagged. Contributions from t¯ t + ≥ 1 c and t t ¯ + ≥ 1 b become significant as the b -tag multiplicity increases, with the t t ¯ + ≥ 1 b background being dominant for events with ≥ 4 b -tagged jets. The regions with different mass-tagged jet multiplicities allow probing different kinematic regimes, both soft (e.g. low-mass T quark, SM t tt¯ ¯ t ) and hard (e.g. high-mass T quark or BSM t tt¯ ¯ t production).
The search regions with the higher multiplicities of mass-tagged jets and b -tagged jets typically have the
largest signal-to-background ratio, and therefore drive the sensitivity of the search. The rest of search
regions have significantly lower signal-to-background ratios, but they are useful for checking and correct-
Search regions ( ≥ 7 jets) Mass-tagged jet multiplicity b -jet multiplicity m b
T , min Channel name
0 2 - 0J, ≥ 7j, 2b
0 3 - 0J, ≥ 7j, 3b
0 ≥ 4 - 0J, ≥ 7j, ≥ 4b
1 2 - 1J, ≥ 7j, 2b
1 3 < 160 GeV 1J, ≥ 7j, 3b, LM
1 3 > 160 GeV 1J, ≥ 7j, 3b, HM
1 ≥ 4 < 160 GeV 1J, ≥ 7j, ≥ 4b, LM
1 ≥ 4 > 160 GeV 1J, ≥ 7j, ≥ 4b, HM
≥ 2 2 - ≥ 2J, ≥ 7j, 2b
≥ 2 3 < 160 GeV ≥ 2J, ≥ 7j, 3b, LM
≥ 2 3 > 160 GeV ≥ 2J, ≥ 7j, 3b, HM
≥ 2 ≥ 4 - ≥ 2J, ≥ 7j, ≥ 4b
Validation regions (6 jets) Mass-tagged jet multiplicity b -jet multiplicity m b
T , min Channel name
0 2 - 0J, 6j, 2b
0 3 - 0J, 6j, 3b
0 ≥ 4 - 0J, 6j, ≥ 4b
1 2 - 1J, 6j, 2b
1 3 - 1J, 6j, 3b
1 ≥ 4 - 1J, 6j, ≥ 4b
≥ 2 2 - ≥ 2J, 6j, 2b
≥ 2 3 - ≥ 2J, 6j, 3b
≥ 2 ≥ 4 - ≥ 2J, 6j, ≥ 4b
Table 3: Definition of the search and validation regions (see text for details) in the 0-lepton channel.
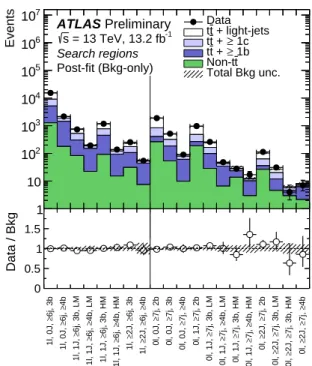
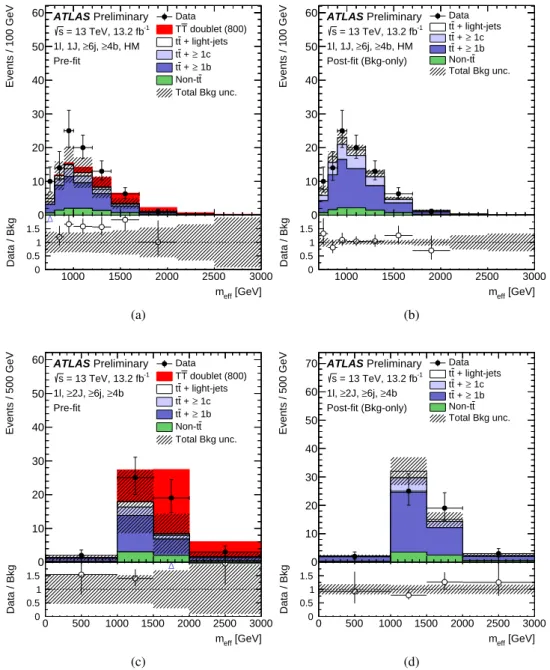
ing the t¯ t +jets background prediction and constraining the related systematic uncertainties (see Section 8) through a likelihood fit to data (see Section 9). This is particularly important in the context of the t¯ t + ≥ 1 b normalisation, which is underestimated by the simulation, leading to a deficit in the prediction relative to the data that is most apparent in the channels with ≥ 4 b -tagged jets (see Figure 8). Such a fitting strategy was followed in the Run 1 search in the 1-lepton channel [18].9 A summary of the observed and expected yields before the fit to data in four of the most sensitive search regions in the 1-lepton and 0-lepton channels can be found in Tables 4 and 5 respectively. The search regions shown in Table 4 for the 1-lepton channel, all requiring ≥ 4 b -tagged jets but with different requirements on mass-tagged multiplicity, are a selection of some of the regions with the highest S/ √
B ratio (where S and B are the expected signal and background yields respectively) across several signal benchmark scenarios considered ( T T ¯ in the T doublet scenario, t tt¯ ¯ t within SM and BSM, associated heavy Higgs boson production). Similarly, the search regions shown in Table 5 for the 0-lepton channel are a superset of the regions with the highest S/ √
B ratio for different T T ¯ signal benchmark scenarios ( T doublet, T singlet and BR( Z → Ht ) = 1).
9
In this analysis, a difference is that regions with exactly 5 jets are not included in the fit but instead used as validation regions.
[GeV]
m
eff0 1000 2000 3000 4000 5000
Fraction of Events / 200 GeV
0 0.05 0.1 0.15 0.2 0.25 0.3 0.35 0.4 0.45 0.5
4b, HM
≥
≥
6j, 1l, 1J,
=13 TeV, 13.2 fb
-1s
Simulation Preliminary ATLAS
Total background doublet (1 TeV) T
T (EFT) t t t t
(1 TeV) tbH
±(a)
[GeV]
m
eff0 1000 2000 3000 4000 5000
Fraction of Events / 200 GeV
0 0.05 0.1 0.15 0.2 0.25 0.3 0.35
7j, 3b, HM
≥
≥
2J, 0l,
=13 TeV, 13.2 fb
-1s
Simulation Preliminary ATLAS
Total background doublet (1 TeV) T
T
singlet (1 TeV) T
T
(1 TeV) t
→
ZtZ T T
(b)
Figure 7: Comparison of the shape of the distribution of the scalar sum of the transverse momenta of the lepton, the selected jets and the missing transverse momentum ( m
eff) between the total background (shaded histogram) and several signal scenarios considered in this search. The signals shown are: T T ¯ production in the weak-isospin doublet and singlet scenarios, and for BR (T → Zt ) = 1, assuming m
T= 1 TeV; t tt ¯ t ¯ production within an EFT model; and tbH
±(→ tb) production assuming m
H±= 1 TeV. The selection used in (a) corresponds to events in the (1J, ≥ 6j,
≥ 4b, HM) region of the 1-lepton channel, whereas the selection used in (b) corresponds to events in the ( ≥ 2J, ≥ 7j,
3b, HM) region of the 0-lepton channel. The last bin in both figures contains the overflow.
6j, 3b≥1l, 0J, 4b≥6j, ≥1l, 0J, 6j, 3b, LM≥1l, 1J, 4b, LM≥6j, ≥1l, 1J, 6j, 3b, HM≥1l, 1J, 4b, HM≥6j, ≥1l, 1J, 6j, 3b≥2J, ≥1l, 4b≥6j, ≥2J, ≥1l, 7j, 2b≥0l, 0J, 7j, 3b≥0l, 0J, 4b≥7j, ≥0l, 0J, 7j, 2b≥0l, 1J, 7j, 3b, LM≥0l, 1J, 4b, LM≥7j, ≥0l, 1J, 7j, 3b, HM≥0l, 1J, 4b, HM≥7j, ≥0l, 1J, 7j, 2b≥2J, ≥0l, 7j, 3b, LM≥2J, ≥0l, 7j, 3b, HM≥2J, ≥0l, 4b≥7j, ≥2J, ≥0l,