A TLAS-CONF-2016-090 10 August 2016
ATLAS NOTE
ATLAS-CONF-2016-090
4th August 2016
Measurement of the W + W − production cross section in p p collisions at a centre-of-mass energy of √
s = 13 TeV with the ATLAS experiment
The ATLAS Collaboration
Abstract
The production of opposite-charge W-boson pairs in proton–proton collisions at √ s = 13 TeV is measured using data corresponding to 3.16 fb −1 of integrated luminosity collected by the ATLAS detector at the CERN Large Hadron Collider. Candidate W-boson pairs are selected by identifying their leptonic decays into an electron, a muon and neutrinos. Events with reconstructed jets are not included in the candidate event sample. The cross-section measurement is performed in a fiducial phase space close to the experimental acceptance and is compared to theoretical predictions. Agreement is found between the measurement and the highest order calculations available in Quantum Chromodynamics.
© 2016 CERN for the benefit of the ATLAS Collaboration.
1 Introduction
The measurement of the production properties of opposite-charge W -boson pairs (denoted as W W in this note) is an important test of the Standard Model (SM) of particle physics. This process is sensitive to the strong interaction between quarks and gluons and probes the electroweak gauge structure of the SM.
Measurements of W W production were first conducted at LEP [1] using electron–positron collisions.
Measurements in hadron collisions were first carried out at the Tevatron by the CDF [2, 3] and DØ [4, 5] collaborations. At the Large Hadron Collider (LHC), the W W production cross sections have been measured for centre-of-mass energies of √
s = 7 TeV and √
s = 8 TeV by the ATLAS [6, 7] and CMS [8, 9] collaborations. In order to match the experimental precision and address discrepancies between data and theory reported in some of the 8 TeV results, significant progress has been made in theoretical cal- culations to include higher-order corrections in perturbative Quantum Chromodynamics (pQCD) [10–
15]. The W W signal is composed of three leading sub-processes, which are q q ¯ → W W production 1 (in the t- and s-channels), the non-resonant gg → W W production and the resonant gg → H → W W production (both gg-initiated processes occurring through a quark loop). These sub-processes are known theoretically at di ff erent orders in the strong coupling constant α s .
This note describes a measurement of W W production at √
s = 13 TeV with the ATLAS detector using the data collected during the 2015 run. The cross section is measured within a phase space close to the geometric and kinematic acceptance of the experimental analysis, i.e. a fiducial phase space, in the W W → e ± νµ ∓ ν (denoted in the following as W W → eµ) decay channel. In addition, the ratio of cross sections at 13 TeV and 8 TeV centre-of-mass energies in the respective fiducial phase spaces is presented.
Both measurements are compared to the latest theoretical predictions.
2 The ATLAS detector
The ATLAS detector [16] is a multi-purpose particle detector with a cylindrical geometry.2 It consists of layers of inner tracking detectors surrounded by a superconducting solenoid, calorimeters, and muon chambers. The inner detector (ID) is situated inside a 2 T magnetic field generated by the solenoid and provides precision tracking for charged particles with pseudorapidity |η | < 2.5. The calorimeter covers the pseudorapidity range |η | < 4.9. Within |η| < 2.47 the finely segmented electromagnetic calorimeter identifies electromagnetic showers and measures their energy and position, providing electron identification together with the ID. The muon spectrometer (MS) surrounds the calorimeters and provides muon identification and measurement in the region |η | < 2.7 and triggering in the region |η| < 2.4. A two-level trigger system is used to select events in real time. It consists of a hardware-based first-level trigger and a software-based high-level trigger. The latter uses reconstruction software with algorithms similar to the offline versions.
1
In this note, the notation q q ¯ → W W is used to include both q q ¯ and qg initial states for W W production.
2
The ATLAS experiment uses a right-handed coordinate system with its origin at the nominal pp interaction point at the centre of the detector. The positive x-axis is defined by the direction from the interaction point towards the centre of the LHC ring, with the positive y-axis pointing upwards, while the beam direction defines the z-axis. Cylindrical coordinates (r, φ ) are used in the transverse (x, y) plane, φ being the azimuthal angle around the beam direction. The pseudorapidity is defined in terms of the polar angle θ from the z-axis as η = − ln[tan(θ/2)]. The distance in η–φ space between two objects is defined as
∆R ≡ q
(∆ η)
2+ (∆ φ)
2. Transverse energy is computed as E
T= E · sin θ.
3 Data and Monte Carlo samples
The analysis is based on data collected with the ATLAS detector during the 2015 data taking period.
Events with pp collisions at √
s = 13 TeV and all relevant detector components fully functional have been used. This data sample corresponds to an integrated luminosity of L =3.16 fb − 1 .
Monte Carlo (MC) generators are used to model signal and background processes. Diboson processes (W W,W Z/γ ∗ and on / o ff -shell Z Z) with q q ¯ initial states are simulated at the next-to-leading order (NLO) in pQCD with POWHEG-BOX v2 generator [17–21] that uses CT10 NLO [22] parton density functions (PDF) and is interfaced to PYTHIA v8.210 [23] with the set of tuned parameters as in AZNLO [24] and CTEQ6L1 [25] PDF for the modelling of the parton shower and of non-perturbative e ff ects. The lower limit on the invariant mass of the decay leptons from the Z and γ in the on-/off-shell Z Z and W/Z γ ∗ samples is set to m `` > 7 GeV. A sample of W Z/γ ∗ events generated with SHERPA v2.1.1 [26] with m `` >
0.45 GeV was used to study systematic uncertainties. The EvtGen v1.2.0 [27] program is used for the properties of the bottom and charm hadron decays. The cross sections given by the generator are at NLO in QCD while the W W , W Z and Z Z samples are normalised to their respective inclusive next-to-next- to-leading order (NNLO) predicted cross sections [10, 28–30]. The configuration of the POWHEG-BOX v2 generator, as described above, reproduces the distribution predicted by NNLO calculations matched to resummation calculations up to next-to-next-to-leading logarithm (NNLL) [10, 11] for the transverse momentum of the W W system (p W W T ) in the range relevant to this analysis, hence no further steps are taken to explicitly include resummation effects into the W W signal samples. The resonant gg → H → W W signal contribution is simulated with the POWHEG-BOX v2 generator [31] and normalised to the inclusive N 3 LO predicted cross section [32]. The non-resonant gg → W W signal contribution is modelled with SHERPA v2.1.1 at leading order (LO) using OpenLoops with up to one additional parton in the final state [33] and normalised to the inclusive NLO predicted cross section [34].
The Z (→ ee/µµ/ττ) + jets production processes are simulated with the MadGraph5[35] generator in- terfaced to PYTHIA v8. The matrix elements for Z production with up to four associated partons are calculated at LO and the PDF set used is NNPDF2.3 LO [36]. Alternative samples of Z(→ ττ) + jets are produced with di ff erent MC generators for the evaluation of modelling systematic uncertainties:
POWHEG-BOX v2 with NLO matrix elements interfaced to PYTHIA v8, and SHERPA v2.2 with NLO mat- rix element accuracy up to two associated partons and with LO accuracy for three and four associated partons. The Z + jets events are normalised to the NNLO Z cross section [37]. The SHERPA v2.1.1 event generator is used to model the W γ and Z γ processes at LO using the CT10 NLO PDF set.
The POWHEG-BOX v2 generator [38, 39] with CT10 NLO PDF is used for the generation of t t ¯ and single top quarks in the W t channel. Parton shower, fragmentation, and the underlying event are simulated using PYTHIA v6.428 [40] with CTEQ6L1 PDF and the set of parameters as in Perugia 2012 [41].
The top quark mass is set to 172.5 GeV and EvtGen v1.2.0 is used for properties of the bottom and charm hadron decays. Alternative samples are generated with di ff erent settings to assess the modelling uncertainty on top-quark events. For estimating the effect of parton shower and hadronisation modelling an alternative sample is generated with the POWHEG-BOX v2 generator interfaced to HERWIG++ [42]. A comparison between this sample and a di ff erent one produced with Madgraph5_aMC@NLO [35] interfaced to HERWIG++ is used to assess the impact of the matrix-element implementation and the matching to the parton showers. Separate alternative samples are also generated with POWHEG-BOX v2 interfaced to PYTHIA v6 with extra jet radiation emitted in the matrix element and in the parton shower. In addition, the modelling of the overlap at NLO between W t and t¯ t diagrams [43] is studied. The effect is assessed
events with different schemes for overlap removal using the
interfaced to PYTHIA v6 for the simulation of parton showering and non-perturbative e ff ects. These samples are simulated following the recommendations documented in Ref. [44]. The t t ¯ samples are normalised to the NNLO + NNLL soft gluon resummation prediction [45], while the W t samples are normalised to the NLO + NNLL prediction [46].
The generated samples are passed through a simulation of the ATLAS detector based on GEANT4 [47, 48]. They are overlaid with additional proton–proton interactions (pile-up) generated with PYTHIA v8 and the distribution of the average number of interactions per bunch crossing is reweighted to agree with the corresponding data distribution. The simulated events are reconstructed and analysed with the same algorithms as the data and are corrected with data-driven correction factors to account for di ff erences between data and simulation on lepton and jet reconstruction and identification.
4 Event reconstruction and selection
The W W event candidates are selected by requiring exactly one electron and one muon of opposite charge in the event, and significant missing transverse momentum, as described below. Events with a same- flavour lepton pair are not used because they have larger background from the Drell–Yan process.
Candidate events are preselected by either a single-muon or single-electron trigger with transverse mo- mentum p T > 20 GeV and 24 GeV respectively. The e ffi ciency of the trigger at selecting W W events is approximately 99% for events that pass the offline selection.
Leptons are required to originate from the primary vertex, defined as the reconstructed vertex with the largest sum of the p 2 T of the associated tracks. The longitudinal impact parameter of each lepton track, defined as the distance between the track and the primary vertex along the beam line multiplied by the sine of the track θ angle, is required to be less than 0.5 mm. Furthermore, the significance of the transverse impact parameter calculated with respect to the beam line, |d 0 /σ d
0|, is required to be less than 3.0 (5.0) for muons (electrons).
Electron candidates are reconstructed from a combination of a cluster of energy deposits in the elec- tromagnetic calorimeter and a track in the ID [49]. Candidate electrons must satisfy the Tight quality definition described in Ref. [49]. Muon candidates are reconstructed by combining tracks in the ID and MS [50]. The Medium criterion, as defined in Ref. [50], is applied on the combined tracks. The leptons are required to be isolated using ID track information and calorimeter energy cluster information in a cone around the lepton. The expected isolation efficiency is at least 90% (99%) at p T of 25 (60) GeV using a so-called gradient working point [49, 50].
Jet candidates are reconstructed within the calorimeter acceptance using the anti-k t jet clustering al-
gorithm [51] with a radius parameter of R = 0.4 that combines clusters of topologically connected calor-
imeter cells [52]. The jet energy is calibrated by applying a p T and η-dependent correction derived from
MC simulation with additional corrections based on data [53]. As part of the jet energy calibration a pile-
up correction based on the concept of jet area is applied to the jet candidates [54]. The jet-vertex-tagger
[55] (JVT) technique is used to separate hard-scatter jets from pile-up jets within the acceptance of the
tracking detector ( |η | < 2.4) by requiring the jet to have a significant fraction of its associated tracks with
an origin compatible with the primary vertex. A jet-vertex-tagger requirement of JVT > 0.64 for jets
with p T < 50 GeV is applied. This requirement has an e ffi ciency that increases with the jet p T and is in
the range of 87–98% in selecting hard-scatter jets with p T in the range 20 GeV < p T < 50 GeV. Candid-
ate jets are discarded if they lie within a cone of ∆R < 0.2 around an electron or, for jets with less than
three associated tracks, around a muon candidate. For jets with three or more associated tracks within
∆R < 0.4 of muons, or 0.2 < ∆R < 0.4 of electrons, the corresponding lepton candidate is discarded.
Jets originating from the fragmentation of b-hadrons (b-jets) are identified using a multivariate algorithm [56] and an operating point with 85% e ffi ciency for selecting jets containing b-hadrons, as measured in t¯ t events, and a rejection factor of 28 for light-quark jets.
The missing transverse momentum is computed as the negative of the vectorial sum of the transverse momenta of the reconstructed objects selected in the analysis, i.e. electrons, muons and jets, and a soft term based on the tracks associated with the primary vertex but not with the hard objects explicitly used in the missing transverse momentum computation [57]. The magnitude of the missing transverse momentum is denoted as E T miss in the following. The jet selection in the E T miss computation is optimised for E T miss performance with the requirements of p T > 20 GeV for all jets, and an additional JVT > 0.64 requirement for jets in the central region. In Drell–Yan production of τ-lepton pairs with subsequent decay to an e-µ pair E T miss tends to align with a final-state lepton. To suppress this contamination a requirement is imposed on the missing transverse momentum component perpendicular to the direction in the r –φ plane of the lepton closest to the E T miss direction, as defined in Ref. [7]. This variable is denoted in the following as E T, miss Rel . In addition a more pile-up robust track-based missing transverse momentum variable, of magnitude p miss T , is computed within the ID acceptance [57].
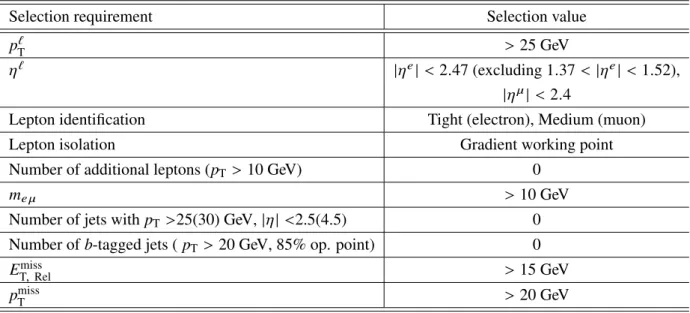
W W candidate events are required to have one electron and one muon, each with p T > 25 GeV, of opposite charge. The electron is required to be in the region of |η | < 2.47, excluding the transition region between the barrel and endcap calorimeters. For the muon |η | < 2.4 is required. To reduce the background from other diboson processes, the events are required to have no additional electron or muon with p T > 10 GeV.
To suppress the background contribution from top quarks, events are required to have no jets with p T
>25 (30) GeV in |η | < 2.5(4.5) and no b-jets with p T > 20 GeV. In addition, the requirements E T, miss Rel
> 15 GeV, p miss T > 20 GeV, and the invariant mass of the lepton pair m e µ > 10 GeV suppress Drell–Yan background contributions. The lepton, jet and event selection criteria are summarised in Table 1.
Selection requirement Selection value
p T ` > 25 GeV
η ` |η e | < 2.47 (excluding 1.37 < |η e | < 1.52),
|η µ | < 2.4
Lepton identification Tight (electron), Medium (muon)
Lepton isolation Gradient working point
Number of additional leptons (p T > 10 GeV) 0
m e µ > 10 GeV
Number of jets with p T >25(30) GeV, |η | <2.5(4.5) 0 Number of b-tagged jets ( p T > 20 GeV, 85% op. point) 0
E T, miss Rel > 15 GeV
p T miss > 20 GeV
Table 1: Object and event selection criteria for W W candidate events. In the table ` stands for e and µ. The
definitions of identification and isolation are given in Refs. [50] and [49].
5 Background estimation
After applying the event selection requirements described in Section 4, the dominant background in the W W candidate sample is top-quark (t¯ t and single top) production with neither jet nor b-jet above the veto thresholds within the acceptance. Drell–Yan production of a τ-lepton pair with leptonic decays of τ leptons can also give rise to the e µ final state. The W +jets production with leptonic W decay and a jet misidentified as a lepton, or multi-jet production with two jets misidentified as leptons (collectively re- ferred to as W + jets background below) can be mistakenly accepted as candidate events. This background category includes events where an electron or a muon is produced from a semileptonic decay of a bottom or charm hadron. Other diboson (W Z/γ ∗ , Z Z, W γ) production constitutes a smaller background contri- bution. Minor background processes are modelled with MC simulations, while data-driven methods are used to determine the dominant backgrounds and backgrounds with a misidentified lepton. The normal- isations of top-quark and Drell–Yan backgrounds are determined from dedicated control regions.
The top-quark background control region is defined requiring at least one b-jet with p T > 20 GeV in an event sample selected with the same lepton criteria as the signal region, exactly one jet of p T > 25 GeV, and no requirement on E T, miss Rel . In this control region the top purity is enhanced to an estimated value of 93%. The top-quark background is normalised to data in this control region and both detector and modelling uncertainties affect the extrapolation of t¯ t and W t from the control region to the signal region. These include 6% (10%) uncertainties on the t¯ t (W t) cross section as well as the modelling of the parton shower and initial state jet radiation. For the t¯ t process the uncertainties also include the choice of the MC matrix-element generator, while for the W t process they include the modelling of the overlap and interference at NLO between W t and t¯ t diagrams by comparing the nominal W t MC sample with an alternative sample generated with a di ff erent scheme for overlap removal. The modelling uncertainties on t t ¯ and W t processes are estimated by comparing the results from the different MC samples presented in Section 3.
The event characteristics of eµ final states from Drell–Yan production of τ-lepton pairs includes an e µ invariant mass below the Z mass, and lower E T miss . In the Drell–Yan background control region, the e µ invariant mass is required to be 45 < m e µ < 80 GeV, and either or both the E T, miss Rel or the p miss T requirements are reversed to make the sample orthogonal to that in the signal region while all other selection requirements remain the same. The Drell–Yan control region has a purity of about 95%, and the Drell–Yan modelling uncertainties are taken into account by comparing di ff erent MC generators, as discussed in Section 3.
Determining the background from W + jets production requires good knowledge of the lepton misiden- tification rate which is best derived from data. The estimation of the yield of W + jets production is determined using data event samples that are selected with different lepton selection criteria: a loose lepton identification criterion is defined, and leptons are selected using either the loose or the default (as in the signal region) lepton identification criteria, and events are classified according to the types of lepton identification criteria the leptons passed. With the introduction of the efficiencies of the default lepton identification relative to the loose lepton identification for both real and misidentified leptons, a system of four equations can be solved to estimate the number of events passing the default lepton iden- tification criteria. This follows the same procedure as that described in Ref. [7]. For electrons, the loose identification corresponds to the medium criterion defined in Ref. [49] without isolation requirements.
For muons, the loose identification is the same as the default one, except that the isolation requirement is
omitted. The efficiencies for jet misidentification are determined for electrons and muons separately as
a function of the lepton p T and are cross checked with a two-dimensional parametrisation in the lepton
p T and η. These e ffi ciencies are measured using data in a control region with one lepton and at least one jet. The real lepton contributions to the control region are estimated using MC simulation and subtrac- ted. The e ffi ciencies for real leptons are determined from W W MC simulations with correction factors extracted comparing Z → `` events in data and MC simulation. The systematic uncertainties for lepton misidentification include variations of the control region definition, the uncertainties on the cross sections used for the subtraction of the contributions from real leptons and the method bias (non-closure), which is estimated by comparing the prediction for the W + jet background contribution from MC simulation with the result of the experimental method applied on the same MC sample.
The estimate of diboson backgrounds from W Z, Z Z, W γ, Zγ and W γ ∗ processes is based on MC sim- ulation. The uncertainty on the diboson backgrounds is estimated by comparing the yields predicted by two different generators, SHERPA and POWHEG-BOX, for which a difference of 30% is observed.
The observed number of events in the signal region, and top and Drell–Yan control regions, are shown later in Table 3.
6 Fiducial cross-section definition
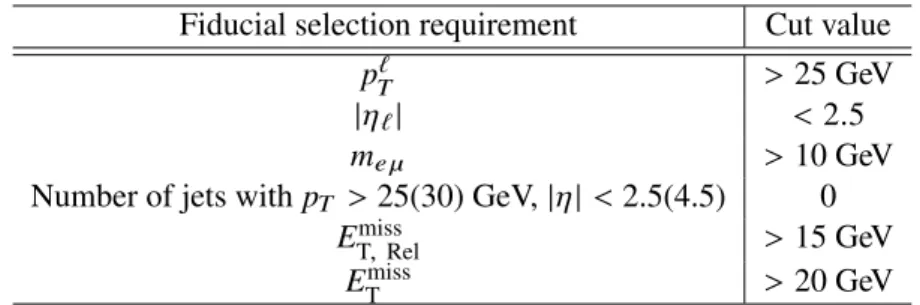
The W W cross section is evaluated in the fiducial phase space of the e µ decay channel. The fiducial phase space is defined in Table 2 as selection criteria on MC events with no detector simulation. Electrons and muons are required at particle level to stem from one of the W bosons produced in the hard scatter and their respective momenta after QED final-state radiation are vectorially added to the momenta of photons emitted in a cone of a radius ∆R = 0.1 around the lepton direction. Final-state particles with lifetime greater than 30 ps are clustered into jets (denoted as particle-level jets) using the same algorithm as for detector-level jets, i.e. with the anti-k t algorithm with radius parameter R = 0.4. Final-state muons and neutrinos are not included in the jet clustering, and a requirement on the distance between the selected W decay lepton and the jet excludes W decay leptons. The fiducial phase space at particle level does not make any requirement on b-quark jets. The missing transverse momentum is defined at particle level as transverse component of the vectorial sum of the neutrino momenta.
The fiducial cross section is determined as
σ W W fid →e µ = N obs − N bkg
C × L , (1)
where L is the integrated luminosity, N obs is the observed number of events, N bkg is the estimated number
of background events and C is a factor that accounts for detector e ff ects, such as detector ine ffi ciencies,
and contributions from τ-lepton decays. The factor C is estimated in simulation as the ratio of the number
of signal events with one electron and one muon (including those from τ decays) passing the selection
requirement at detector level listed in Section 4 to those passing the fiducial selection (excluding W → τν
decays) at particle level. This definition of C corrects for the contribution from W → τν decays, which
is estimated in MC simulations to be 8%, based on their acceptance relative to the signal W W → e µ
channel and the relative branching fractions from Ref. [58].
Fiducial selection requirement Cut value
p T ` > 25 GeV
|η ` | < 2.5
m e µ > 10 GeV
Number of jets with p T > 25(30) GeV, |η | < 2.5(4.5) 0
E T, miss Rel > 15 GeV
E T miss > 20 GeV
Table 2: Definition of the W W → eµ fiducial phase space, where ` = e and µ.
7 Systematic uncertainties
Systematic uncertainties on the W W cross section measurement in the fiducial phase space arise from the reconstruction of leptons and jets, the background determination, and the procedures used to correct for detector effects.
The C factor in Eq. 1 is dominated by detector e ff ects. The uncertainties on the lepton and jet recon- struction a ff ect the signal acceptance in the fiducial phase space. The e ff ects are evaluated by varying the energy or momentum scale and the resolution of leptons and jets, and the correction factors for the trigger, reconstruction, identification and isolation e ffi ciencies within their uncertainties estimated in ded- icated data analyses [49, 50, 53]. Uncertainties in the E T miss reconstruction and b-tagging are also taken into account based on the studies in Ref. [57] and Ref. [56] respectively. The impact of the hard object uncertainties in the E T miss is estimated by individually varying each of their associated uncertainties and recalculating E T miss for each variation. In addition, uncertainties on the scale and resolution of the E T miss soft term are evaluated using data.
The full set of detector uncertainties is taken into account in the data-driven background estimation. The statistical uncertainties stemming from the size of the MC samples used for the background estimates and from the size of the data samples used for data-driven estimations in the control regions are also considered as systematic uncertainties. The uncertainties due to the modelling of background processes in the signal and control regions are evaluated by comparing di ff erent event generators, as discussed in Sections 3 and 5.
Theoretical uncertainties on the C factor are also accounted for. The uncertainties associated to PDFs are estimated by considering the largest value between the CT10 NLO eigenvector uncertainty band at 68% confidence level and the difference among the central values of CT10 NLO, MSTW2008nlo [59] and NNPDF3.0 [60] PDFs. The uncertainty associated to the QCD energy scales is estimated by varying renormalisation (µ R ) and factorisation (µ F ) scales independently by factors 2 and 0.5 with the constraint 0.5 < µ F /µ R < 2. The effects of parton shower, hadronisation and underlying event models (denoted here as parton shower for simplicity) are accounted for by comparing the default MC prediction for W W production that uses PYTHIA v8 for modelling of these effects with the one obtained with the models implemented in HERWIG++.
The uncertainties due to pile-up are estimated by varying the reweighting procedure of the MC samples
used to reproduce the distributions of primary vertices in data. An uncertainty of 2.1% on the integ-
rated luminosity a ff ects the cross-section measurement and the MC-based estimate of backgrounds. It is
determined following the same methodology as that detailed in Ref. [61] based on a calibration of the
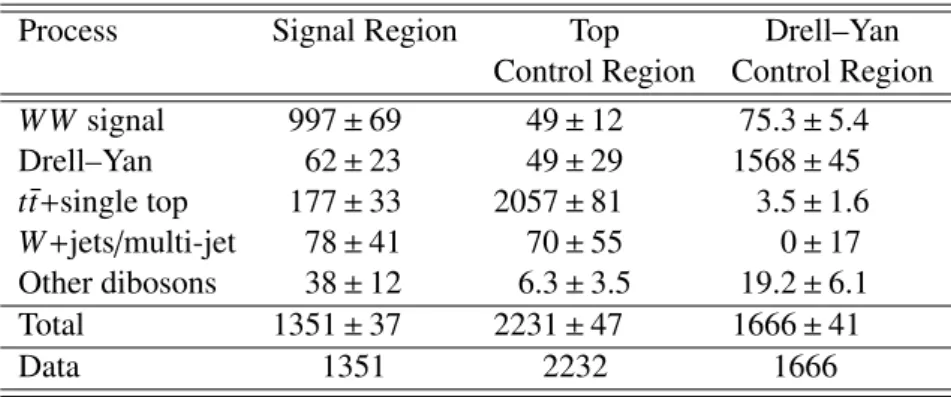
Process Signal Region Top Drell–Yan Control Region Control Region
W W signal 997 ± 69 49 ± 12 75.3 ± 5.4
Drell–Yan 62 ± 23 49 ± 29 1568 ± 45
t¯ t +single top 177 ± 33 2057 ± 81 3.5 ± 1.6 W + jets / multi-jet 78 ± 41 70 ± 55 0 ± 17 Other dibosons 38 ± 12 6.3 ± 3.5 19.2 ± 6.1
Total 1351 ± 37 2231 ± 47 1666 ± 41
Data 1351 2232 1666
Table 3: Observed number of events in data and estimated number of events of signal and background processes in signal and control regions, as a result of the simultaneous fit. The quoted uncertainties account for statistical and systematic components on the number of events for each process and do not include the uncertainties on the C factor. The correlations among processes for common systematic uncertainties are accounted for in the total uncertainties.
luminosity scale using x-y beam-separation scans performed in August 2015. The beam energy uncer- tainty, assumed to be of the order of 1% (from Ref. [62], with an additional uncertainty that accounts for the extrapolation of this uncertainty to 13 TeV) is not taken into account.
A full list of systematic uncertaities and their impact on the cross section measurement is given in Sec- tion 8.
8 The fiducial cross section measurement
The fiducial cross section σ W W fid →eµ is extracted by minimising a negative log-likelihood function, based on observed and expected numbers of events in the signal region, as defined by the signal event selection, and in the top and Drell–Yan control regions, as defined in Section 5. The likelihood consists of a product of Poisson probability density functions for the orthogonal regions. This procedure allows a simultaneous measurement of the signal process cross section and of the contributions from the top and Drell–Yan processes. Systematic uncertainties are taken into account as constrained nuisance parameters in the log- likelihood function. The methodology accounts for uncertainties and their correlations across signal and background processes. It is found that the Drell–Yan and top-quark processes need to be scaled with respect to their MC predictions by 1.03 ± 0.03 and 0.875 ± 0.035 respectively. The number of events observed in data and the estimated number of signal and background events together with their total uncertainties are reported in Table 3. The correction factor C is calculated to be 0.60 ± 0.04, where the uncertainty accounts for the systematic e ff ects discussed in Section 7. The measured signal cross section is:
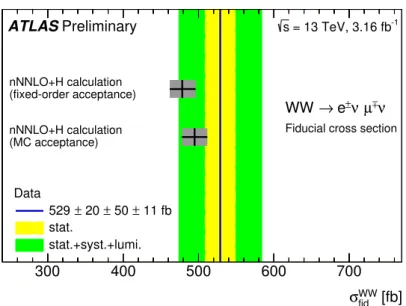
σ W W fid →eµ = 529 ± 20 (stat.) ± 50 (syst.) ± 11 (lumi.) fb. (2)
The total uncertainty is dominated by systematic e ff ects, as described in Section 7, of which the largest
contribution originates from the experimental jet selection and calibration. The correlations of the fit
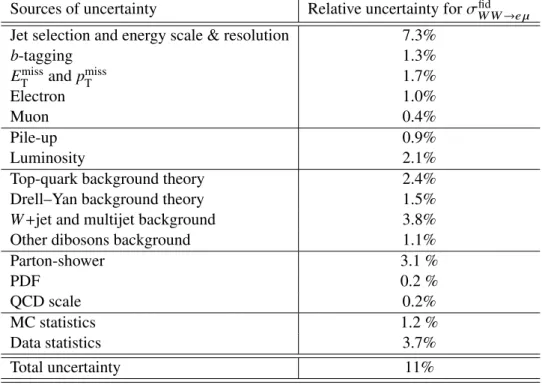
Sources of uncertainty Relative uncertainty for σ W W fid →e µ Jet selection and energy scale & resolution 7.3%
b-tagging 1.3%
E T miss and p miss T 1.7%
Electron 1.0%
Muon 0.4%
Pile-up 0.9%
Luminosity 2.1%
Top-quark background theory 2.4%
Drell–Yan background theory 1.5%
W + jet and multijet background 3.8%
Other dibosons background 1.1%
Parton-shower 3.1 %
PDF 0.2 %
QCD scale 0.2%
MC statistics 1.2 %
Data statistics 3.7%
Total uncertainty 11%
Table 4: Breakdown of the relative uncertainties on the fiducial cross section measurement as a result of the simul- taneous fit to signal and control regions. “Electron” and “Muon” uncertainties include contributions from trigger, energy / momentum reconstruction, identification and isolation.
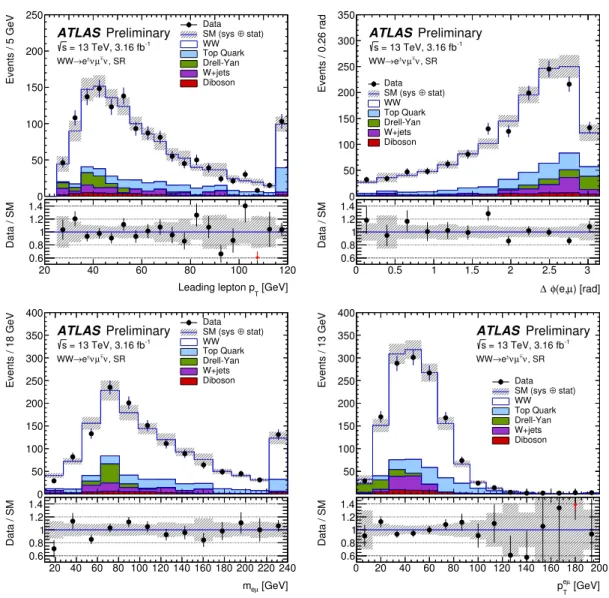
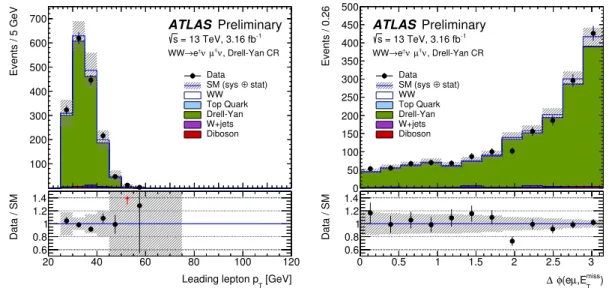
parameters in the signal and control regions are taken into account in the computation of the total un- certainties. All contributions to the relative uncertainty in the fiducial cross section measurement are summarised in Table 4. Figure 1 shows distributions of kinematic variables of the data events in the sig- nal region in comparison with the signal and background contributions estimated from the simultaneous fit to signal and control regions.
9 Theoretical predictions and ratio to the 8 TeV measurement
Theoretical predictions are calculated in the total phase space (σ tot W W ) and include the q q ¯ → W W , the non-resonant gg → W W and the resonant gg → H → W W sub-processes. The q q ¯ → W W production cross section is known to O(α 2 s ) (NNLO) [10, 14], while the non-resonant gg sub-process is known to O (α 3 s ) [34] and the resonant gg → H → W W cross section is calculated to O (α 5 s ) [63] and takes into account the H → W W branching fraction [64]. The sum of these sub-processes is denoted as nNNLO+H in the following. In its calculation, the interference between the three sub-processes is neglected. At the given orders of O (α s ) the q q ¯ → W W does not interfere with either of the gg-induced processes and the interference between the gg-induced processes has little contribution to the cross section in the measured phase space.
The renormalisation and factorisation scales are set to the W mass for the q q ¯ and non-resonant gg pro-
cesses, and to m H /2 for gg → H → W W. The uncertainties on the q q ¯ → W W cross section are estimated
by varying the two scales independently by factors 0.5 and 2 with the constraint 0.5 < µ F /µ R < 2, while
the uncertainties on the non-resonant and resonant gg cross sections are estimated by simultaneously
Events / 5 GeV
0 50 100 150 200 250
Data stat)
⊕ SM (sys WW Top Quark Drell-Yan W+jets Diboson
ATLAS Preliminary
= 13 TeV, 3.16 fb-1
s
, SR ν
±
µ ν e±
→ WW
[GeV]
Leading lepton pT
20 40 60 80 100 120
Data / SM
0.6 0.8 1 1.2 1.4
Events / 0.26 rad
0 50 100 150 200 250 300 350
Data stat)
⊕ SM (sys WW Top Quark Drell-Yan W+jets Diboson
ATLAS Preliminary
= 13 TeV, 3.16 fb-1
s
, SR ν
±
µ ν e±
→ WW
) [rad]
(e,µ φ
∆
0 0.5 1 1.5 2 2.5 3
Data / SM
0.6 0.8 1 1.2 1.4
Events / 18 GeV
0 50 100 150 200 250 300 350 400
Data stat) SM (sys ⊕ WW Top Quark Drell-Yan W+jets Diboson
ATLAS Preliminary
= 13 TeV, 3.16 fb-1
s
, SR ν
±
µ
±ν e
→ WW
[GeV]
µ
me
20 40 60 80 100 120 140 160 180 200 220 240
Data / SM
0.6 0.8 1 1.2 1.4
Events / 13 GeV
50 100 150 200 250 300 350 400
Data stat) SM (sys ⊕ WW Top Quark Drell-Yan W+jets Diboson
ATLAS Preliminary
= 13 TeV, 3.16 fb-1
s
, SR ν
±
µ
±ν e
→ WW
[GeV]
µ e
pT
0 20 40 60 80 100 120 140 160 180 200
Data / SM
0.6 0.8 1 1.2 1.4
Figure 1: Lepton and di-lepton kinematic variables in the signal region. In the figure m
eµand p
eµTare the invariant mass and the transverse momentum of the e-µ system respectively, and ∆φ(e, µ) is the di ff erence in the azimuthal angle between the two leptons. Data are shown together with the MC and data-driven predictions of the signal and background production processes after the fit to the data in the signal and control regions. The last bin in each distribution is the overflow. In the legend SM stands for the total contribution of the estimated SM processes and the uncertainty band includes the MC statistical and systematic uncertainties as a result of the fit.
varying µ R and µ F by factors 0.5 and 2. The uncertainties on gg → W W and gg → H → W W pro-
cesses include a 3.2% contribution from PDF uncertainties computed in Ref. [65]. For the q q ¯ → W W
process PDF uncertainties are estimated as the largest value between the CT10 NLO eigenvector un-
certainty band (at 68% confidence level) and the difference among the central values of CT10 NLO,
MSTW2008nlo and NNPDF3.0 PDFs, and they amount to 1.8%. The uncertainties associated with the
individual sub-processes are propagated to σ W W tot prediction for the nNNLO + H combination: scale un-
certainties are treated as correlated across processes, while PDF uncertaities are considered as uncorrel-
ated. The q q ¯ production makes up 87% of the total cross section while the non-resonant and resonant gg
production sub-processes account for 5% and 8% respectively.
pp → W W order of σ W W tot A σ fid W W →e µ
sub-process O(α s ) [pb] [%] [fb]
q q ¯ [10, 14] O(α 2 s ) 111.1 ± 2.8 16.20±0.13 422 + −11 12 gg (non-resonant) [34] O(α 3 s ) 6.82 + −0.55 0.42 28.1 + −2.3 2.7 44.9±7.2 gg → H → W W [66][31] O(α 5 s ) tot. / O(α 3 s ) fid. 10.45 + −0.79 0.61 4.5±0.80 11.0±2.1 q q ¯ + gg (non-resonant) + gg → H nNNLO + H 128.4 + −3.8 3.5 15.87 + −0.14 0.17 478±17 Table 5: Theoretical predictions for the W W cross section sub-processes and their associated uncertainties in the full phase space (σ
totW W) calculated up to the given order in O (α
s) together with the respective acceptance corrections (A) for the fiducial phase space and the fiducial cross sections (σ
W Wfid →eµ). The resonant gg → H → W W is calculated up to O(α
5s) for σ
W Wtotand to O(α
3s) for σ
fidW W→eµand A. A correction is applied to σ
fidW W→eµand A to account for non-perturbative e ff ects. The quoted uncertainties include scale variations and PDF uncertainties, with the latter being evaluated at NLO. The scale uncertainties are treated as correlated, whereas PDF uncertainties are treated as uncorrelated between the q q ¯ and the gg-induced processes. A branching ratio of leptonic W -boson decays of B = 0.1083 [58] is used.
For direct comparison to the experimental result, theoretical predictions are also calculated in the same phase space as the measurement (σ W W fid →eµ ) for the q q ¯ and non-resonant gg processes. A correction of 0.972 ± 0.001 is applied to parton-level calculations for σ W W fid →e µ to account for the contribution of non-perturbative e ff ects due to multi-parton interactions and hadronisation. This correction has been calculated by comparing the particle-level cross section as predicted by the MC simulation with one obtained with a dedicated event generation where these effects are disabled in PYTHIA v8. The uncertainty includes the MC statistics and the systematic component estimated by comparing the above correction with the one estimated with the non-perturbative model implemented in the HERWIG++ MC generator. The calculations reported here do not include high-order electroweak corrections. In Ref [67] it is estimated that electroweak corrections up to NLO reduce the W W cross section by 3–4% in a phase space close to the one used in this analysis. For the resonant gg → H → W W process no fiducial calculation is available at O(α 5 s ). Therefore, the fiducial cross section is calculated by correcting the cross section in the full phase space (σ W W tot ) by the geometrical and kinematic acceptance A as determined using the MC generator POWHEG-BOX v2 interfaced to PYTHIA v8 for parton showering and non-perturbative e ff ects and the branching ratio (B) for fully leptonic final states, B = 0.1083 [58]:
σ W W fid →eµ = 2 × σ W W tot × A × B 2 . (3)
In this determination of the gg → H → W W fiducial cross section uncertainties from PDFs and scale uncertainties are considered for both A and σ W W tot , while parton shower uncertainties are additionally evaluated for A. The q q ¯ and non-resonant gg acceptances are calculated using the ratios of the respective fiducial cross section to the total cross section. The uncertainties on the A factors for q q ¯ and non-resonant gg processes are estimated following the same methodology as for σ W W tot and considering both scale and PDF uncertainties as correlated between σ fid W W →eµ and σ W W tot . The total uncertainty on A in the nNNLO + H calculation is then determined from the propagation of the A factor uncertainties for the individual sub-processes. The PDF uncertainties are found to be dominant and to contribute with 2.5%
and 3.2% to the q q ¯ and the two gg-induced processes respectively.
The theoretical cross section predictions for each production sub-process and the nNNLO + H combination
[fb]
WW
σ
fid300 400 500 600 700
Data
11 fb 50 ± 20 ± 529 ± stat.
stat.+syst.+lumi.
(fixed-order acceptance) nNNLO+H calculation
(MC acceptance) nNNLO+H calculation
ATLAS Preliminary s = 13 TeV, 3.16 fb
-1ν
±µ
±
ν e WW →
Fiducial cross section
Figure 2: The measured fiducial cross section at √
s = 13 TeV in comparison with the nNNLO + H prediction in the fiducial phase space with two different acceptance calculations. The vertical bands around the measurement indicate the statistical uncertainty (yellow) and the sum in quadrature of statistical, systematic and luminosity uncertainties (green).
in the total and fiducial phase spaces as well as the A factors (corrected for non-perturbative e ff ects) are given together with their estimated uncertainties in Table 5. Figure 2 shows the comparison of the nNNLO+H prediction with the measurement presented in the previous section. Figure 2 also reports the same prediction corrected by the acceptance A calculated using the MC generator POWHEG-BOX v2 + PYTHIA v8 for the q q ¯ and resonant gg → H → W W processes and SHERPA v2.1.1 for the non- resonant gg process. In this calculation the acceptance factor is estimated to be A =(16.4 ± 0.9) % where the uncertainty includes the parton shower modelling (taken as the di ff erence between PYTHIA v8 and HERWIG++ showers), PDF uncertainty (estimated as the largest di ff erence between CT10 NLO eigenvector uncertainty band and MSTW2008nlo and NNPDF3.0 PDFs central values), scale uncertainty associated to the jet veto requirement estimated as in Ref. [68] and the residual renormalisation and factorisation scale uncertainty (estimated by varying the two scales independently by factors 2 and 0.5).
The nNNLO+H prediction agrees within uncertainties with the experimental cross section measurement in the fiducial phase space.
The cross section in the full phase space (σ W W tot ) is determined by extrapolating the measurement in the fiducial phase space by inverting Eq. 3 and using the acceptance value from the nNNLO+H calculation as in Table 5: σ tot W W = 142 ± 5 (stat.) ± 13 (syst.) ± 3 (lumi.) pb. This is in agreement with the nNNLO + H prediction of 128.4 +3.5 −3.8 pb.
Using the fiducial cross section measured for W W → e µ production at 8 TeV centre-of-mass energy [7] in
the fiducial phase space detailed in Ref. [7], the ratio of cross sections at the two centre-of-mass energies
Cross section ratio (13 TeV / 8 TeV)
0.8 1 1.2 1.4 1.6 1.8 2 2.2
Data stat.
stat.+syst.
nNNLO+H Prediction
ν
±µ
±
ν e WW →
(8 TeV) (13 TeV) and 20.3 fb
-13.16 fb
-1Total cross section ratio (13 TeV / 8 TeV)
Fiducial cross section ratio (13 TeV / 8 TeV)
ATLAS Preliminary
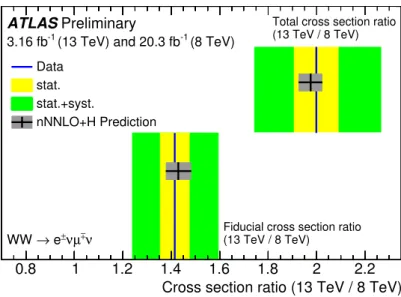
Figure 3: Measurements of the ratios of cross sections at the two centre-of-mass energies of 13 and 8 TeV in the fiducial and total phase spaces. For the 8 TeV cross sections the results from Ref. [7] are used. The measurements are compared to the nNNLO + H predictions for the ratios of cross sections in the fiducial phase spaces of the two analyses at 13 and 8 TeV and in the total phase space with their respective uncertainties.
of 13 and 8 TeV is:
σ fid 13 TeV,W W →e µ
σ fid 8 TeV,W W →e µ = 1.41 ± 0.06 (stat.) ± 0.16 (syst.) ± 0.04(lumi.). (4) All uncertainties are treated as uncorrelated between the measurements at the two beam energies. The same ratio is calculated for the total cross sections at 13 and 8 TeV and is found to be 2.00 ± 0.08 (stat.)
+0.25
− 0.24 (syst.) ± 0.06(lumi.). Figure 3 shows the measured ratios of cross sections in the fiducial and total phase spaces and the comparison with their respective nNNLO+H predictions with scale uncertainties treated in a correlated way at the two centre-of-mass energies, while the PDF uncertainties are considered uncorrelated. The predictions for the ratio in the fiducial and total phase spaces are 1.43 ± 0.05 and 1.98 ± 0.05, respectively, and are in agreement with the experimental results.
10 Conclusions
The production cross section of the W + W − pairs in pp collisions at √
s = 13 TeV is measured in a fiducial
phase space of the e µ final state in which events with reconstructed jets are excluded. The data used in the
analysis correspond to an integrated luminosity of 3.16 fb −1 collected by the ATLAS detector at the LHC
in 2015. The measurement is made in a relatively pure signal region with the contamination from the
dominant background processes estimated using data in dedicated control regions. The measured cross
section is 529± 20 (stat.)± 50 (syst.) ± 11 (lumi.) fb and is found to be consistent with the most up-to-date
SM predictions that include high-order QCD e ff ects, taking into account systematic uncertainties asso-
ciated to the selection of the fiducial phase space. Furthermore, the ratio of the measured fiducial cross
sections at 13 and 8 TeV centre-of-mass energies is compared to the theory predictions with reduced un- certainties, thanks to their cancellation in the ratio. These results show that high-order QCD calculations describe the data well.
References
[1] ALEPH, DELPHI, L3 and OPAL Collaborations and the LEP Electroweak Working Group, S.
Schael et al., Electroweak Measurements in Electron-Positron Collisions at W-Boson-Pair Energies at LEP, Phys. Rept. 532 (2013) 119, arXiv: 1302.3415 [hep-ex].
[2] CDF Collaboration, F. Abe et al., Observation of W + W − production in p p collisions at ¯ √ s = 1.8 TeV, Phys. Rev. Lett. 78 (1997) 4536.
[3] CDF Collaboration, T. Aaltonen et al., Measurement of the W + W − Production Cross Section and Search for Anomalous W W γ and W W Z Couplings in p p Collisions at ¯ √
s = 1.96 TeV, Phys.
Rev. Lett. 104 (2010) 201801, [Erratum: Phys. Rev. Lett. 105, 019905 (2010)], arXiv: 0912.4500 [hep-ex].
[4] DØ Collaboration, V. M. Abazov et al., Measurement of the W W production cross section in p p col- ¯ lisions at √
s = 1.96 TeV, Phys. Rev. Lett. 94 (2005) 151801, [Erratum: Phys. Rev. Lett.100,139901(2008)], arXiv: hep-ex/0410066 [hep-ex].
[5] DØ Collaboration, V. Abazov et al., Measurement of the WW production cross section with dilepton final states in p p collisions at ¯ √
s = 1.96 TeV and limits on anomalous trilinear gauge couplings, Phys. Rev. Lett. 103 (2009) 191801, arXiv: 0904.0673 [hep-ex].
[6] ATLAS Collaboration, Measurement of W + W − production in pp collisions at √
s = 7 TeV with the ATLAS detector and limits on anomalous W W Z and W W γ couplings, Phys. Rev. D 87.11 (2013) 112001, [Erratum: Phys. Rev. D 88, 079906 (2013)], arXiv: 1210.2979 [hep-ex].
[7] ATLAS Collaboration, Measurement of total and di ff erential W + W − production cross sections in proton-proton collisions at √
s = 8 TeV with the ATLAS detector and limits on anomalous triple- gauge-boson couplings (2016), arXiv: 1603.01702 [hep-ex].
[8] CMS Collaboration, Measurement of the W + W − cross section in pp collisions at √
s = 7 TeV and limits on anomalous W W γ and W W Z couplings, Eur. Phys. J. C 73 (2013) 2610, arXiv:
1306.1126 [hep-ex].
[9] CMS Collaboration, Measurement of the W + W − cross section in pp collisions at √
s = 8 TeV and limits on anomalous gauge couplings, Eur. Phys. J. C 76 (2016) 401, arXiv: 1507 . 03268 [hep-ex].
[10] T. Gehrmann et al., W + W − Production at Hadron Colliders in Next to Next to Leading Order QCD, Phys. Rev. Lett. 113 (2014) 212001, arXiv: 1408.5243 [hep-ph].
[11] P. Meade, H. Ramani and M. Zeng, Transverse momentum resummation e ff ects in W + W − meas- urements, Phys. Rev. D 90 (2014) 114006, arXiv: 1407.4481 [hep-ph].
[12] P. Jaiswal and T. Okui, An Explanation of the W W Excess at the LHC by Jet-Veto Resummation, Phys. Rev. D 90 (2014) 073009, arXiv: 1407.4537 [hep-ph].
[13] P. F. Monni and G. Zanderighi, On the excess in the inclusive W + W − → l + l − ν ν ¯ cross section,
JHEP 05 (2015) 013, arXiv: 1410.4745 [hep-ph].
[14] M. Grazzini et al., W + W − production at the LHC: fiducial cross sections and distributions in NNLO QCD (2016), arXiv: 1605.02716 [hep-ph].
[15] S. Dawson et al., Resummation of Jet Veto Logarithms at N 3 LL a + NNLO for W + W − production at the LHC (2016), arXiv: 1606.01034 [hep-ph].
[16] ATLAS Collaboration, The ATLAS experiment at the CERN Large Hadron Collider, JINST 3 (2008) S08003.
[17] P. Nason, A New method for combining NLO QCD with shower Monte Carlo algorithms, JHEP 0411 (2004) 040, arXiv: hep-ph/0409146 [hep-ph].
[18] S. Frixione, P. Nason and C. Oleari, Matching NLO QCD computations with Parton Shower simu- lations: the POWHEG method, JHEP 0711 (2007) 070, arXiv: 0709.2092 [hep-ph].
[19] S. Alioli et al., A general framework for implementing NLO calculations in shower Monte Carlo programs: the POWHEG BOX, JHEP 1006 (2010) 043, arXiv: 1002.2581 [hep-ph].
[20] T. Melia et al., W + W − , WZ and ZZ production in the POWHEG BOX, JHEP 11 (2011) 078, arXiv:
1107.5051 [hep-ph].
[21] P. Nason and G. Zanderighi, W + W − , W Z and Z Z production in the POWHEG-BOX-V2, Eur.
Phys. J. C 74 (2014) 2702, arXiv: 1311.1365 [hep-ph].
[22] H.-L. Lai et al., New parton distributions for collider physics, Phys. Rev. D 82 (2010) 074024, arXiv: 1007.2241 [hep-ph].
[23] T. Sjöstrand et al., An Introduction to PYTHIA 8.2, Comput. Phys. Commun. 191 (2015) 159, arXiv: 1410.3012 [hep-ph].
[24] ATLAS Collaboration, Measurement of the Z/γ ∗ boson transverse momentum distribution in pp collisions at √
s = 7 TeV with the ATLAS detector, JHEP 09 (2014) 145, arXiv: 1406 . 3660 [hep-ex].
[25] J. Pumplin et al., New generation of parton distributions with uncertainties from global QCD analysis, JHEP 07 (2002) 012, arXiv: hep-ph/0201195 [hep-ph].
[26] T. Gleisberg et al., Event generation with SHERPA 1.1, JHEP 0902 (2009) 007, arXiv: 0811.4622 [hep-ph].
[27] D. J. Lange, The EvtGen particle decay simulation package, Nucl. Instrum. Meth. A 462 (2001) 152.
[28] M. Grazzini et al., W ± Z production at hadron colliders in NNLO QCD (2016), arXiv: 1604.08576 [hep-ph].
[29] M. Grazzini, S. Kallweit and D. Rathlev, ZZ production at the LHC: fiducial cross sections and distributions in NNLO QCD, Phys. Lett. B 750 (2015) 407, arXiv: 1507.06257 [hep-ph].
[30] F. Cascioli et al., ZZ production at hadron colliders in NNLO QCD, Phys. Lett. B 735 (2014) 311, arXiv: 1405.2219 [hep-ph].
[31] E. Bagnaschi et al., Higgs production via gluon fusion in the POWHEG approach in the SM and in the MSSM, JHEP 02 (2012) 088, arXiv: 1111.2854 [hep-ph].
[32] C. Anastasiou et al., Higgs Boson Gluon-Fusion Production in QCD at Three Loops, Phys. Rev.
Lett. 114 (2015) 212001, arXiv: 1503.06056 [hep-ph].
[33] F. Cascioli et al., Precise Higgs-background predictions: merging NLO QCD and squared quark-
loop corrections to four-lepton + 0,1 jet production, JHEP 1401 (2014) 046, arXiv: 1309.0500
[hep-ph].
[34] F. Caola et al., QCD corrections to W + W − production through gluon fusion, Phys. Lett. B 754 (2016) 275, arXiv: 1511.08617 [hep-ph].
[35] J. Alwall et al., The automated computation of tree-level and next-to-leading order di ff erential cross sections, and their matching to parton shower simulations, JHEP 07 (2014) 079, arXiv:
1405.0301 [hep-ph].
[36] NNPDF Collaboration, R. D. Ball et al., Parton distributions with LHC data, Nucl. Phys. B 867 (2013) 244, arXiv: 1207.1303 [hep-ph].
[37] C. Anastasiou et al., High precision QCD at hadron colliders: Electroweak gauge boson rapidity distributions at next-to-next-to leading order, Phys. Rev. D 69 (2004) 094008, arXiv: hep - ph / 0312266 [hep-ph].
[38] J. M. Campbell et al., Top-pair production and decay at NLO matched with parton showers, JHEP 04 (2015) 114, arXiv: 1412.1828 [hep-ph].
[39] E. Re, Single-top Wt-channel production matched with parton showers using the POWHEG method, Eur. Phys. J. C 71 (2011) 1547, arXiv: 1009.2450 [hep-ph].
[40] T. Sjöstrand, S. Mrenna and P. Z. Skands, PYTHIA 6.4 Physics and Manual, JHEP 05 (2006) 026, arXiv: hep-ph/0603175 [hep-ph].
[41] P. Z. Skands, Tuning Monte Carlo Generators: The Perugia Tunes, Phys. Rev. D 82 (2010) 074018, arXiv: 1005.3457 [hep-ph].
[42] S. Gieseke et al., Herwig ++ 2.5 Release Note (2011), arXiv: 1102.1672 [hep-ph].
[43] S. Frixione et al., Single-top hadroproduction in association with a W boson, JHEP 07 (2008) 029, arXiv: 0805.3067 [hep-ph].
[44] ATLAS Collaboration, ‘Simulation of top-quark production for the ATLAS experiment at √ s = 13 TeV’, ATL-PHYS-PUB-2016-004, 2016, url : http://cds.cern.ch/record/2120417.
[45] M. Czakon and A. Mitov, Top ++ : A Program for the Calculation of the Top-Pair Cross-Section at Hadron Colliders, Comput. Phys. Commun. 185 (2014) 2930, arXiv: 1112.5675 [hep-ph].
[46] N. Kidonakis, Two-loop soft anomalous dimensions for single top quark associated production with a W − or H − , Phys. Rev. D 82 (2010) 054018, arXiv: 1005.4451 [hep-ph].
[47] GEANT4 Collaboration, S. Agostinelli et al., GEANT4: A Simulation toolkit, Nucl. Instrum. Meth.
A 506 (2003) 250.
[48] ATLAS Collaboration, The ATLAS Simulation Infrastructure, Eur. Phys. J. C 70 (2010) 823, arXiv:
1005.4568 [physics.ins-det].
[49] ATLAS Collaboration, ‘Electron e ffi ciency measurements with the ATLAS detector using the 2015 LHC proton-proton collision data’, ATLAS-CONF-2016-024, 2016, url: http : / / cds . cern . ch/record/2157687.
[50] ATLAS Collaboration, Muon reconstruction performance of the ATLAS detector in proton-proton collision data at √
s = 13 TeV, Eur. Phys. J. C 76 (2016) 292, arXiv: 1603.05598 [hep-ex].
[51] M. Cacciari, G. P. Salam, G. Soyez, The anti-k t jet clustering algorithm, JHEP 04 (2008) 063, arXiv: 0802.1189 [hep-ph].
[52] ATLAS Collaboration, Properties of jets and inputs to jet reconstruction and calibration with the ATLAS detector using proton–proton collisions at √
s = 13 TeV, ATL-PHYS-PUB-2015-036,
[53] ATLAS Collaboration, Jet Calibration and Systematic Uncertainties for Jets Reconstructed in the ATLAS Detector at √
s = 13 TeV, ATL-PHYS-PUB-2015-015, 2015, url: http://cds.cern.
ch/record/2037613.
[54] ATLAS Collaboration, Pile-up subtraction and suppression for jets in ATLAS, ATLAS-CONF- 2013-083, 2013, url : http://cdsweb.cern.ch/record/1570994.
[55] ATLAS Collaboration, Tagging and suppression of pileup jets with the ATLAS detector, ATLAS- CONF-2014-018, 2014, url : http://cdsweb.cern.ch/record/1700870.
[56] ATLAS Collaboration, Expected performance of the ATLAS b-tagging algorithms in Run-2, ATL- PHYS-PUB-2015-022, 2015, url : http://cdsweb.cern.ch/record/2037697.
[57] ATLAS Collaboration, Expected performance of missing transverse momentum reconstruction for the ATLAS detector at √
s = 13 TeV, ATL-PHYS-PUB-2015-023, 2015, url: http://cdsweb.
cern.ch/record/2037700.
[58] ALEPH, DELPHI, L3 and OPAL Collaborations and the LEP Electroweak Working Group, J.
Alcaraz et al., A Combination of preliminary electroweak measurements and constraints on the standard model (2006), arXiv: hep-ex/0612034 [hep-ex].
[59] MSTW Collaboration, A. D. Martin et al., Parton distributions for the LHC, Eur. Phys. J. C 63 (2009) 189, arXiv: 0901.0002 [hep-ph].
[60] NNPDF Collaboration, R. D. Ball et al., Parton distributions for the LHC Run II, JHEP 04 (2015) 040, arXiv: 1410.8849 [hep-ph].
[61] ATLAS Collaboration, Improved luminosity determination in pp collisions at √
s = 7 TeV using the ATLAS detector at the LHC, Eur. Phys. J. C 73 (2013) 2518, arXiv: 1302.4393 [hep-ex].
[62] ATLAS Collaboration, Simultaneous measurements of the t¯ t, W + W − , and Z/γ ∗ → ττ produc- tion cross-sections in pp collisions at √
s = 7 TeV with the ATLAS detector, Phys. Rev. D 91 (2015) 052005, arXiv: 1407.0573 [hep-ex].
[63] C. Anastasiou et al., High precision determination of the gluon fusion Higgs boson cross-section at the LHC (2016), arXiv: 1602.00695 [hep-ph].
[64] LHC Higgs Cross Section Working Group, ‘CERN Report 4: Part I Standard Model Predictions’, 2016, url : http://cds.cern.ch/record/2150771.
[65] J. Butterworth et al., PDF4LHC recommendations for LHC Run II, J. Phys. G 43 (2016) 023001, arXiv: 1510.03865 [hep-ph].
[66] LHC Higgs Cross Section Working Group, Handbook of LHC Higgs Cross Sections: 3. Higgs Properties (2013), arXiv: 1307.1347 [hep-ph].
[67] B. Biedermann et al., Next-to-leading-order electroweak corrections to pp → W + W − → 4 leptons at the LHC, JHEP 06 (2016) 065, arXiv: 1605.03419 [hep-ph].
[68] I. W. Stewart and F. J. Tackmann, Theory Uncertainties for Higgs and Other Searches Using Jet
Bins, Phys. Rev. D 85 (2012) 034011, arXiv: 1107.2117 [hep-ph].
Additional figures
1 Distributions in signal region
Events / 5 GeV
50 100 150 200 250 300 350 400 450
Data stat)
⊕ SM (sys WW Top Quark Drell-Yan W+jets Diboson
ATLAS Preliminary
= 13 TeV, 3.16 fb-1
s
ν, SR
±
µ
±ν
→e WW
[GeV]
Subleading lepton pT
20 40 60 80 100 120
Data / SM
0.6 0.8 1 1.2 1.4
Events / 13 GeV
0 50 100 150 200 250 300 350 400 450
Data stat)
⊕ SM (sys WW Top Quark Drell-Yan W+jets Diboson
ATLAS Preliminary
= 13 TeV, 3.16 fb-1
s
ν, SR
±
µ
±ν
→e WW
[GeV]
miss
pT
0 50 100 150 200
Data / SM
0.6 0.8 1 1.2 1.4
Events / 10 GeV
50 100 150 200 250 300 350
Data stat) SM (sys ⊕ WW Top Quark Drell-Yan W+jets Diboson
ATLAS Preliminary
= 13 TeV, 3.16 fb-1
s
, SR ν
±
µ
±ν e
→ WW
[GeV]
miss T, Rel
E
0 20 40 60 80 100 120 140
Data / SM
0.6 0.8 1 1.2 1.4
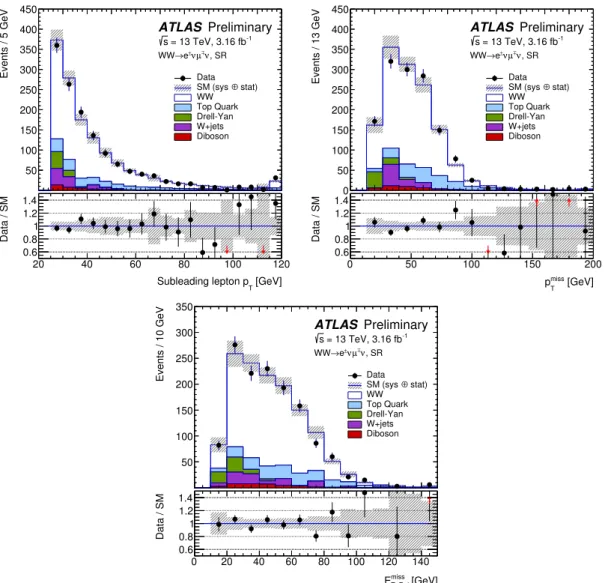
Figure 4: Distributions of the subleading lepton transverse momentum, (top left), track-based missing transverse
momentum, p
Tmiss, (top right) and relative missing transverse momentum, E
missT,Rel, (bottom) after all event selection
cuts. Data are shown together with the MC and data-driven predictions of the signal and background production
processes after the fit to the data in the signal and control regions. The uncertainty band contains the contribution
from MC statistical and systematic uncertainties.
2 Distributions in Top and Drell-Yan control regions
Events / 5 GeV
100 200 300 400 500
Data stat)
⊕ SM (sys WW Top Quark Drell-Yan W+jets Diboson
ATLAS Preliminary
= 13 TeV, 3.16 fb-1
s
, Top CR ν
±
µ
±ν
→e WW
[GeV]
Subleading lepton pT
20 40 60 80 100 120
Data / SM
0.6 0.8 1 1.2 1.4
Events / 0.26 rad
50 100 150 200 250 300 350 400 450 500
Data stat) SM (sys ⊕ WW Top Quark Drell-Yan W+jets Diboson
ATLAS Preliminary
= 13 TeV, 3.16 fb-1
s
, Top CR ν
±
µ
±ν
→e WW
) [rad]
(e,µ φ
∆
0 0.5 1 1.5 2 2.5 3
Data / SM
0.6 0.8 1 1.2 1.4
Figure 5: Distributions of subleading lepton transverse momentum (left), and di-lepton azimuthal di ff erence (right) in the top-quark control region. Data are shown together with the MC and data-driven predictions of the signal and background production processes after the fit to the data in the signal and control regions. The uncertainty band contains the contribution from MC statistical and systematic uncertainties.
Events / 5 GeV
100 200 300 400 500 600 700
Data stat) SM (sys ⊕ WW Top Quark Drell-Yan W+jets Diboson
ATLAS Preliminary
= 13 TeV, 3.16 fb-1
s
, Drell-Yan CR ν
±
µ
±ν e
→ WW
[GeV]
Leading lepton pT
20 40 60 80 100 120
Data / SM
0.6 0.8 1 1.2 1.4
Events / 0.26
0 50 100 150 200 250 300 350 400 450 500
Data stat) SM (sys ⊕ WW Top Quark Drell-Yan W+jets Diboson
ATLAS Preliminary
= 13 TeV, 3.16 fb-1
s
, Drell-Yan CR ν
±
µ
±ν e
→ WW
miss) ,ET
(eµ φ
∆
0 0.5 1 1.5 2 2.5 3
Data / SM
0.6 0.8 1 1.2 1.4
Figure 6: Distributions of leading lepton transverse momentum (left), and azimuthal di ff erence between the missing
transverse energy and the di-lepton system (right) in the Drell-Yan control region. Data are shown together with
the MC and data-driven predictions of the signal and background production processes after the fit to the data in
the signal and control regions. The uncertainty band contains the contribution from MC statistical and systematic
uncertainties.
3 Distributions of number of jets
Events
1000 2000 3000 4000 5000 6000 7000 8000 9000
Data SM (stat) WW Top Quark Drell-Yan W+jets Diboson
ATLAS Preliminary
= 13 TeV, 3.16 fb-1
s
, pre-fit ν
±
µ
±ν
→e WW
before b-jet veto njets
0 1 2 3 4 5
Data / SM
0.6 0.8 1 1.2 1.4
Events
200 400 600 800 1000 1200 1400 1600 1800 2000
Data SM (stat) WW Top Quark Drell-Yan W+jets Diboson
ATLAS Preliminary
= 13 TeV, 3.16 fb-1
s
, pre-fit ν
±
µ
±ν
→e WW
after b-jet veto njets
0 1 2 3 4 5
Data / SM
0.6 0.8 1 1.2 1.4
Figure 7: Distribution of number of jets for events after all event selection cuts except the jet veto requirement before
(left) and after (right) the b-tagged jet veto requirement. Data are shown together with the MC predictions of the
signal and background production processes before the fit to the data in the signal and control regions. Uncertainties
shown in the plot for data and MC are statistical only.
4 Total cross section as a function of √ s
[TeV]
s
2 4 6 8 10 12 14
[pb]
WW totalσ
10
10
2WW (p p ) WW (pp)
WW above 7 TeV) (incl. H→
=13 TeV) s LHC Data 2015 (
-1) ATLAS WW (3.2 fb
=8 TeV) s LHC Data 2012 (
-1) ATLAS WW (20.3 fb
=7 TeV) s LHC Data 2011 (
-1) ATLAS WW (4.6 fb
=1.96 TeV) s Tevatron (
-1) CDF WW (3.6 fb
-1) D0 WW (9.7 fb
NNLO WW (MSTW PDF) WW (MSTW PDF) + NNLO H →
(arXiv:1408.5243 [hep-ph]) (arXiv:1307.1347 [hep-ph])