ATLAS-CONF-2019-043 25September2019
ATLAS CONF Note
ATLAS-CONF-2019-043
23rd September 2019
Observation of the associated production of a top quark and a Z boson in p p collisions at √
s = 13 TeV with the ATLAS detector
The ATLAS Collaboration
Single top-quark production in association with aZboson is measured in the trilepton channel.
The proton–proton collision data collected by the ATLAS experiment from 2015 to 2018 at a centre-of-mass energy of 13 TeV are used, corresponding to an integrated luminosity of 139 fb−1. Events containing three isolated charged leptons (electrons and muons) and two or three jets, one of which is identified as containing a b-hadron, are selected. The main backgrounds are fromtt Z¯ , diboson, tt¯and Z+ jets production. A neural network is used to improve the background rejection and extract the signal. The measured cross- section fort`+`−qproduction, including non-resonant dilepton pairs withm`` >30 GeV, is 98 ±12 (stat.) ±8 (syst.) fb, consistent with the Standard Model prediction.
© 2019 CERN for the benefit of the ATLAS Collaboration.
Reproduction of this article or parts of it is allowed as specified in the CC-BY-4.0 license.
1 Introduction
This article reports on the observation of the electroweak production of a top quark or an antitop quark associated with a Z boson (tZq) by the ATLAS Collaboration using a data sample corresponding to an integrated luminosity of 139 fb−1 of proton–proton (pp) collisions at a centre-of-mass energy of
√s=13 TeV. In order to increase the signal significance relative to the backgrounds, the final state where theZboson decays to electrons or muons and theWboson, from the top quark decay, decays to an electron or muon and their associated neutrino is used. Evidence for this process has previously been reported by the ATLAS Collaboration [1] with a significance of 4.2 standard deviations using data collected in 2015 and 2016. The CMS Collaboration [2] has reported an observation with a measured cross-section uncertainty of 15 % using data collected in 2016 and 2017.
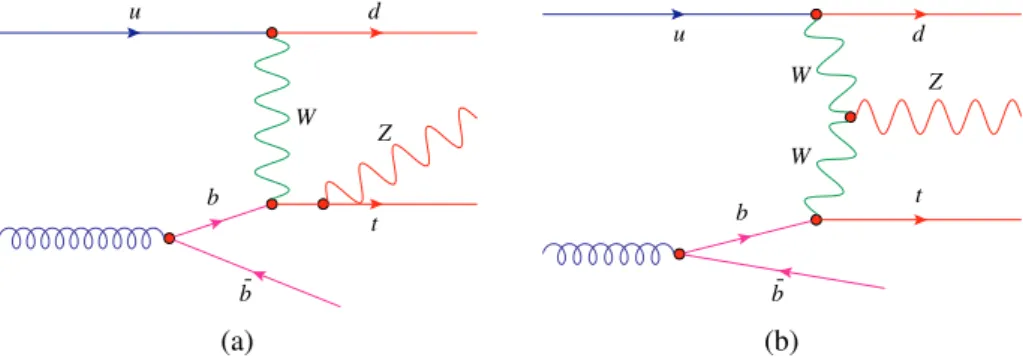
At leading order (LO) in the Standard Model (SM) both the production and decay occur through the electroweak interaction. The main LO Feynman diagram is the same as fort-channel single-top-quark production with the addition of aZboson radiated from any of the quarks (Fig.1(a)) or from thet-channel W-boson propagator (Fig.1(b)). This allows for the indirect study of thettZand theWWZcouplings in a single interaction without the need for QCD corrections, which arise at LO in thettZprocess. Furthermore, the next-to-leading-order (NLO) QCD corrections are small and therefore deviations from the SM can easily be studied in the framework of the SM effective field theory [3].
u d
W
b
b
t Z
(a)
u d
W
W b
b
t Z
(b)
Figure 1: Example Feynman diagrams of the lowest-order amplitudes for thetZqprocess with an on-shellZboson.
In the four-flavour scheme, theb-quark originates from gluon splitting. Figure (a) shows the diagram where theZ boson is radiated from the top quark, while (b) shows the diagram with theZ-boson radiated from thet-channel W-boson propagator.
In addition to resonantZ-boson production, there is a small non-resonant`+`−(with`=e,µ,τ) contribution to this process (t`+`−q) that is accounted for in this analysis. Throughout this article, single-top-quark production with both resonant and non-resonant`+`−in the final state will be referred to astZq. In the SM, the expected cross-section for this process, calculated at NLO in QCD for a dilepton mass greater than 30 GeV, is 102+5−2fb.
This article is organised as follows. The ATLAS detector and the data and simulation samples are discussed in Sections2and3, respectively. The physics objects used in the analysis are discussed in Section4, the signal and control regions are defined in Section5, while how the various backgrounds are estimated is summarised in Section6. A brief description of the multivariate analysis technique is given in Section7.
The estimation of the systematic uncertainties on the measurement is the topic of Section8. The statistical analysis is covered in Section9, where the results are presented.
2 ATLAS detector
The ATLAS detector [4] at the LHC covers nearly the entire solid angle around the collision point.1 It consists of an inner tracking detector surrounded by a thin superconducting solenoid, electromagnetic and hadronic calorimeters, and a muon spectrometer incorporating three large superconducting toroidal magnets.
The inner-detector system (ID) is immersed in a 2 T axial magnetic field and provides charged-particle tracking in the range|η| <2.5.
The high-granularity silicon pixel detector covers the vertex region and typically provides four measurements per track, the first hit being normally in the insertable B-layer (IBL) installed before Run 2 [5,6]. It is followed by the silicon microstrip tracker (SCT) which usually provides eight measurements per track.
These silicon detectors are complemented by the transition radiation tracker (TRT), which enables radially extended track reconstruction up to|η| =2.0. The TRT also provides electron identification information based on the fraction of hits (typically 30 in total) above a higher energy-deposit threshold corresponding to transition radiation.
The calorimeter system covers the pseudorapidity range |η| < 4.9. Within the region |η| < 3.2, electromagnetic calorimetry (EM) is provided by barrel and endcap high-granularity lead/liquid-argon (LAr) calorimeters, with an additional thin LAr presampler covering|η| <1.8, to correct for energy loss in material upstream of the calorimeters. Hadronic calorimetry is provided by the steel/scintillating-tile calorimeter, segmented into three barrel structures within|η|< 1.7, and two copper/LAr hadronic endcap calorimeters. The solid angle coverage is completed with forward copper/LAr and tungsten/LAr calorimeter modules optimised for electromagnetic and hadronic measurements respectively.
The muon spectrometer (MS) comprises separate trigger and high-precision tracking chambers measuring the deflection of muons in a magnetic field generated by superconducting air-core toroids. The field integral of the toroids ranges between 2.0 and 6.0 T m across most of the detector. A set of precision chambers covers the region|η| < 2.7 with three layers of monitored drift tubes, complemented by cathode-strip chambers in the forward region, where the background is highest. The muon trigger system covers the range|η| <2.4 with resistive-plate chambers in the barrel, and thin-gap chambers in the endcap regions.
Interesting events are selected to be recorded by the first-level trigger system implemented in custom hardware, followed by selections made by algorithms implemented in software in the high-level trigger [7].
The first-level trigger reduces the 40 MHz bunch crossing rate to below 100 kHz, which the high-level trigger further reduces in order to record events to disk at about 1 kHz.
3 Data and simulation samples
The dataset used in this article corresponds to 139 fb−1ofppcollisions at
√s= 13 TeV collected by the ATLAS detector from 2015–2018.
1ATLAS uses a right-handed coordinate system with its origin at the nominal interaction point (IP) in the centre of the detector and thez-axis along the beam pipe. Thex-axis points from the IP to the centre of the LHC ring, and they-axis points upwards. Cylindrical coordinates(r, φ)are used in the transverse plane,φbeing the azimuthal angle around thez-axis. The pseudorapidity is defined in terms of the polar angleθasη=−ln tan(θ/2). Distances in theη–φplane are measured in units of
∆R≡ q
(∆η)2+(∆φ)2.
Candidate events must pass either one of the single-electron or single-muon triggers [7–10]. Single-lepton triggers with low p
T thresholds and isolation requirements are combined in a logical OR with higher- threshold triggers that have a looser identification criterion and do not have any isolation requirement.
The lowestpTthreshold used for electrons is 24 GeV (26 GeV) in 2015 (2016–2018), while for muons the threshold is 20 GeV (26 GeV).
To evaluate the effects of the detector resolution and acceptance on the signal and background, and to estimate the SM backgrounds, simulated event samples were produced using a GEANT4-based detector Monte Carlo (MC) simulation [11,12]. Some of the samples used for evaluating systematic uncertainties do not use the full GEANT4 simulation but instead rely on parametrised showers in the calorimeter. The top-quark mass in the event generators described below was set to 172.5 GeV.
The simulated data must account for the fact that significantly more than one inelasticppcollision occurs per bunch crossing. On average, the number of collisions per bunch crossing ranges from 13 to 38 for the 2015 through 2018 data-taking periods, respectively. Inelastic collisions are simulated using Pythia 8.186 [13]
and overlaid on the signal and background MC samples. These simulated events are reweighted to match the conditions of the collision data, specifically the additionalppinteractions (pile-up).
To estimate the signal acceptance and efficiency, and to study the effect of different selection criteria on the expected precision of the measurement, atZqsimulated sample was generated, including non-resonant
`+`− contributions. The sample was generated using the four-flavour scheme at NLO in QCD with MadGraph5_aMC@NLO 2.6.0 [14], requiring the dilepton invariant mass to be larger than 30 GeV and using the NNPDF3.0_nlo_as_0118_nf_4 [15] set of parton distribution functions (PDFs). Following the discussion in Ref. [16], the functional form of the renormalization and factorization scale is set to 4
q
m2b+p2
T,b, where theb-quark is the external one produced from gluon splitting in the initial state. The parton shower and the hadronisation of signal events were simulated using Pythia 8.230 [17], with a set of tunable parameters selected according to Ref. [18], referred to as the ‘A14 tune’.
The predicted cross-section was calculated with MadGraph5_aMC@NLO 2.6.0, using the five-flavour scheme with the NNPDF3.0_nlo_as_0118 PDF set and with the renormalisation,µr, and the factorisation scales,µf, set to µr = µf=(mt +mZ)/4=66 GeV. The SMtZqcross-section at NLO in QCD is 102 fb.
The renormalisation and factorisation scale uncertainties are+5−1..23% and the PDF uncertainty is±1.0 %.
The PDF uncertainty was calculated using the replica method described in Ref. [19].
The background to the signal is estimated using simulated samples that contain at least two leptons and at least two jets. These samples include the production oftt,ttH,ttZ,ttW,tW,tWZ, diboson (WW,WZ, or ZZ), andZ+ jets events.
The nominal tt and ttH simulated samples were generated using the NLO matrix-element generator Powheg-Box v2 [20–22] with the parameterh
damp, which controls the transverse momentum of the first additional gluon emission beyond the Born configuration, set to 1.5×mtfortt[23] and 0.75× (2×mt+mH) forttH, withmH =125 GeV. These events were then processed through Pythia 8.230 to generate the underlying event and perform the parton showering and hadronisation. The PDF set used in the sample simulation was NNPDF3.0 NLO, and for Pythia 8 the A14 tune was used.
Additionaltt simulated samples are used to assess modelling uncertainties [24]. In order to evaluate the uncertainty due to initial-state radiation, samples with higher parton radiation were produced by varying the factorisation and renormalisation scales by a factor of 0.5 and simultaneously increasing thehdamp parameter by a factor of 2 compared to the nominal value, and using the ‘Var3c’ up variation from the A14
tune [25]. For lower parton radiation, the nominalhdampvalue was used, while the renormalisation and factorisation scales were varied by a factor of 2 and the ‘Var3c’ down variation was selected in the parton shower.
To study the impact of the parton shower and hadronisation models, a sample was produced with the NLO Powheg-Box v2 generator using the NNPDF3.0 NLO PDF interfaced with Herwig 7.0.4 [26,27], using the H7UE set of tuned parameters [27] and the MMHT2014 LO PDF set [28]. To assess the uncertainty due to the choice of the matching scheme, a sample generated with MadGraph5_aMC@NLO 2.6.0 with the NNPDF3.0 NLO PDF set and interfaced with Pythia 8.230, using the A14 set of tuned parameters and the NNPDF2.3 LO PDF, is used. For all samples generated with this set of generators, the matrix element correction for the first emission was turned off and the global recoil option was used.
The production ofttZandttWevents was modelled using the MadGraph5_aMC@NLO 2.3.3 generator at NLO in QCD, with the NNPDF3.0 NLO PDF set. Parton showering and hadronisation were modeled with Pythia 8.210, using the A14 tune and the NNPDF2.3 LO [15] PDF set.
To assess modelling uncertainties, alternativettZsimulated samples were produced with the Sherpa 2.2.1 [29]
generator with one additional parton at NLO accuracy. The CKKW matching scale of the additional emis- sions was set to 30 GeV. The default Sherpa 2.2.1 parton shower was used along with the NNPDF3.0 NNLO PDF set.
ThetW simulated samples use the same generators as those used for the varioustt samples. To avoid overlap betweentWandttproduction, the diagram removal (DR) scheme was employed [30], where all NLO diagrams that overlap with the doubly resonantttcontributions are removed from the calculation of thetWamplitude.
The production oftWZevents was modelled using the MadGraph5_aMC@NLO 2.3.3 generator at NLO with the NNPDF3.0 NLO PDF set. The generator was interfaced with Pythia 8.212 using the A14 tune and the NNPDF2.3 LO PDF set. The modelling uncertainties for this process have been evaluated by comparing to a MC sample produced using the same generators but employing a different treatment of the interference betweenttZandtWZ, namely the diagram removal scheme that takes the interference term into account (DR2), as opposed to the nominal DR1 scheme [31].
To generate the simulated diboson event samples, the NLO event generators Sherpa 2.2.1 for events with one boson decaying to hadrons, and Sherpa 2.2.2 for events with both bosons decaying to leptons were used. In this setup, multiple matrix elements were matched and merged with the Sherpa parton shower based on Catani–Seymour dipole factorisation [32, 33] using the MEPS@NLO prescription [34–37].
The simulations included up to one additional parton at NLO accuracy and up to three additional parton emissions at LO accuracy. The virtual QCD correction for matrix elements at NLO accuracy were provided by the OpenLoops library [38,39] and the NNPDF3.0 NLO PDF set were used.
To assess modelling uncertainties for the diboson background, the Powheg-Box v2 generator was used to generate the diboson processes at NLO in QCD. Events were generated using the CT10 NLO PDF set [40]
and showered with Pythia 8.210 with the AZNLO [41] tune and the CTEQ6L1 [42] PDF set.
For the modelling ofZ+ jets, a sample was generated using Sherpa 2.2.1 with the NNPDF3.0 NNLO PDF set. The matching and merging procedure, as well as the virtual QCD corrections, were done in a similar way to those described for the diboson event simulation. The simulations included up to two additional partons at NLO accuracy and up to four additional parton emissions at LO accuracy.
4 Object reconstruction
The reconstruction of the basic objects used in this analysis is described in the following. The primary vertex is selected as theppvertex candidate with the highest sum of the squared transverse momenta of all associated tracks withpT >400 MeV.
Electron candidates are reconstructed from energy clusters in the EM calorimeter that match a reconstructed track [43]. The clusters are required to be within|η| < 2.47, excluding the transition region between the barrel and end-cap calorimeters at 1.37< |η| <1.52. Electron candidates in this analysis must also satisfy a transverse energy requirement ofE
T > 20 GeV [44]. A likelihood-based discriminant is constructed from a set of variables that enhance the electron selection, while rejecting photon conversions and hadrons misidentified as electrons [43]. Anη- andET-dependent selection on the likelihood discriminant is applied, such that it has an 80 % efficiency when used to identify electrons fromZ-boson decays. This working point corresponds to an approximate rejection factor against jets of 700 at aE
Tof 40 GeV. Electrons are further required to be isolated using criteria based on ID tracks and topological clusters in the calorimeter, with an efficiency of 90 % (99 %) forE
T=25 GeV(60 GeV). Correction factors are applied to simulated electrons to take into account the small differences in reconstruction, identification and isolation efficiencies between data and MC simulation.
Muon candidates are reconstructed by combining a reconstructed track from the inner detector with one from the muon spectrometer [45], and are required to havepT >20 GeV and|η| <2.5. To reject misidentified muon candidates, primarily originating from pion and kaon decays, several quality requirements are imposed on the muon candidate. An isolation requirement based on ID tracks and topological clusters in the calorimeter is imposed, resulting in an efficiency of 90 % (99 %) forp
T =25 GeV(60 GeV). The overall efficiency obtained for muons fromW-boson decays in simulatedtt events is 96 % and the rejection factor for non-prompt muons withp
T >20 GeV is approximately 600. As for electrons, correction factors are applied to simulated muons to account for the small differences between data and simulation.
Jet reconstruction in the calorimeter starts from topological clustering [46] of individual calorimeter cells calibrated to the electromagnetic energy scale. The anti-kt algorithm [47, 48], with the radius parameter set to R = 0.4, is used to reconstruct the jets. These jets are then calibrated to the particle level by the application of a jet energy scale derived from simulation and in situ corrections based on
√s=13 TeV data [49]. Jets in this analysis are required to havep
T >35 GeV in the region with|η| <4.5.
To suppress jets arising from pile-up, a discriminant called the jet-vertex-tagger (JVT) is constructed using a two-dimensional likelihood method [50]. For jets withp
T <60 GeV and|η| <2.5 a JVT requirement corresponding to a 92 % efficiency, while rejecting 98 % of jets from pile-up and noise, is imposed. In order to reject jets at high|η| originating from additionalppinteractions, a so-called forward jet vertex tagger (fJVT) requirement is applied [51]. All jets with|η| >2.5 are required to pass the requirements of the fJVT ‘medium’ working point. This has an efficiency of selecting hard scattered jets of up to 97 % and a pile-up-jet efficiency of 53 % for jets with apTof 40 GeV.
To identify jets containing ab-hadron (b-jets), a multivariate algorithm is employed [52,53]. It is based on the impact parameter and reconstructed secondary vertex information of the tracks contained in the jet as input for a multivariate analysis. Four efficiency points are defined for each of which a calibration in bins ofp
Tis derived. Each jet is assigned a score, depending on how many of the efficiency points are passed.
Due to its use of the ID, the reconstruction ofb-jets is done in the region with|η| <2.5. Candidateb-jets are required to pass a threshold on theb-tagging discriminant such that a 70 %b-jet selection efficiency is achieved in simulatedtt events. With this criterion, the misidentification rate for light-jets, i.e. originating
from a light quark (u,d,s) or a gluon, is 1 %, while it is 17 % for jets initiated byc-quarks. Correction factors are derived and applied to correct for differences inb-jet selection efficiency and the mistag rates between data and MC simulation [52,54,55].
The missing transverse momentum, with magnitudeETmiss, is calculated as the negative of the vector sum of the transverse momenta of all reconstructed objects. In order to account for the soft hadronic activity, a term including tracks associated with the primary vertex but not with any of the reconstructed objects is added in theETmisscalculation [56].
To avoid cases where the detector response to a single physical object is reconstructed as two separate final-state objects, an overlap removal procedure is used. If electron and muon candidates share a track, the electron candidate is removed. After that, if the∆Ry,φ2distance between a jet and an electron candidate is less than 0.2, the jet is discarded. In case multiple jets pass this requirement, only the closest jet is removed.
For jet-electron distances between 0.2 and 0.4, the electron candidate is removed. If the distance between a jet and a muon candidate is less than 0.4, the muon candidate is removed if the jet has more than two associated tracks, otherwise the jet is removed.
5 Signal and control regions
ThetZqfinal state used for this measurement comprises three charged leptons (electrons or muons), missing transverse momentum, exactly oneb-jet, an additional jet which does not pass theb-tagging requirement (untagged jet) and is expected to be emitted at high |η|. A second untagged jet is allowed in order to include events with QCD radiation. To help separate thetZqsignal from the four largest backgrounds (ttZ, diboson,Z+ jets andttevents), both theZboson and the top-quark invariant masses are reconstructed.
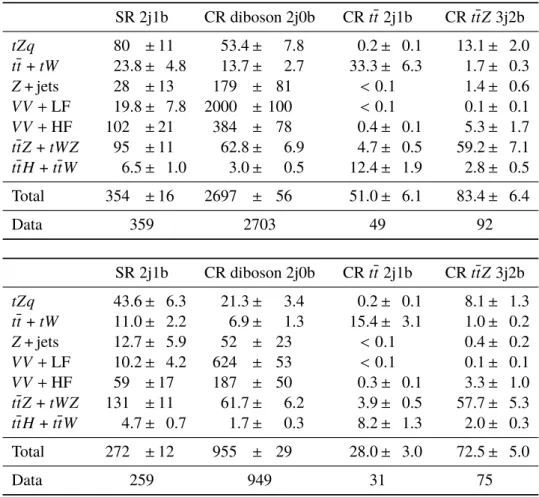
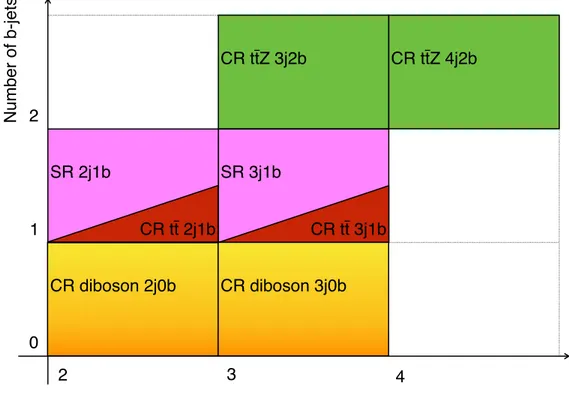
The data are divided into eight non-overlapping regions: two signal regions (SR) designed to select tZqevents and six control regions (CR) designed to enhance the selection of the three main sources of background events. The CRs are used to adjust the normalisation and reduce the associated systematic uncertainties of the main backgrounds.
These SRs and CRs are included in a binned maximum-likelihood fit that is performed in order to measure the signal cross-section. In the fit, the normalisation of the signal,tt(includingtW) andZ+ jets backgrounds are unconstrained, while the other backgrounds are constrained to be close to their SM prediction (see Section8).
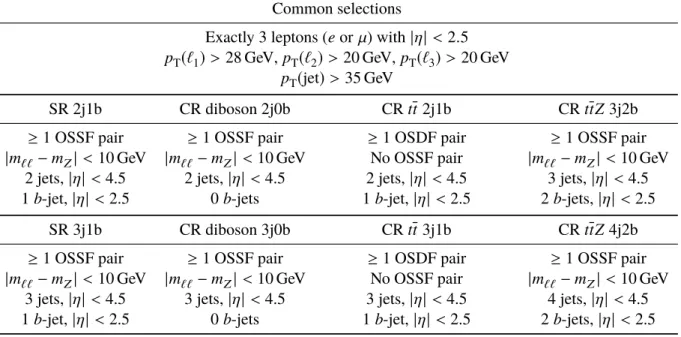
Table1summarises the selection criteria applied across all considered regions. Leptons and jets have to satisfy the requirements discussed in Section4and one of the leptons must havep
T> 28 GeV, because of the trigger thresholds, and match, with∆R<0.15, the lepton reconstructed by the trigger. The nomenclature njmb is used to denote the regions, wherenis the total number of jets, of whichmareb-tagged.
The SRs require an opposite-sign, same-flavour (OSSF) lepton pair in order to reconstruct theZboson.
In theµeeandeµµchannels the pair is uniquely identified, whereas in theeeeand µµµchannels both possible combinations are considered and the pair with the invariant mass closest to theZ-boson mass is chosen. The dilepton invariant mass requirement is|m``−mZ|< 10 GeV. The remaining lepton and the
2∆Ry,φis the Lorentz-invariant distance in the rapidity-azimuthal angle plane, defined as∆Ry,φ=q
(∆y)2+(∆φ)2
Table 1: Overview of the requirements applied for selecting events in the signal and control regions. OSSF is an opposite-sign same-flavour lepton pair. OSDF is an opposite-sign different-flavour lepton pair.
Common selections
Exactly 3 leptons (eorµ) with|η| <2.5 pT(`1)> 28 GeV,p
T(`2)> 20 GeV,p
T(`3)> 20 GeV pT(jet)>35 GeV
SR 2j1b CR diboson 2j0b CRtt 2j1b CRttZ3j2b
≥1 OSSF pair ≥1 OSSF pair ≥1 OSDF pair ≥1 OSSF pair
|m``−mZ| <10 GeV |m``−mZ| <10 GeV No OSSF pair |m``−mZ| <10 GeV 2 jets,|η| <4.5 2 jets,|η|<4.5 2 jets,|η| <4.5 3 jets,|η| <4.5 1b-jet,|η|<2.5 0b-jets 1b-jet,|η| <2.5 2b-jets,|η| <2.5
SR 3j1b CR diboson 3j0b CRtt 3j1b CRttZ4j2b
≥1 OSSF pair ≥1 OSSF pair ≥1 OSDF pair ≥1 OSSF pair
|m``−mZ| <10 GeV |m``−mZ| <10 GeV No OSSF pair |m``−mZ| <10 GeV 3 jets,|η| <4.5 3 jets,|η|<4.5 3 jets,|η| <4.5 4 jets,|η| <4.5 1b-jet,|η|<2.5 0b-jets 1b-jet,|η| <2.5 2b-jets,|η| <2.5
Emiss
T are used to reconstruct the leptonically decayingWboson.3 The 4-momenta of the reconstructedW boson and theb-jet are added in order to reconstruct the top quark.
The diboson CRs use the same event selection as each of the SRs but ab-tag veto is applied. The CRs for ttZare the same as the SRs except for the addition of anotherb-jet. The CRs forttare the same as the SRs except for the requirement of no OSSF lepton pair and at least one opposite-sign, different-flavour (OSDF) lepton pair.
6 Background estimation
Two classes of backgrounds are considered: processes in which three or more prompt leptons are produced, such as diboson production or the associated production of a top-quark pair and a boson (W, ZorH);
processes with only two prompt leptons in the final state (such asZ+ jets,ttandtWproduction) and one additional non-prompt or fake lepton that satisfies the selection criteria. Such non-prompt or fake leptons can originate from decays of bottom or charm hadrons, from jets misidentified as electrons, leptons from kaon or pion decays, or electrons from photon conversions.
After applying the SR event selection, diboson, ttZ, Z+ jets and tt production constitute the largest backgrounds. For the SR 2j1b, the dominant background source is diboson production, mainlyWZevents.
These represent 50 % of the total number of selected background events in this region, while the second
3The longitudinal component of the neutrino four-vector is obtained by using the mass constraint of theWboson. The two-fold ambiguity is resolved by choosing the smallest |pyz|solution, since theW boson is expected to be produced with small pseudorapidity [57].
largest backgrounds,ttZandtWZamount to 32 %. Non-prompt lepton backgrounds contribute up to 14 % of the events. In the SR 3j1b,ttZis the dominant background source, with 45 % of background events.
Diboson production yields 28 % of all background events in that region.
The diboson contribution is split based on the origin of the associated jets using generator-level information.
If one of the jets originates from ab- orc-quark then it is classified as diboson + heavy flavour (VV+HF), otherwise the event is classified as diboson + light flavour (VV+LF).
The ttZ and tWZ backgrounds are combined, as well as tt and tW, due to their similar production mechanisms and kinematic properties. ThettW andttHcontributions are also treated together, since both processes have very small contributions.
All background contributions involving prompt leptons are estimated using MC samples that are normalised to their respective SM predicted cross-sections calculated at NLO in QCD.
For estimating the number of non-prompt lepton background events, simply using MC samples is not reliable because the MC does not reproduce data when trying to model non-prompt and fake lepton contributions. Additionally, the MC samples for these processes have insufficient statistics, after applying the SR event selection. Generator-level studies have shown that forttevents4andZ+ jets events passing the event selection, the additional non-prompt lepton is predominately originating from charm and bottom hadron decays with a smaller contribution from other sources such as photon conversions in the case of non-prompt electrons.
The method used to estimate these backgrounds relies on constructing distributions derived from MC samples enriched in events with semileptonicb-jet decays and with higher statistical precision than the default simulation. In order to compute thett andZ+ jets yields, these distributions are then normalised to data. Generated events are used forttandZ+ jets independently, with a preselection of two leptons instead of three leptons and twob-jets. One of the twob-jets, which is selected randomly, is replaced by a lepton.
The energy and polar angle of the replacement lepton, relative to the direction of theb-jet momentum, are derived from a generator level study of the polar-angle distribution versus lepton energy in the rest frame of thebhadron, which is assumed to carry theb-jet energy. The azimuthal angle is generated uniformly around theb-jet direction. The lepton four-vector is transformed to the laboratory frame using theb-jet four-vector.
If theb-jet and lepton are within a cone of∆R <0.4 theb-jet is removed. For the remaining events the b-jet is kept and the event will ultimately not satisfy the common selection, as it contains 2b-jets . The kinematic variables from the resulting sample were compared tottandZ+ jets MC samples, applying the common selection and were found to agree within statistical uncertainties.
7 Multivariate analysis
In order to improve the separation between signal and background, a neural network (NN) is used to derive a discriminant that takes correlations among the input variables into account. For this measurement the package NeuroBayes [58,59] is used, which combines a three-layer feed-forward neural network with a complex robust preprocessing that orders the input variables by their separation power [60]. The first layer of the network consists of one input node for each input variable plus one additional node. The second
4This is also valid for the very small number oftWevents. The same method of estimating their contribution is used for both processes.
layer can have an arbitrary, user-defined, number of hidden nodes. There is one output node that gives a continuous value in the interval[−1,1]. The NN uses Bayesian regularisation during the training process to improve its performance and stability, and to avoid overtraining. All background processes are considered in the training and are weighted according to their number of expected events in each SR.
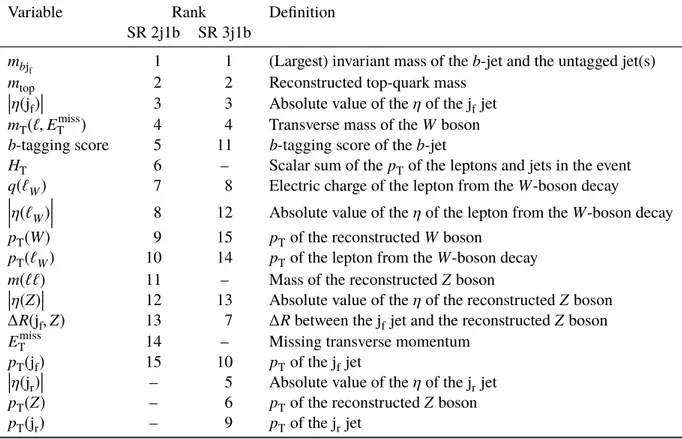
Only variables that provide good separation and are well modelled are used in the final NN. A separate network is trained for each of the SRs with each NN starting with the same input variables and 25 hidden nodes. The fifteen input variables that give the best separation according to NeuroBayes are used for the final NN training. The full list of the variables used for the NN training is shown in Table2. The jet denoted jfis the one for which the invariant mass of theb-tagged jet and the untagged jet is largest. The other untagged jet is labelled jr.
Variables related to the reconstructedZ boson help to reduce thett background, while top-quark related quantities are useful in separating the signal from processes likeWZandZ+ jets, in which no top quark is produced. For the signal, the untagged jet comes from the spectator quark in the hard scattering process and thus tends to have higherη, helping the NN better separate against diboson andttZbackground events.
The invariant mass of an untagged jet andb-jet,mbj
f, is also used as a discriminating variable for selecting signal over background.
In terms of the separation power, the top four ranked variables for the two SRs are the same. The highest ranked variable ismbj
f. The other three variables are the reconstructed top-quark mass, the absolute value of the untagged jfjet pseudorapidity, and the transverseW-boson mass.5
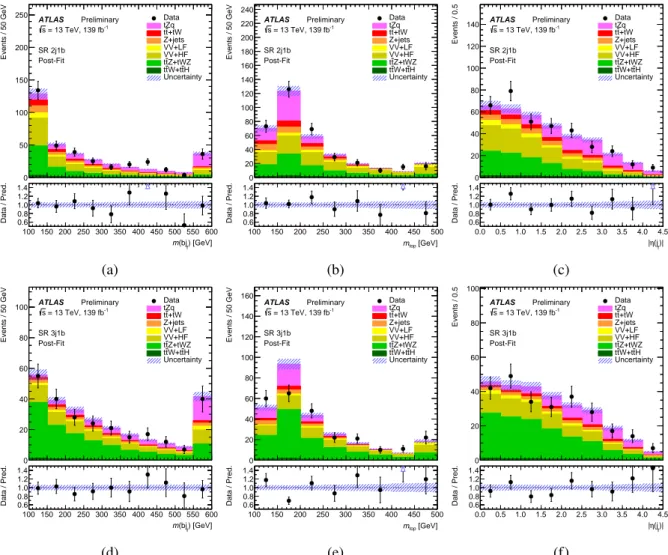
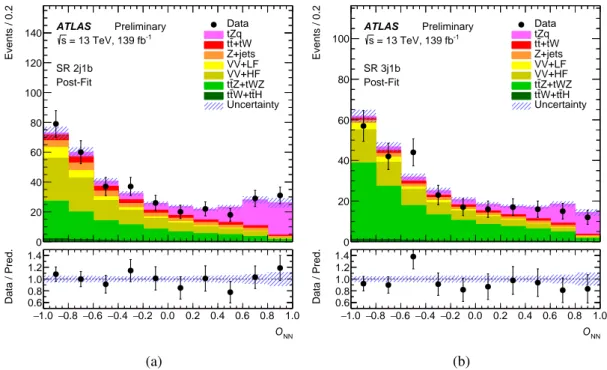
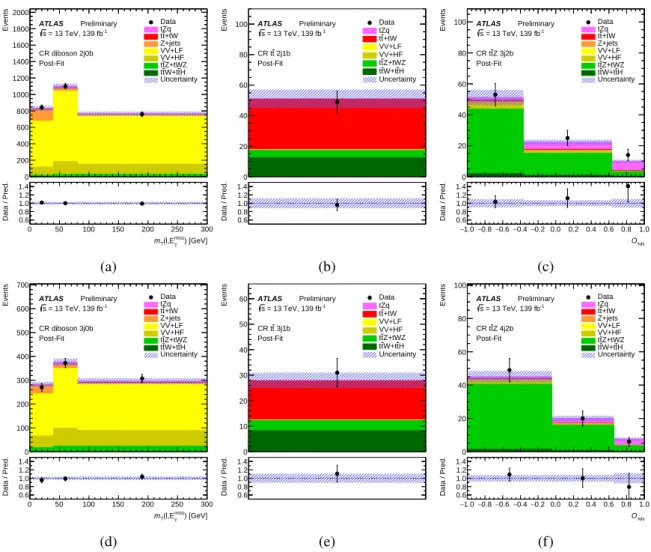
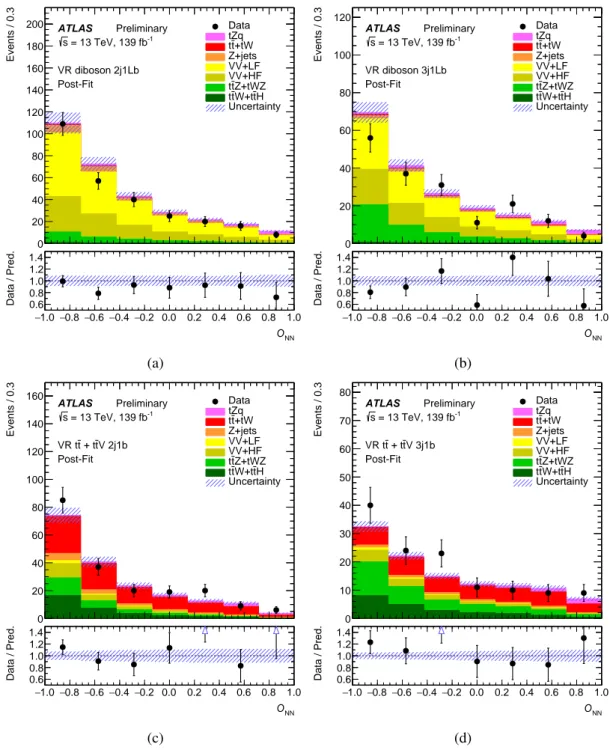
The post-fit distributions of the three variables with the highest discrimination power are shown in Fig.2 for the two SRs. Good agreement between data and prediction is observed.
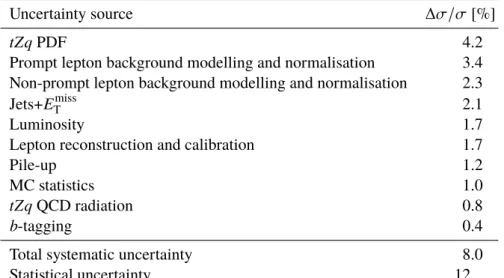
8 Systematic uncertainties
Systematic uncertainties in the signal acceptance and in the normalisation of the individual backgrounds, as well as uncertainties in the shape of the fitted distributions are taken into account. These are treated as correlated between the different regions, unless stated otherwise. The uncertainties can be classified into the following categories:
Reconstruction efficiency and calibration uncertainties: Systematic uncertainties affecting the recon- struction efficiency and energy calibration of electrons, muons and jets are propagated through the analysis, each contributing at the percent level to the pre-fit signal and background uncertainties.
The difference in modelling of electron (muon) trigger, reconstruction and selection efficiencies between data and MC is corrected by scale factors derived from dedicatedZ→e+e−(Z→ µ+µ−) enriched control samples using a tag-and-probe method [44,45].
The jet energy scale (JES) was derived using information from test-beam data, LHC collision data and simulation, as described in Ref. [49]. The fractional JES uncertainty decreases with the p
T of the reconstructed jet and is rather stable inη. It has various components according to the factors it accounts for
5The transverse mass is calculated using the momentum of the lepton associated with theWboson,ETmissand the azimuthal angle between the two:mT
`,ETmiss =
r
2pT(`)ETmiss h
1−cos∆φ
`,ETmiss i
.
100 150 200 250 300 350 400 450 500 550 600 ) [GeV]
(bjf
m 0.6
0.8 1.0 1.2 1.4
Data / Pred.
0 50 100 150 200 250
Events / 50 GeV
ATLAS Preliminary = 13 TeV, 139 fb-1
s SR 2j1b Post-Fit
Data tZq
+tW t t Z+jets VV+LF VV+HF Z+tWZ t t
H t W+t t t Uncertainty
(a)
100 150 200 250 300 350 400 450 500
[GeV]
mtop
0.6 0.8 1.0 1.2 1.4
Data / Pred.
0 20 40 60 80 100 120 140 160 180 200 220 240
Events / 50 GeV
ATLAS Preliminary = 13 TeV, 139 fb-1
s SR 2j1b Post-Fit
Data tZq
+tW t t Z+jets VV+LF VV+HF Z+tWZ t t
H t W+t t t Uncertainty
(b)
0.0 0.5 1.0 1.5 2.0 2.5 3.0 3.5 4.0 4.5
f)|
η(j
| 0.6
0.8 1.0 1.2 1.4
Data / Pred.
0 20 40 60 80 100 120 140
Events / 0.5
ATLAS Preliminary = 13 TeV, 139 fb-1
s SR 2j1b Post-Fit
Data tZq
+tW t t Z+jets VV+LF VV+HF Z+tWZ t t
H t W+t t t Uncertainty
(c)
100 150 200 250 300 350 400 450 500 550 600 ) [GeV]
(bjf
m 0.6
0.8 1.0 1.2 1.4
Data / Pred.
0 20 40 60 80 100
Events / 50 GeV
ATLAS Preliminary = 13 TeV, 139 fb-1
s SR 3j1b Post-Fit
Data tZq
+tW t t Z+jets VV+LF VV+HF Z+tWZ t t
H t W+t t t Uncertainty
(d)
100 150 200 250 300 350 400 450 500
[GeV]
mtop
0.6 0.8 1.0 1.2 1.4
Data / Pred.
0 20 40 60 80 100 120 140 160
Events / 50 GeV
ATLAS Preliminary = 13 TeV, 139 fb-1
s SR 3j1b Post-Fit
Data tZq
+tW t t Z+jets VV+LF VV+HF Z+tWZ t t
H t W+t t t Uncertainty
(e)
0.0 0.5 1.0 1.5 2.0 2.5 3.0 3.5 4.0 4.5
f)|
η(j
| 0.6
0.8 1.0 1.2 1.4
Data / Pred.
0 20 40 60 80 100
Events / 0.5
ATLAS Preliminary = 13 TeV, 139 fb-1
s SR 3j1b Post-Fit
Data tZq
+tW t t Z+jets VV+LF VV+HF Z+tWZ t t
H t W+t t t Uncertainty
(f)
Figure 2: Comparison between data and prediction (“Pred.”) for the three most discriminating NN input variables after the fit to data (“Post-Fit”) under the signal-plus-background hypothesis. The variables displayed are: (a) and (d) the invariant mass of theb-jet and the untagged jet, (b) and (e) the mass of the reconstructed top quark, and (c) and (f) the absolute value of theηof the jfjet, shown in the SR 2j1b (top row) and 3j1b (bottom row). The jet denoted jfis the one for which the invariant mass of theb-tagged jet and the untagged jet is largest. The blue triangles indicate points that are outside the vertical range of the figure. The uncertainty band includes both the statistical and systematic uncertainties as obtained by the fit. The rightmost bin includes overflow events.
Table 2: Variables used as input to the neural network in SR 2j1b and SR 3j1b. The ranking of the variables in each of the SRs is given in the 2ndand 3rdcolumns, respectively. The jet denoted jfis the one for which the invariant mass of theb-tagged jet and the untagged jet is largest. The other untagged jet is labelled jr. Theb-tagging score indicates whether theb-jet would also pass a tighterb-tagging requirement corresponding to a working point with an efficiency of 60 % instead of 70 %.
Variable Rank Definition
SR 2j1b SR 3j1b mbj
f 1 1 (Largest) invariant mass of theb-jet and the untagged jet(s)
mtop 2 2 Reconstructed top-quark mass
η(jf)
3 3 Absolute value of theηof the jfjet
mT(`,Emiss
T ) 4 4 Transverse mass of theWboson
b-tagging score 5 11 b-tagging score of theb-jet
HT 6 – Scalar sum of thepT of the leptons and jets in the event q(`W) 7 8 Electric charge of the lepton from theW-boson decay
η(`W)
8 12 Absolute value of theηof the lepton from theW-boson decay
pT(W) 9 15 p
Tof the reconstructedWboson
pT(`W) 10 14 pTof the lepton from theW-boson decay m(``) 11 – Mass of the reconstructedZboson
η(Z)
12 13 Absolute value of theηof the reconstructedZboson
∆R(jf,Z) 13 7 ∆Rbetween the jfjet and the reconstructedZboson Emiss
T 14 – Missing transverse momentum
pT(jf) 15 10 p
Tof the jfjet
η(jr)
– 5 Absolute value of theηof the jrjet
pT(Z) – 6 pTof the reconstructedZ boson
pT(jr) – 9 p
Tof the jrjet
and the different steps used to compute it. The impact of the uncertainty on the jet energy resolution is also evaluated.
Since this measurement makes use of theb-tagging algorithm, theb-tagging efficiency and mistag rate uncertainties are taken into account. Theb-tagging efficiencies and mistag rate were measured in data using the same methods as described in Refs. [52,54,55], with the systematic uncertainties due tob-tagging efficiency and the mistag rates calculated separately. The impact of the uncertainties on theb-tagging calibration is evaluated separately forb,cand light-jets in the MC samples.
The uncertainty on Emiss
T due to a possible miscalibration of the soft-track component of the Emiss
T is derived from data–MC comparisons of thepTbalance between the hard and softETmisscomponents [56].
The uncertainty associated with the leptons and jets is propagated from the corresponding uncertainties in the energy/momentum scales and resolutions, and is classified together with the uncertainty associated with the corresponding objects.
Signal and background modelling: The systematic uncertainties due to MC modelling for the signal and thett andttZbackgrounds are estimated by comparing different MC generators and by varying the parameters associated with the renormalisation and factorisation scales, and additional radiation.
For the signal MC, the systematic uncertainty on the renormalisation and factorisation scales, which are set equal to each other, and the amount of additional radiation are calculated simultaneously and are referred to as ‘tZqQCD radiation’. This is done by varying the scale by a factor of two and using the ‘Var3cDown’
parameter of the A14 tune, and by varying the scale by a factor of 0.5 combined with the A14 tune using
‘Var3cUp’ [18]. The PDF uncertainty on the signal MC prediction is also taken into account by reweighting the events according to each of the PDF uncertainty eigenvectors. The uncertainty is calculated following the PDF4LHC recommendation [19].
The effect of changing the MC generator fortt events was investigated, and the difference between the Powheg-Box and MadGraph5_aMC@NLO predictions is included astt NLO matching systematic uncertainty. The impact of the parton shower and hadronisation model is evaluated by comparing samples generated with Powheg-Box interfaced either with Pythia 8 or Herwig 7, as described in Ref. [61].
Systematic uncertainties related to the scale and additional radiation are also included using the samples described in Section3.
The effect of changing the MC generator forttZevents was investigated, and the difference between the MadGraph5_aMC@NLO and Sherpa predictions is included asttZmodelling systematic uncertainty.
Uncertainties related to the choice of renormalisation and factorisation scales, as well as initial state radiation are also included.
The uncertainty associated with the modeling of diboson events is assessed by comparing the predictions by the Sherpa and Powheg-Box generators. This uncertainty is treated as uncorrelated for theVV+LF andVV+HF components.
To account for the possible differences in the shape of Z+ jets events originating from sources other than semileptonicb-decays, a systematic uncertainty on the shape of theZ+ jets distribution is applied.
The systematic uncertainty is constructed by comparing the shapes of MC events from different sources separated by their origin of the fake lepton in the event (e.g. heavy-flavour decay, photon conversion, etc.).
This is not used forttsince the non-prompt lepton contribution in CRs and SRs have the same composition and are fully dominated by semileptonicb-decays.
Background rate uncertainty: ForttZproduction, a cross-section uncertainty of 12 % is used [62]. For theVV+LF production, the normalisation uncertainty is taken to be 20 % [63]. The uncertainties for the VV+HF production is 30 % [64]. The diboson production uncertainties are taken to be uncorrelated. In addition, modelling uncertainties are also used in the fit, as mentioned above. ForttW andttHa 15 % systematic uncertainty on the normalisation is used.
For the backgrounds that are unconstrained in the fit (Z+ jets andtt), an additional normalisation uncertainty of 15 % forZ+ jets and 7 % fortt, uncorrelated for each region, is included to allow for differences between the regions. These values correspond to the largest statistical uncertainty on the predicted yields for the Z+ jets andttMC samples in the SRs and the relevant CRs.
Luminosity: The uncertainty in the combined 2015–2018 integrated luminosity is 1.7 % [65], obtained using the LUCID-2 detector [66] for the primary luminosity measurements.