ATL-PHYS-PROC-2015-186 17/12/2015
ATLAS Muon Reconstruction Performance in LHC Run 2
Nicolas K¨ohler
1, on behalf of the ATLAS Collaboration
1Max-Planck-Institut f¨ur Physik (Werner-Heisenberg-Institut), Munich, Germany
nicolas.koehler@cern.ch
Abstract.The performance measurements of the new muon reconstruction algorithm during the early pp-collision data taking of the LHC in 2015 at a centre-of-mass energy of √
s = 13 TeV are discussed. The muon reconstruction efficiency, transverse momentum resolution and scale has been measured in the different detector regions and for muon transverse momenta between 4 and 110 GeV using datasets containingJ/ψ→µ+µ−andZ→µ+µ−decays.
INTRODUCTION
The ATLAS muon spectrometer efficiently identifies muons and precisely reconstructs their momenta over a wide en- ergy range and within a pseudorapidity interval up to|η|<2.7. Precise knowledge of the muon momentum resolution and reconstruction efficiency is crucial for all measurements performed at the ATLAS detector that use muons, e.g.
H→4`.
This contribution discusses the new muon reconstruction and selection as well as measurements of the muon momentum scale, resolution and reconstruction efficiencies. The results presented are based on app-collision dataset containingJ/ψ→µ+µ−andZ→µ+µ−decays corresponding to an integrated luminosity of 85 pb−1recorded in 2015 at √
s=13 TeV with the ATLAS detector.
MUON RECONSTRUCTION AND SELECTION
The ATLAS muon reconstruction uses information from the Inner Detector (ID) and Muon Spectrometer (MS) (cf.
Figure 1) and to a lesser extent from the calorimeters. A detailed description of these detector components can be found in Ref. [1].
The ID’s task is to track charged particles and determine their charge and momentum using a 2 T solenoid magnetic field and to identify vertices.
The MS [2, 3] is designed to detect muons in the pseudorapidity range of|η| <2.7 and to provide momentum measurements with a relative resolution better than 3% over a wide range of transverse momenta and up to 10% at transverse momenta ofpT ≈1 TeV.
The new muon reconstruction algorithm for ATLAS Run 2 combines several techniques [4] based on the infor- mation provided by ID, MS and calorimeters (cf. Figure 2).
The primary muon type used in ATLAS are the so-calledCombinedmuons which are formed by the successful combination of ID and MS tracks. Other approaches complement theCombined muons in order to further enhance the reconstruction efficiency.
• In the region|η|>2.5 which is not covered by the ID,Standalonemuons, independent MS tracks, are used.
• For muons with low transverse momenta that do not traverse the whole MS,Segment-Taggedmuons consisting of ID tracks and at least one track segment of the MS are used.
• Calorimeter-Tagged muons consisting of an ID track with a characteristic energy deposit in the calorimeter compatible with a minimum ionizing particle provide sensitivity in the region|η|<0.1, where the MS is only partially instrumented.
FIGURE 1.Cut-away view of the ATLAS inner detector (left) and ATLAS muon system (right) [1].
FIGURE 2.Schematic drawing of the detector parts used for muon reconstruction. Dependent on the detector parts used for the recontruction, several muontypesare defined:Combinedmuons use the information of both inner detector and muon spectrom- eter,Standalonemuons are reconstructed in the muon spectrometer only,Segment-Taggedmuons are reconstructed in the inner detector and a single segment of the muon spectrometer andCalorimeter-Taggedmuons get reconstructed in the inner detector and additionally leave a characteristic energy deposit in the calorimeter.
For use in physics analysis, four sets of muon identification criteria are defined, optimized for different use cases:
TheLoose,Medium,TightandHigh-pTselection.
TheMediumidentification criteria are the default muon selection in ATLAS and only useCombinedandStan- dalonemuons in order to minimize systematic uncertainties but still allow for good angular acceptance throughout the detector. TheCombinedmuons are required to have at least 3 hits on at least 2 layers of precision chambers (MDT or CSC), except for the|η| <0.1 region, where tracks with at least 3 hits in one single precision layer are allowed.
The Standalonemuons are required to have at least 3 hits in each of the 3 layers of MDT or CSC and to have a pseudorapidity of 2.5<|η|<2.7.
TheLooseidentification criteria are used to maximize the reconstruction efficiency. Thereby,Calorimeter-Tagged muons andSegment-Taggedmuons are restricted to|η|<0.1 whereCombinedmuons are less efficient due to accep- tance holes of the MS which allow for cabling and services for the ID and the calorimeters. For pseudorapidities of 2.5<|η|<2.7,Standalonemuons are used in order to extend the acceptance outside the ID coverage.
TheTightidentification criteria reduce fake muons. OnlyCombinedmuons with additional cuts on the normalized chi-squared of the combined track fit and on the compatibility between the momenta measured in the ID and MS are used.
The High-pT selection is optimized to provide a maximum momentum resolution for muons with transverse momentapT>100 GeV. This is achieved by usingCombinedmuons, but additionally requiring the muons to have at least hits in 3 different precision layers and vetoing specific regions of the MS with poor alignment due to a lack of statistics for determining the alignment constants.
More information on the different muon identification types can be found in Ref. [3].
LHC RUN 2 DATA
The LHC has commenced data-taking at a centre-of-mass energy of √
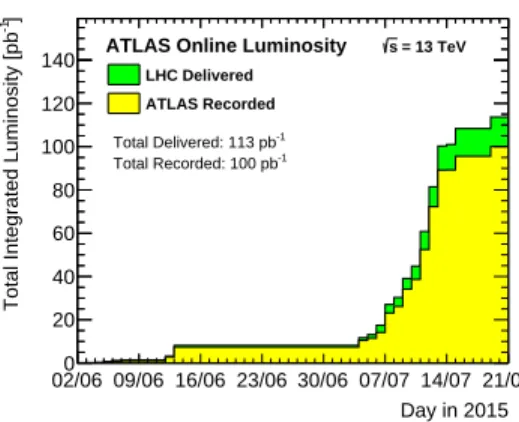
s=13 TeV in 2015. At the end of July 2015, the ATLAS dataset comprised an integrated luminosity of around 100 pb−1(cf. Figure 3) of which 85 pb−1were suitable for physics analyses.
Day in 2015 02/06 09/06 16/06 23/06 30/06 07/07 14/07 21/07 ]-1Total Integrated Luminosity [pb
0 20 40 60 80 100 120
140 ATLAS Online Luminosity s = 13 TeV LHC Delivered
ATLAS Recorded Total Delivered: 113 pb-1 Total Recorded: 100 pb-1
FIGURE 3.Cumulative luminosity versus time delivered to (green) and recorded by ATLAS (yellow) during stable beams for ppcollisions at √
s =13 TeV centre-of-mass energy in 2015. The delivered luminosity accounts for luminosity delivered from the start of stable beams until the LHC requests ATLAS to put the detector in a safe standby mode to allow for a beam dump or beam studies. The recorded luminosity reflects the DAQ inefficiency, as well as the inefficiency of the so-called warm start: when the stable beam flag is raised, the tracking detectors undergo a ramp of the high-voltage and, for the pixel system, turning on the preamplifiers. Shown is the luminosity as determined from counting rates measured by the luminosity detectors. These detectors have been calibrated with the use of the van-der-Meer beam-separation method, where the two beams are scanned against each other in the horizontal and vertical planes to measure their overlap function. The luminosity shown represents the preliminary 13 TeV luminosity calibration present at July, 30th 2015 [5].
Figure 4 shows the dimuon invariant mass spectrum measured with this dataset. It was obtained by requiring exactly two oppositely chargedCombinedmuons with transverse momentum above 4 GeV and pseudorapidity|η|<
2.5 with one of them triggering the ATLAS event readout. The dimuon invariant mass spectrum clearly resolves the J/ψ,ψ0,Υ,Υ0andZ-resonances with about 750000J/ψ→ µ+µ−and 50000Z → µ+µ−events which already allow for precise performance measurements.
[GeV]
µ− µ+
m
10 102
Events/GeV
103 104 105 106 107 108
Preliminary ATLAS
dt = 85 pb-1
∫L = 13 TeV s
FIGURE 4.Dimuon invariant mass distribution showing oppositely charged, combined muon pairs with transverse momentum above 4 GeV and pseudorapidity|η|<2.5. No specific ATLAS trigger is required [3].
MUON RECONSTRUCTION EFFICIENCY
In order to measure the muon reconstruction efficiency using J/ψ → µ+µ− orZ → µ+µ−events, a tag-and-probe method [4] is applied. Thereby, thetagmuon has to fullfil theMediumidentification criteria, to be a isolated and to have triggered the event readout. It has to have a transverse momentum of pT > 4 (28) GeV for J/ψ → µ+µ− (Z→µ+µ−) events.
Theprobemuon has to be of opposite charge compared to thetagmuon and to be an ID track (Calorimeter- Taggedmuon) withpT>2.5 (10) GeV.
Bothtagandprobemuon are restricted to pseudorapidities of|η|<2.5 and an dimuon invariant mass between 2.7 and 3.4 GeV (within 10 GeV of theZboson mass). ForZ→µ+µ−events, the muons are additionally requested to be emitted back-to-back (∆φ >2.0).
If a muon fullfilling a certain set of identification criteria is found within a cone of∆R = p
∆η2+ ∆φ2 <0.05 around theprobemuon track, the probemuon is successfully reconstructed. The efficiency for this set of identifi- cation criteria is defined as the ratio between the successfully reconstructedprobemuons and allprobemuons. The efficiencies get corrected for the ID track reconstruction efficiency by using MS tracks asprobemuons.
ForZ→µ+µ−events, the residual background contributions are estimated by using a data-driven method (Monte Carlo simulation) for the reducible (irreducible) backgrounds while forJ/ψ→µ+µ−events, the number of signal and background events are extracted using a fit to the dimuon invariant mass distribution.
Detector Region
Barrel largeBarrel smallBarrel overlapFeet TransitionEndcap largeEndcap smallBEE Forward largeForward smallCrack
Data/MC 0.991
1.01 Efficiency 0.98
0.99 1
0.5 0.55
0.6 ATLASPreliminary
= 13 TeV, 85 pb-1
s
Data 2015 MC15 µ µ Z→ muons
Medium
Stat only Sys ⊕Stat
η 2.5
− −2 −1.5 −1 −0.5 0 0.5 1 1.5 2 2.5
Data/MC 0.951
1.05
2.5 η
− −2 −1.5 −1 −0.5 0 0.5 1 1.5 2 2.5
Efficiency
0.97 0.98 0.99 1
2.5 η
− −2 −1.5 −1 −0.5 0 0.5 1 1.5 2 2.5
0.6
0.7 ATLASPreliminary
= 13 TeV, 85 pb-1
s
Data 2015 MC15 µ µ Z→ muons
Medium
Stat only Sys ⊕Stat
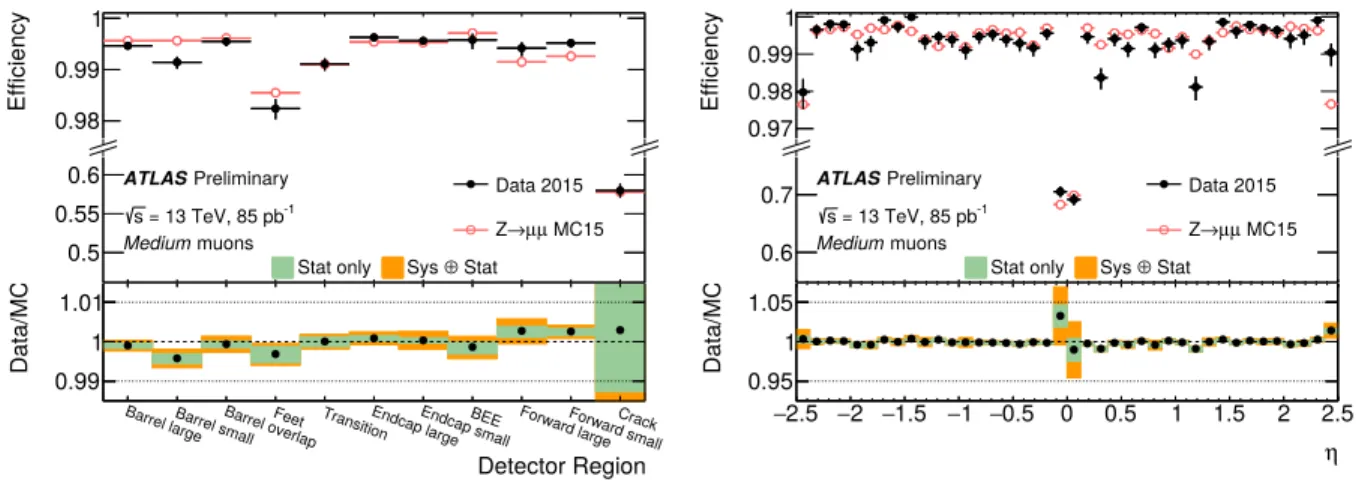
FIGURE 5.Muon reconstruction efficiency for theMediumidentification criteria measured inZ → µ+µ− decays for various regions of the ATLAS muon spectrometer (left) and the pseudorapidity of the probe muon (right). The black dots indicate the measured data points and the red circles show the simulated distribution. The bottom panel shows the ratio between observed and expected efficiency, the efficiency scale factor, where the green area indicates the statistical uncertainty and the orange area the quadratic sum of the statistical and systematic uncerterainty [3].
The upper panel of Figure 5 (left) shows both measured and simulated muon reconstruction efficiencies for various regions of the ATLAS muon spectrometer for theMediumidentification criteria. The efficiencies are found to be close to 99% except from theCrackregion which is defined by the pseudorapidity interval|η|<0.1. The bottom panel shows the ratio between observed and expected efficiency, the efficiency scale factor, including statistical and systematic errors. Figure 5 (right) shows the efficiencies and efficiency scale factors as a function of the pseudorapidity of the probe muon. Again, the efficiency drop for|η|<0.1 can be observed.
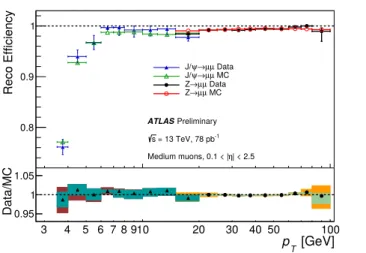
Muon reconstruction efficiencies and efficiency scale factors measured in both J/ψ → µ+µ− andZ → µ+µ− decays are shown in Figure 6 as a function of the transverse momentum of the probe muon. The combination of the measurements using both decays allows for well defined efficiency scale factors for transverse muon momenta from 4 GeV up to several 100 GeV. Both measurements are in good agreement and together provide a precise determination of the muon reconstruction efficiencies and scale factors.
Overall, the measured muon reconstruction efficiencies exceed 99% for pseudorapidities of 0.1<|η|<2.5 and transverse momenta ofpT>10 GeV. Systematic uncertainties are small and dominated by the data-driven background normalization [4] and by the possible dependence on the charge of theprobemuon.
10 102
Reco Efficiency
0.8 0.9 1
Preliminary ATLAS
= 13 TeV, 78 pb-1 s
| < 2.5 Medium muons, 0.1 < |η
Data µ µ
→ J/ψ
MC µ µ
→ J/ψ
Data µ µ Z→
MC µ µ Z→
[GeV]
pT
3 4 5 6 7 8 910 20 30 40 50 100
Data/MC0.95
1 1.05
FIGURE 6.Muon reconstruction efficiency for theMediumidentification algorithm measured inJ/ψ → µ+µ−andZ → µ+µ− decays as a function of the transverse momentum of the probe muon. The filled blue triangles (black dots) indicate the measured data points and the open green triangles (red circles) show the simulated distribution forJ/ψ →µ+µ−(Z →µ+µ−) events. The bottom panel shows the ratio between observed and expected efficiency, the efficiency scale factor, where the cyan (green) area indicates the statistical uncertainty and the red (orange) area the quadratic sum of the statistical and systematic uncterainty [3].
MUON MOMENTUM SCALE AND RESOLUTION
In order to correctly predict the muon momentum resolution in the reconstructed collision data, the simulation has to be corrected to account for imperfect alignment of the muon spectrometer. Parameters accounting for the energy losses in material, radial distortions or mismodelling of the magnetic field integral, multiple scattering, intrinsic resolution effects and detector misalignment enter the smearing of the original muon momentum [3]. Corrections are derived seperately for ID and MS muon momentum measurements allowing for a better understanding of the sources of mismodelling in simulation. They are extracted by a template-based likelihood fit usingJ/ψ→µ+µ−andZ →µ+µ− decays following the procedure described in Ref. [4].
The muon momentum scale and resolution measurement requires events with exactly 2 oppositely charged Mediummuons with pseudorapidity|η|<2.5 and transverse momentum of 5 GeV<pT <20 GeV (pT>20 GeV) for J/ψ→µ+µ−(Z →µ+µ−) decays. The dimuon invariant mass has to be in the range of 2.4 GeV< pT <3.6 GeV and 75 GeV<pT<105 GeV, respectively.
The dimuon mass spectrum is modeled by a Crystal-Ball PDF [6, 7], of which the Gaussian component esti- mates the detector resolution and the exponential component approximates the residual energy loss of the muon from traversing the material. The Crystal-Ball PDF is convoluted with a Breit-Wigner PDF of the same mean and with the width fixed to the natural width of theZboson [8]. The mean and resolution paramenters of the maximum likelihood estimate are proportional to the muon momentum scale and resolution, respectively. More detailed information can be found in Ref. [3].
Due to the limited size of the √
s= 13 TeV dataset taken in 2015, the bulk of the muon momentum scale and resolution corrections is determined from a 5 fb−1 dataset of pp-collisions taken in 2012 at √
s=8 TeV which was reprocessed using the same reconstruction as designed for 2015. The residual data-to-simulation mismodelling is then corrected using the 85 pb−1dataset taken at √
s=13 TeV.
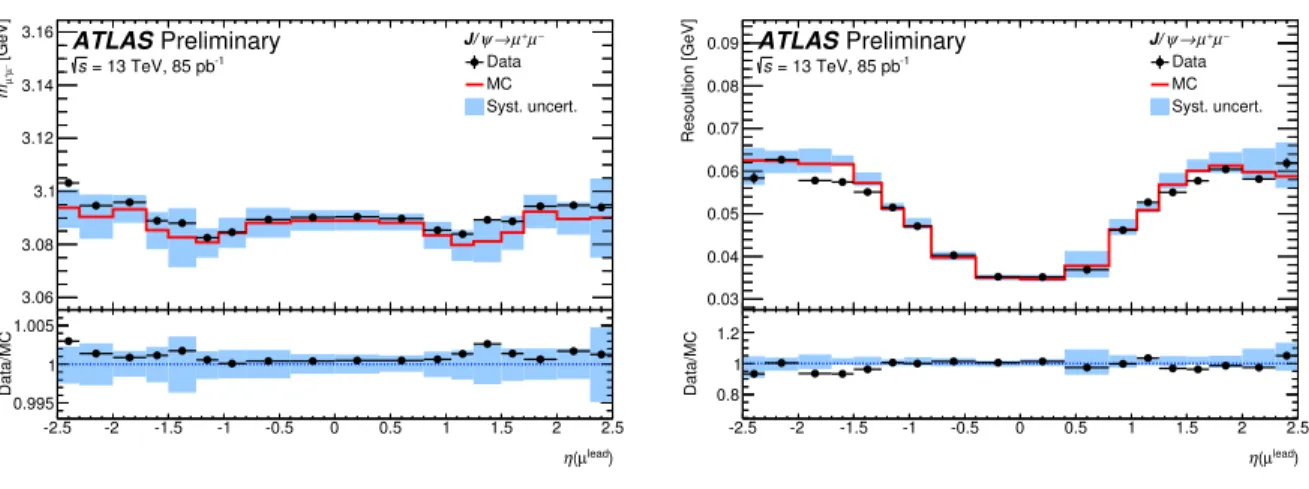
Figure 7 shows those residual mismodelling effects on muon momentum scale (left) and resolution (right) ob- tained by fitting the dimuon invariant mass resonance forJ/ψ→ µ+µ−decays. A good agreement between data and simulation withing the systematic uncertainties is observed. Figure 8 shows the same measurement usingZ→ µ+µ− decays.
-2.5 -2 -1.5 -1 -0.5 0 0.5 1 1.5 2 2.5 [GeV]−µ+µm
3.06 3.08 3.1 3.12 3.14
3.16 ATLAS Preliminary
= 13 TeV, 85 pb-1
s
µ−
µ+
→ J/ψ
Data MC Syst. uncert.
lead) (µ η
-2.5 -2 -1.5 -1 -0.5 0 0.5 1 1.5 2 2.5
Data/MC
0.995 1
1.005 -2.5 -2 -1.5 -1 -0.5 0 0.5 1 1.5 2 2.5
Resoultion [GeV]
0.03 0.04 0.05 0.06 0.07 0.08
0.09 ATLAS Preliminary
= 13 TeV, 85 pb-1
s
µ−
µ+
→ J/ψ
Data MC Syst. uncert.
lead) (µ η
-2.5 -2 -1.5 -1 -0.5 0 0.5 1 1.5 2 2.5
Data/MC 0.8
1 1.2
FIGURE 7.Mean value (left) and energy resolution (right) of the dimuon invariant mass resonance forJ/ψ→µ+µ−decays as a function of the pseudorapidity of the muon with higher transverse momentum. The black dots indicate the measured data points, the red line shows the simulated distribution and the blue area is the quadratic sum of the systematic uncertainties [3].
-2.5 -2 -1.5 -1 -0.5 0 0.5 1 1.5 2 2.5
[GeV]−µ+µm
90.6 90.8 91 91.2 91.4 91.6
91.8 ATLAS Preliminary
= 13 TeV, 85 pb-1
s
µ−
µ+
Z→ Data MC Syst. uncert.
lead) (µ η
-2.5 -2 -1.5 -1 -0.5 0 0.5 1 1.5 2 2.5
Data/MC
0.995 1
1.005 -2.5 -2 -1.5 -1 -0.5 0 0.5 1 1.5 2 2.5
Resoultion [GeV]
1.5 2 2.5 3 3.5
4 ATLAS Preliminary
= 13 TeV, 85 pb-1
s
µ−
µ+
Z→ Data MC Syst. uncert.
lead) (µ η
-2.5 -2 -1.5 -1 -0.5 0 0.5 1 1.5 2 2.5
Data/MC 0.8
1 1.2
FIGURE 8.Mean value (left) and energy resolution (right) of the dimuon invariant mass resonance forZ →µ+µ−decays as a function of the pseudorapidity of the muon with higher transverse momentum. The black dots indicate the measured data points, the red line shows the simulated distribution and the blue area is the quadratic sum of the systematic uncertainties [3].
SUMMARY
The ATLAS muon reconstruction and identification criteria for LHC Run 2 have been introduced and discussed.
The 85 pb−1dataset at √
s=13 TeV already allows for a precise determination of muon reconstruction efficiencies, momentum scale and resolution. A first measurement has been performed usingJ/ψ→µ+µ−andZ→µ+µ−decays.
The measured muon reconstruction efficiencies exceed 99% for pseudorapidities of 0.1 < |η| < 2.5 and trans- verse momenta of pT > 10 GeV. Applying the muon momentum calibration to simulation correctly describes the reconstructed muon momentum scale and resolution within the systematic uncertainties.
REFERENCES
[1] ATLAS Collaboration, The ATLAS Experiment at the CERN Large Hadron Collider, JINST3, p. S08003 (2008).
[2] ATLAS Collaboration, ATLAS muon spectrometer: Technical design report, CERN-LHCC-97-22, ATLAS- TDR-10 (1997).
[3] ATLAS Collaboration, Muon reconstruction performance in early 13 TeV data, ATL-PHYS-PUB-2015-037 Aug (2015).
[4] ATLAS Collaboration, Measurement of the muon reconstruction performance of the ATLAS detector using 2011 and 2012 LHC protonproton collision data, Eur.Phys.J.C74, p. 3130 (2014).
[5] ATLAS Collaboration, https://atlas.web.cern.ch/Atlas/GROUPS/DATAPREPARATION/PublicPlots/2015/DataSummary/ (July 2015).
[6] M. Oreglia, A Study of the Reactionsψ0→γγψ (1980), appendix D., SLAC.
[7] J. Gaiser, Charmonium Spectroscopy From Radiative Decays of theJ/ψandψ0 (1982), appendix F., SLAC.
[8] K. Oliveet al.(Particle Data Group), Review of Particle Physics, Chin. Phys.C38, p. 090001 (2014).
[9] T. Kawamotoet al., New Small Wheel Technical Design Report, CERN-LHCC-2013-006. ATLAS-TDR-020 Jun (2013).
[10] J. Illingworth and J. Kittler, A survey of the Hough transform44, 87 – 116 (1988).
![FIGURE 1. Cut-away view of the ATLAS inner detector (left) and ATLAS muon system (right) [1].](https://thumb-eu.123doks.com/thumbv2/1library_info/4011182.1541139/2.918.160.768.114.326/figure-cut-away-atlas-inner-detector-atlas-right.webp)