Study of the Flux and Spectral Variations in the VHE Emission from the Blazar Markarian 501, with the MAGIC
Telescope
D.Paneque
∗and on behalf of the MAGIC collaboration
†∗Stanford Linear Accelerator Center (SLAC) / Max-Planck-Institut für Physik, München (MPI)
†updated author list can be found athttp://wwwmagic.mppmu.mpg.de/collaboration/members
Abstract. The blazar Markarian 501 (Mrk 501) was observed above 100 GeV with the MAGIC Telescope during May, June and July 2005. The high sensitivity of the instrument made possible the detection of the source with high significance in each of the observing nights. During this observational campaign, the emitted gamma-ray flux from Mkn 501 was found to vary by one order of magnitude, and showed a high correlation with spectral changes. Intra-night flux variability was also observed, with flux-doubling times of∼2 minutes. The data showed a clear evidence of a spectral peak (in theνFνrepresentation) during the nights when the gamma-ray activity was highest. The location of this spectral feature was found to be correlated with the emitted gamma-ray flux. In these proceedings we discuss some of the results of this unprecedented spectral and temporal analysis of Mrk 501 observations in the very high energy range.
Keywords: MAGIC, IACT, Mrk 501, Blazar, AGN,γ-ray astronomy PACS: 95.85.Pw, 98.70.Rz, 95.55.Ka
OBSERVATION AND RESULTS
The observations of Mrk 501 in the Very High Energy (VHE) domain were carried out with the Major Atmospheric Gamma-ray Imaging Cherenkov (MAGIC) Telescope (see [2, 7, 3, 4] for details of MAGIC). The net observation time on the source is 31.6 hours (24 nights) between May and July 2005. Quasi-simultaneously to the MAGIC data, Mrk 501 was regularly observed with KVA as a part of Tuorla Observatory’s blazar monitoring program1. And we also used 2-10 keV data taken with theRXTEsatellite’s All-Sky-Monitor (RXTE/ASM)2.
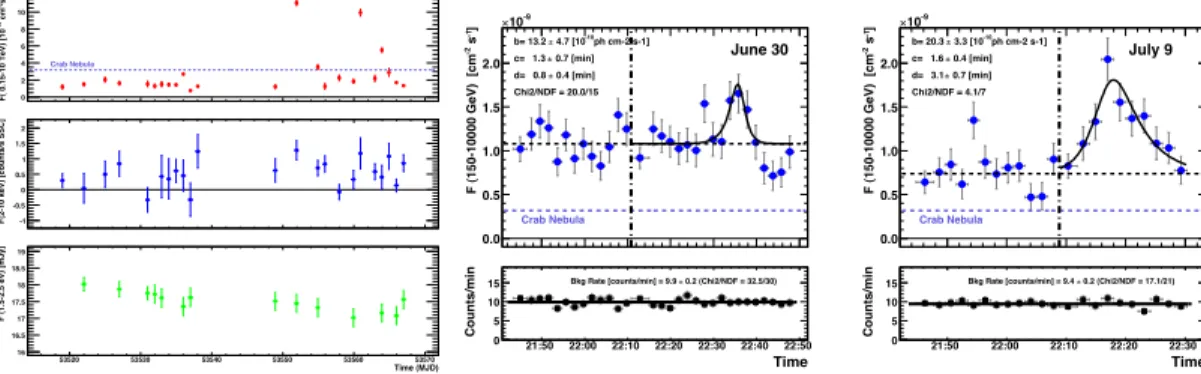
The overall Light Curve(LC) of Mrk 501 during the MAGIC observation campaign is shown in the left-hand plot of Fig. 1. The observed flux is shown in three energy bands: VHE (0.15GeV-10TeV), X-rays (2keV-10keV), and optical (1.5eV-2.5eV) as measured by MAGIC,RXTE/ASM and KVA, respectively. The X-ray and optical fluxes are computed as weighted averages usingRXTE/ASM and KVA measurements taken simultaneously with the MAGIC observations plus/minus a time tolerance of 0.2 days. A smaller time tolerance substantially decreases the number of X-ray points that can be used. The flux level of the Crab Nebula (lilac-dashed horizontal line in the top plot) is also shown in the left-hand plot of Fig. 1 for comparison. The Crab nebula flux was obtained by applying the very same analysis used for Mrk 501 to the MAGIC Crab nebula data taken during December 2005 under observing conditions similar to those for Mrk 501. The estimated Crab Nebula flux level is therefore roughly affected by the same systematics as the fluxes obtained for Mrk 501. We foundFCrab(>0.15 TeV)=(3.2±0.1)×10−10cm−2s−1, thereafter referred to as Crab Unit (c.u.). The left-hand plot of Fig. 1 shows that the VHE flux from Mrk 501 was at about 0.5 c.u.
during most of the observation nights; yet there are significant deviations from this meanγ-ray emission, with large flux variations occurring in consecutive nights.
During the two nights with the highest VHE activity (>3c.u.), namely June 30 and July 9, Mrk 501 clearly showed intra-night flux variations. The corresponding LC in the 0.15-10 TeV band is shown in the middle and right-hand plots of Fig. 1 with a time binning of∼2 minutes. A constant line fit to the whole LC gives aχ2/NDF=47.9/30 (probabilityp=2.0×10⁻²) for the night of June 30, and aχ2/NDF=80.6/21 (p=6.4·10−9) for the night of July 9. Therefore, the emission above 150 GeV during the two nights is statistically inconsistent with being constant. The
1 http://users.utu.fi/kani/1m/.
2 The data are publicly available athttp://heasarc.gsfc.nasa.gov/xte_weather/.
burst’s amplitude and duration, as well as its rise/fall times, were quantified according to the following function [8]:
F(t) =a+ b 2−t−tc0 +2t−td0
(1)
This model parametrizes a flux variation (flare) superposed on a stable emission:F(t)asymptotically tends toawhen t→ ±∞. The parameterais the assumed constant flux at the time of the flare (cf. the horizontal black dashed lines in the middle and right-hand plot of Fig. 1);t0is set to the time corresponding to the point with the highest value in the LC; andb,c,dare left free to vary. The latter two parameters denote the flux-doubling rise and fall times, respectively.
The resulting fit parameters are shown in the insets of the middle and right-hand plot of Fig. 1, showing flux-doubling times of the order of 2 minutes. This is the fastest flux variability ever observed from Mrk 501. These bursts were also studied in four non-overlapping energy ranges; 0.15-0.25 TeV, 0.25-0.6 TeV, 0.6-1.2 TeV and>1.2 TeV. The main outcome of this study isa)the burst from June 30 is significant only in the energy range 0.25-0.6 TeV, while the burst from July 9 is significantly observed in all energy ranges;b)in the July 9 burst, the highest energies are delayed by 4
±1 minutes with respect to the lowest energies; andc)in the July 9 burst, the relative amplitude of the flux variation increases with energy. Further details from these studies can be found elsewhere [1].
Mrk 501 showedenergy-dependent flux variationsthroughout the entire MAGIC observational campaign. We followed the prescription given in [9] to quantify the flux variability by means of the fractional variability parameter Fvar, as a function of energy. The outcome of this calculation is shown in the left-hand plot of Fig. 2; the flux variability increases with energy. The same tendency was reported at X-ray frequencies, but with lower values ofFvar[5].
During our observations, the VHE emission of Mrk 501 was very dynamic, showing significantspectral variability on a timescale of days. Nevertheless, most of the data are well described by a simple Power-law (PL) function. This does not hold for the two flaring nights of June 30 and July 9 which show clear spectral curvature and thus they are fit with a log-parabolic (LP) function.
PL: dF
dE =K0·! E 0.3TeV
"−a
LP: dF
dE =K0·! E 0.3TeV
"−a−b·log10# E
0.3TeV
$
(2) Here,K0is a normalization factor,ais the spectral index at 0.3 TeV, andbis a curvature parameter.
The right-hand plot of Fig. 2 shows theenergy spectra(EBL corrected) of Mrk 501 for the flaring nights (June 30 and July 9) for three different flux levels,low,mediumandhigh, which contain 12, 8 and 2 (“non-flaring”) nights respectively. See caption of Fig. 2 for definition of flux levels. The data shows very clearly a hardening of the spectra with increasing flux. Besides, the data from the flaring nights suggest the presence of aspectral peak. The location of this peak, determined using the fit parameters and errors from the log-parabolic fit, is 0.84±0.30 TeV and 0.44
±0.16 TeV for June 30 and July 9, respectively. If this peak exists for the data setslow,mediumandhigh, then its location is certainly below 0.1 TeV. Therefore, the location of such spectral peak is very probably correlated with the source luminosity.
CONCLUSIONS
We have undertaken a systematic study of the temporal and spectral variability of the nearby blazar Mrk 501 with the MAGIC telescope at energies>0.1 TeV. During 24 observing nights between May and July 2005, all of which yielded significant detections, we measured fluxes and spectra at levels of baseline activity ranging from<0.5 to>1 c.u.. During two nights, on June 30 and July 9, Mrk 501 underwent into a clearly active state with aγ-ray emission
>3 c.u., and flux-doubling times of∼2 minutes. An overall trend of harder spectra for higher flux was clearly seen.
The VHEγ-ray variability was found to increase with energy, and it is significantly higher than the variability at X-ray frequencies. A spectral peak, at a location dependent on source luminosity, was clearly observed during the active states. All these features are naturally expected in synchro-self-Compton (SSC) models of blazar VHE emission. See [1] for further details from these observations.
REFERENCES
1. Albert,J et al 2007, Submitted to ApJ, astro-ph/0702008 2. Baixeras, C. et al 2004, Nucl. Instr. Meth. A, 518, 188
]-1s-2 cm-10F( 0.15-10 TeV) [10 0
2 4 6 8 10 12
Crab Nebula
F(2-10 keV) [counts/s SSC] -1 -0.5 0 0.5 1 1.5 2
Time (MJD)
53520 53530 53540 53550 53560 53570
F (1.5-2.5 eV) [mJy]
16 16.5 17 17.5 18 18.5 19
]-1 s-2F (150-10000 GeV) [cm
0.0 0.5 1.0 1.5 2.0 10-9
×
Crab Nebula ph cm-2 s-1]
4.7 [10-10
± b= 13.2
0.7 [min]
± c= 1.3
0.4 [min]
± d= 0.8 Chi2/NDF = 20.0/15
June 30
Time 21:50 22:00 22:10 22:20 22:30 22:40 22:50
Counts/min
0 5 10
15 Bkg Rate [counts/min] = 9.9 ± 0.2 (Chi2/NDF = 32.5/30) ]-1 s-2F (150-10000 GeV) [cm
0.0 0.5 1.0 1.5 2.0 10-9
×
Crab Nebula ph cm-2 s-1]
3.3 [10-10
± b= 20.3
0.4 [min]
± c= 1.6
0.7 [min]
± d= 3.1 Chi2/NDF = 4.1/7
July 9
Time 21:50 22:00 22:10 22:20 22:30
Counts/min
0 5 10
15 Bkg Rate [counts/min] = 9.4 ± 0.2 (Chi2/NDF = 17.1/21)
FIGURE 1. Left-hand: Multi-frequency LC during the MAGIC observations of Mrk 501 (May-July 2005).Top)MAGIC flux above 0.15 TeV. The Crab flux is also shown for comparison (lilac dashed horizontal line).Middle) RXT E/ASM 2-10 keV flux.
Bottom)KVA∼1.5-2.5 eV flux. Error bars denote 1σstatistical uncertainties. The X-ray/optical data were selected to match the MAGIC data within a time window of 0.2 days.Middle and Right-hand: Integrated-flux LCs of Mrk 501 for the flare nights of June 30 and July 9. Horizontal bars represent the 2-minute time bins, and vertical bars denote 1σstatistical uncertainties. For comparison, the Crab emission is also shown as a lilac dashed horizontal line. The vertical dot-dashed line divides the data into
’stable’ (i.e., pre-burst) and ’variable’ (i.e., in-burst) emission emission. The horizontal black dashed line represents the average of the ’stable’ emission. The solid black curve represents the best-fit flare model (see eq. 1). The insets report the fit parameters and goodness of the fit. The bottom plots show the mean background rate during each of the 2-minute bins of the LCs. The insets report the mean background rate during the entire night, resulting from a constant fit to the data points. The goodness of such fit is also given. The background rates are constant along the entire night. Consequently, the variations seen in the upper panels of the middle and right-hand plot correspond to actual variations of the VHEγ-ray flux from Mrk501, thus ruling out detector instabilities and/or atmospheric changes.
log E[GeV]
2 2.5 3 3.5 4
varF
0 0.2 0.4 0.6 0.8 1 1.2 1.4 1.6
E [TeV]
10-1 1 10
s)]2 dF/dE [TeV/(cm2E
10-12
10-11
10-10
June 30 : a=1.73 +/- 0.06; b=0.30 +/- 0.08; Chi2/NDF = 5.0/10 July 09 : a=1.91 +/- 0.07; b=0.27 +/- 0.14; Chi2/NDF = 13.1/10 High Flux : a=2.10 +/- 0.06; Chi2/NDF = 4.4/7 Medium Flux : a=2.24 +/- 0.05; Chi2/NDF = 4.2/7 Low Flux : a=2.26 +/- 0.07; Chi2/NDF = 10.2/7
FIGURE 2. Left-hand: Fractional variability parameter as derived for 5 energy bins. Vertical bars denote 1σ uncertainties, horizontal bars indicate the width of each energy bin.Right-hand: Energy spectra of Mrk 501 for the flaring nights of June 30 (black squares) and July 9 (red up-triangles), and for three data sets which group nights according to whether their integral flux above 150 GeV, F150 GeV (measured inCrab Units (c.u.)), was high (1.0 c.u.<F150 GeV; green down triangles), medium (0.5 c.u.<F150 GeV<1.0 c.u.; blue open circles), or low (F150 GeV<0.5 c.u.; pink open squares). Vertical bars denote 1σuncertainties, horizontal bars denote energy bins. Lines show best fits using log-parabolic (for flare nights) and power-law (for high/medium/low flux levels) functions. The insets report the spectral indices derived from the fit, as well as the goodness of such fit. The spectra are corrected for EBL extinction using [6]’s ’Low’ EBL model.
3. Cortina, J. et al 2005, in Proc. 29th International Cosmic Ray Conference, Pune (India), astro-ph/0508274 4. Gaug M. 2006, PhD Thesis, IFAE Barcelona
http://wwwmagic.mppmu.mpg.de/publications/theses/MGaug.pdf 5. Gliozzi, M. et al 2006, ApJ, 646, 61
6. Kneiske, T. M., et al 2004, A&A, 413, 807 7. Paneque, D., 2004,PhD Thesis, MPI Munich
http://wwwmagic.mppmu.mpg.de/publications/theses/David_thesis.ps.gz 8. Schweizer T. 2004, PhD Thesis, IFAE Barcelona
http://wwwmagic.mppmu.mpg.de/publications/theses/ThomasS_thesis.ps.gz 9. Vaughan, S., et al 2003, MNRAS, 345, 1271