Proceedings of Top2017 ATL-PHYS-PROC-2017-259 November 28, 2017
Top quark mass in ATLAS
Benjamin Pearson
on behalf of the ATLAS Collaboration
Max-Planck-Institute for Physics D-80805 Munich, GERMANY
ATLAS has made several measurements of the top quark mass using proton-proton collision data recorded in 2012 at the LHC with a centre- of-mass energy of 8 TeV. Those summarised here include an indirect determination of the top quark pole mass from lepton differential cross- sections; previous direct measurements of the top quark mass in the tt → dilepton and tt → all-jets decay channels as well as in the t-channel of single-top-quark production; and lastly, the new direct measurement of the top quark mass in the tt → lepton+jets decay channel and its combination with previous measurements.
PRESENTED AT
10
thInternational Workshop on Top Quark Physics Braga, Portugal, September 17–22, 2017
arXiv:1711.09763v1 [hep-ex] 27 Nov 2017
1 Introduction
The top quark mass (m
top) is an important parameter in the Standard Model (SM) and, as such, its precise measurement is helpful in evaluating the internal consistency of the SM and in testing possible extensions. At the CERN Large Hadron Collider (LHC), top quarks are primarily produced as quark-antiquark pairs (tt) and in the SM the top quark decays almost exclusively to a W boson and a b quark. Thus, the tt decays are governed by the decay modes of the W bosons, namely leptonic decay W → `ν to a charged lepton (`) and a neutrino (ν), and hadronic decay W → qq to a pair of quarks (q) leading to jets. Therefore, the final state topology options for tt production are denoted by tt → all-jets, tt → lepton+jets, and tt → dilepton.
The ATLAS experiment [1] has made several measurements of the top quark mass using LHC proton-proton collisions at a centre-of-mass (CM) energy of 8 TeV. This proceeding first gives a summary of an indirect determination of the top quark pole mass (m
poletop), performed using lepton differential cross-sections [2]. Second, a brief review is given of previous direct measurements of m
topin the tt → dilepton [3]
and tt → all-jets [4] decay channels as well as in the t-channel of single-top-quark production [5]. Lastly, a summary is given for the new direct measurement in the tt → lepton+jets channel, along with its combination with previous measurements [6].
2 Indirect determination of m pole top
Using tt → eµ + X events, eight differential cross-sections are measured: the single lepton transverse momentum (p
`T) and absolute pseudorapidity (|η|
`), the dilepton system transverse momentum, invariant mass and absolute rapidity (p
eµT, m
eµ, |y
eµ|), the azimuthal angle between the two leptons (∆φ
eµ), and the scalar sum of the trans- verse momentum and sum of the energies of the two leptons (p
eT+ p
µTand E
e+ E
µ).
Many of the measured differential cross-sections are sensitive to the top quark mass, which is extracted from the normalised distributions, after correcting for ac- ceptance and resolution effects of the detector, by fits to QCD predictions from the MCFM program [7] at next-to-leading order (NLO) in the strong coupling α
s. This indirect determination therefore corresponds to the top quark pole mass [8]. A com- bined fit to all of the distributions results in m
poletop= 173.2 ± 0.9 (stat) ± 0.8 (syst) ± 1.2 (theo) GeV, with a total uncertainty of 1.6 GeV [2]. The theory uncertainty is dominated by variations in the QCD factorisation and renormalisation scales.
3 Previous direct measurements of m top at 8 TeV
The previous direct measurements discussed here include the tt → all-jets [4], tt →
dilepton [3], and single-top [5] analyses performed at a CM energy of 8 TeV. For
comparison, their results are all given in Table 1 with a partial breakdown of their uncertainties. These direct measurements all use the template method, in which simulated distributions of variables that are sensitive to m
topare fit to analytical functions to interpolate between several discrete values of the input m
top. A fit to the distribution in data yields the value of m
topthat best describes the data. This mass corresponds to the mass definition used in the MC event simulation. How this relates to the top quark pole mass is an object of theoretical investigation [8].
The measurement in the t-channel of single-top-quark production uses the invari- ant mass of the lepton and b-jet system (m
`b) as its estimator for m
topand uses a neural network to better distinguish between signal and background events. A binned maximum-likelihood fit to the data gives m
top= 172.2 ± 0.7 (stat) ± 2.0 (syst) GeV, where by far the largest contribution to the uncertainty comes from variations in the jet energy scale (JES), as shown in the first column of Table 1.
The measurement in the tt → all-jets channel uses a ratio of three-jet to dijet in- variant masses (R
3/2= m
qqb/m
qq) as its estimator for m
top. This significantly reduces the sensitivity of the measurement to variations in the JES. A binned minimum-χ
2fit to the data yields m
top= 173.72 ± 0.55 (stat) ± 1.01 (syst) GeV, where the dominant sources of uncertainty still come from variations in the JES as well as changes to the hadronisation model, as shown in the second column of Table 1.
The measurement in the tt → dilepton channel also uses the invariant mass of the lepton and b-jet system (m
`b) as its estimator for m
top. In this analysis, the total un- certainty in m
topis minimised by trading statistical precision for decreased systematic uncertainties using a varied requirement on the minimum transverse momentum of the lepton and b-jet system (p
T,`b). An unbinned maximum-likelihood fit to the data gives m
top= 172.99 ± 0.41 (stat) ± 0.74 (syst) GeV, where the dominant sources of uncertainty come from variations in the JES as well as in the bJES (b-jet energy scale), as shown in the third column of Table 1. With a total uncertainty of 0.84 GeV, this is the most precise single ATLAS measurement of m
top.
single-top all-jets dilepton lepton+jets
[GeV] [GeV] [GeV] [GeV]
m
top172.2 173.72 172.99 172.08
Statistical unc. 0.7 0.55 0.41 0.39
Dominant syst. unc. JES: 1.5 JES: 0.60 JES: 0.54 JES: 0.54 Had: 0.7 Had: 0.64 bJES: 0.30 b-tagging: 0.38
Total systematic unc. 2.0 1.01 0.74 0.82
Total uncertainty 2.1 1.15 0.84 0.91
Table 1: Direct measurements of m
topin the single-top [5], tt → all-jets [4], tt →
dilepton [3], and tt → lepton+jets [6] analyses at 8 TeV, where Had. is hadronisation
and (b)JES is the (b-)jet energy scale.
4 New direct m top measurement and combination
The most recent direct measurement of m
topat 8 TeV is in the tt → lepton+jets decay channel. In contrast to the other direct measurements that only used templates of one distribution, this analysis uses three distributions in a 3-D template method that was developed for the tt → lepton+jets analysis at 7 TeV [9]. The three distributions are the reconstructed top quark mass m
recotop, hadronicically decaying W mass m
recoW, and ratio of jet transverse momenta
R
recobq= p
bThad+ p
bTlepp
qT1+ p
qT2(1)
where q
1and q
2are the light jets assigned to the W boson and b
had(b
lep) is the b- jet corresponding to the top quark with the hadronically (leptonically) decaying W boson.
These distributions are fit to analytical functions which are parameterised not only as functions of the input m
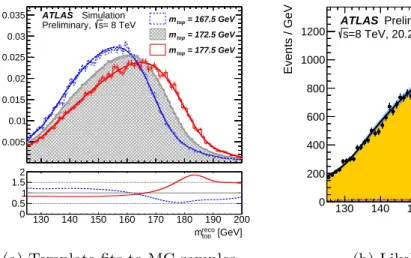
top, but also a jet energy scale factor (JSF) and a b-to-light-jet energy scale factor (bJSF), depending on the distribution’s sensitivity to changes in all of the above. As an example, the significant sensitivity of the m
recotopdistribution to changes in the input m
topis shown in Figure 1a. The simultaneous measurement of m
top, JSF, and bJSF reduces the sizeable JES and bJES induced uncertainties in m
top.
Similar to the 8 TeV tt → dilepton measurement, the total uncertainty in m
topis minimised, this time with a selection based on a boosted decision tree (BDT) algorithm. The BDT algorithm is used to distinguish events with a correct jet-to- parton matching, with the underlying assumption that these events will have smaller systematic uncertainties. A requirement is made on the BDT output that results in the smallest total uncertainty in m
top.
The unbinned 3-D maximum-likelihood fit to the data (shown for the m
recotopdistri- bution in Figure 1b) results in m
top= 172.08 ± 0.39 (stat) ± 0.82 (syst) GeV, where the dominant sources of uncertainty come from variations in the JES and b-tagging, as shown in the fourth column of Table 1. The total uncertainty of 0.91 GeV is a 19% improvement compared to the same analysis without a BDT requirement, and is altogether a 29% improvement over the 7 TeV tt → lepton+jets measurement.
Given the new result, a combination is made of the ATLAS m
topresults in the
tt → lepton+jets and tt → dilepton channels at both 7 and 8 TeV, closely following
the strategy of the previous combination of results at 7 TeV [9]. The combination is
performed using the best linear unbiased estimate (BLUE) method [10, 11] for which
the central values, the list of uncertainty components, and the correlations ρ of the
estimators for each uncertainty component have to be provided. These correlations
are evaluated and can be seen for one pair of measurements in Figure 2a with the
130 140 150 160 170 180 190 200
Normalised events / GeV
0.005 0.01 0.015 0.02 0.025 0.03
0.035 mtop = 167.5 GeV
= 172.5 GeV mtop
= 177.5 GeV mtop
ATLAS Simulation
= 8 TeV s Preliminary,
[GeV]
reco
mtop
130 140 150 160 170 180 190 200
Ratio
0 0.5 1 1.5 2
(a) Template fits to MC samples
[GeV]
reco
mtop
130 140 150 160 170 180 190 200
Events / GeV
0 200 400 600 800 1000 1200
data, l+jets Best fit background Best fit
Uncertainty ATLAS Preliminary
=8 TeV, 20.2 fb-1
s
(b) Likelihood fit to data
Figure 1: (a) Template fits to signal Monte Carlo (MC) events, showing the sensi- tivity of m
recotopto the input m
top. Each template is overlaid with the corresponding probability density function (pdf). The ratio shown in the lower panel is calculated with respect to the central sample pdf. (b) Results of the likelihood fit to the data in the m
recotopdistribution. The figure shows the data distribution with statistical uncertainties along with the fitted pdf and its uncertainty. [6]
pairwise shift in m
top(∆m
top) when simultaneously varying a pair of measurements for each systematic uncertainty.
In Figure 2b, which shows the uncertainty in the combination of the two most precise results as a function of their correlation, one can easily see the importance of decreasing correlation. This provides for the significant improvement in precision over the most precise single measurement.
Figure 3a shows the combination of the four measurements with one addition at a time, in order of their significance in BLUE. The red star indicates the new ATLAS combined measurement of m
topas adding the tt → dilepton measurement at 7 TeVresults in an insignificant change compared to the statistical precision of the uncertainty in the previous combined result. This distinguishing power is available thanks to the individual measurements having evaluated the statistical precision of the systematic uncertainties. The total uncertainty in the combined result quoted is known to ±0.4 GeV.
The new ATLAS combined result of m
top= 172.51 ± 0.27 (stat) ± 0.42 (syst) GeV is shown in relation to other combined results in Figure 3b. The result from CMS [14]
is consistent with that of ATLAS and has a similar total uncertainty. The CDF
result [12] is consistent with both LHC results, while that of D0 [13] is somewhat
larger.
(8TeV) [GeV]
l+jets
mtop
∆
−0.8 −0.6 −0.4 −0.2 0 0.2 0.4 0.6 0.8 (8TeV) [GeV]dil top m∆
−0.8
−0.6
−0.4
−0.2 0 0.2 0.4 0.6 0.8
= +1 ρ
= -1 ρ ATLAS Preliminary
(a)
ρ
−1 −0.8−0.6−0.4−0.2 0 0.2 0.4 0.6 0.8 1 )[GeV]top(mσ
0 0.2 0.4 0.6 0.8 1 1.2 1.4 1.6 1.8
(8TeV)) = 0.85 GeV dil
(mtop σ
(8TeV)) = 0.91 GeV l+jets
(mtop σ
) = 0.56 GeV (mtop σ
ρ ) vs.
(mtop σ
ATLAS Preliminary
(b)
Figure 2: (a) The pairwise differences in m
topwhen simultaneously varying a pair of measurements for the subcomponents of a systematic uncertainty. (b) The uncer- tainty of the combination of the two results from 8 TeV data as a function of their correlation (blue full line). The blue point corresponds to the actual correlation. [6]
168 170 172 174 176 178
[GeV]
mtop 0.5
6
(7 TeV)
dil
+ mtop 172.50 ± 0.27 ± 0.42
(7 TeV)*
l+jets
+ mtop 172.51 ± 0.27 ± 0.42
(8 TeV)
l+jets
+ mtop 172.56 ± 0.28 ± 0.48
(8 TeV)
dil
mtop 172.99 ± 0.41 ± 0.74
Successive combination ATLAS Preliminary
syst.
± stat.
±
top m
stat. uncertainty total uncertainty
*ATLAS Combination stat. uncertainty total uncertainty
(a) Significance
165 170 175 180
[GeV]
mtop 0.5
6
ATLAS (Sep 2017) 172.51 ± 0.27 ± 0.42 CMS (Apr 2016) 172.44 ± 0.13 ± 0.47 D0 (Jul 2016) 174.95 ± 0.40 ± 0.64 CDF (Mar 2014) 173.16 ± 0.57 ± 0.74
Combinations ATLAS Preliminary
syst.
± stat.
±
top m
stat. uncertainty total uncertainty ATLAS Combination
stat. uncertainty total uncertainty
(b) Comparisons
![Figure 3: Results of the combination [6]. Figure (a) shows the combined result when successively adding results to the most precise one](https://thumb-eu.123doks.com/thumbv2/1library_info/4003863.1540704/6.918.170.802.578.856/figure-results-combination-figure-combined-successively-results-precise.webp)
