ATLAS-CONF-2017-032 24May2017
ATLAS CONF Note
ATLAS-CONF-2017-032
22nd May 2017
Measurement of inclusive and differential cross sections in the H → Z Z∗ → 4` decay channel at
13 TeV with the ATLAS detector
The ATLAS Collaboration
Inclusive and differential fiducial cross sections of Higgs-boson production in proton-proton collisions are measured in theH → Z Z∗→4`decay channel. The proton-proton collision data were produced at the Large Hadron Collider at a centre-of-mass energy of 13 TeV and recorded by the ATLAS detector in 2015 and 2016, corresponding to an integrated luminosity of 36.1 fb−1. The inclusive fiducial cross section in theH → Z Z∗ → 4`decay channel is measured to be 3.62 +0−0..5350(stat) +0−.25
0.20 (sys) fb, in agreement with the Standard Model prediction of 2.91±0.13 fb. The cross section is also extrapolated to the total phase space including all Standard Model Higgs-boson decays. Several differential fiducial cross sections are measured for observables sensitive to the Higgs-boson production and decay, including kinematic distributions of the jets produced in association with the Higgs boson.
Good agreement is found between data and Standard Model predictions. The results are used to put constraints on anomalous Higgs-boson interactions with Standard Model particles, using the pseudo-observable framework.
© 2017 CERN for the benefit of the ATLAS Collaboration.
Reproduction of this article or parts of it is allowed as specified in the CC-BY-4.0 license.
Contents
1 Introduction 2
2 The ATLAS detector 3
3 Theoretical predictions and event simulation 4
4 Event selection 6
5 Fiducial phase space 7
6 Background estimates 8
7 Measured data yields 10
8 Signal extraction and correction for detector effects 10
9 Systematic uncertainties 15
10 Results 16
11 Conclusion 23
1 Introduction
The ATLAS and CMS Collaborations at the Large Hadron Collider (LHC) have performed extensive studies of the Higgs-boson properties in the past few years. The Higgs-boson mass has been measured to bemH =125.09±0.24 GeV [1] and no significant deviations from Standard Model (SM) predictions have been found in the cross sections measured per production mode, the branching ratios [2], or spin and parity quantum numbers [3, 4]. Furthermore, inclusive and differential fiducial cross sections of Higgs-boson production, defined as event yields corrected for the detector response, have been measured by the ATLAS and CMS Collaborations in proton-proton (pp) collisions at a centre-of-mass energy of
√s = 8 TeV, using the 4`(` = e, µ),γγ, andeνµνfinal states [5–10]. The measured differential cross
sections are also in good agreement with the SM predictions.
This paper presents the first measurements of inclusive and differential fiducial cross sections in the H →Z Z∗→4`decay channel usingppcollisions at
√s =13 TeV recorded with the ATLAS detector.
The combined effect of a higher centre-of-mass energy and an integrated luminosity of 36.1 fb−1is expected to increase the number of Higgs-boson events by a factor of almost four compared to the previous analysis at
√s =8 TeV. Significantly larger gains are expected in the regions of the differential distributions that probe higher momentum scales due to increased parton-parton luminosities. The differential cross sections presented in this paper are measured in a fiducial phase space to avoid model-dependent extrapolations.
The observed distributions are corrected for detector inefficiency and resolution.
Fiducial cross sections are presented both inclusively and separately for each of the final states of the H →Z Z∗→4`decay (4e, 4µ, 2e2µ, 2µ2e). Differential fiducial cross sections are presented for various observables that describe Higgs-boson production and decay inppcollisions. They are not split into the
different final states or Higgs-boson production modes, such as gluon fusion (ggF) or vector-boson fusion (VBF). The Higgs-boson transverse momentum1pT,4`can be used to test perturbative QCD calculations, especially when separated into exclusive jet multiplicities. This variable is also sensitive to the Lagrangian structure of the Higgs-boson interactions [11]. The Higgs-boson rapidity distribution |y4`| is sensitive to the parton distribution functions (PDFs) of the colliding protons. The decay variables |cosθ∗| and m34test the spin and parity nature of the Higgs boson. The variable|cosθ∗|is defined as the magnitude of the cosine of the decay angle of the leading lepton pair in the four-lepton rest frame with respect to the beam axis. The variablesm12 and m34 refer to the invariant masses of the leading and subleading lepton pairs and correspond to the invariant mass of the on-shell and off-shell Z bosons produced in the Higgs-boson decay. The number of jets Njets produced in association with the Higgs boson and the transverse momentum of the leading jetplead.jet
T both provide sensitivity to the theoretical modelling of high-pTquark and gluon emission. The invariant massmj jof the two leading jets in the event is sensitive to different production mechanisms. The signed angle between the two leading jets in the transverse plane2∆φjjis another observable that tests the spin and parity nature of the Higgs boson [12].
Providing fiducial cross sections simplifies the testing of theoretical models withH → Z Z∗ →4`final states since the response of the ATLAS detector has been removed. As an example, the cross section in them12vsm34parameter plane is interpreted in the framework of pseudo-observables [13], and limits are set on parameters describing anomalous Higgs-boson interactions with leptons andZ bosons.
2 The ATLAS detector
The ATLAS detector [14] is a multi-purpose detector with a forward-backward symmetric cylindrical geometry. At small radii, the inner detector (ID), immersed in a 2 T magnetic field produced by a thin superconducting solenoid located in front of the calorimeter, is made up of fine-granularity pixel and microstrip detectors. These silicon-based detectors cover the pseudorapidity range|η| <2.5. A gas-filled straw-tube transition radiation tracker complements the silicon tracker at larger radii up to |η| < 2 and also provides electron identification capabilities based on transition radiation. The electromagnetic (EM) calorimeter is a lead/liquid-argon sampling calorimeter with accordion geometry. The calorimeter is divided into a barrel section covering|η| < 1.475 and two end-cap sections covering 1.375< |η| <3.2.
For |η| < 2.5 it is divided into three layers in depth, which are finely segmented in η and φ. A thin presampler layer, covering |η| < 1.8, is used to correct for fluctuations in upstream energy losses. A hadronic calorimeter in the region|η| <1.7 uses steel absorbers and scintillator tiles as the active medium.
A liquid-argon calorimeter with copper absorbers is used in the hadronic end-cap calorimeters, which cover the region 1.5< |η| < 3.2. A forward calorimeter using copper or tungsten absorbers with liquid argon completes the calorimeter coverage up to |η| = 4.9. The muon spectrometer (MS) measures the deflection of muon tracks within|η|<2.7, using three stations of precision drift tubes, with cathode strip chambers in the innermost layer for|η| >2.0. The deflection is provided by a toroidal magnetic field from air-core superconducting magnets, with an integral of approximately 3 T·m and 6 T·m in the central and end-cap regions, respectively. The muon spectrometer is instrumented with trigger chambers covering
|η| <2.4. Events are selected using a first-level trigger implemented in custom electronics, which reduces
1ATLAS uses a right-handed coordinate system with its origin at the nominal interaction point (IP) in the centre of the detector and thez-axis along the beam pipe. The x-axis points from the IP to the centre of the LHC ring, and the y-axis points upward. Cylindrical coordinates(r, φ)are used in the transverse plane,φbeing the azimuthal angle around thez-axis. The pseudorapidity is defined in terms of the polar angleθasη=−ln tan(θ/2).
2∆φjjis defined as∆φjj=φj1−φj2, ifηj1> ηj2, otherwise∆φjj=φj2−φj1.
the event rate to a maximum of 100 kHz using a subset of detector information. Software algorithms with access to the full detector information are then used in the high-level trigger to yield a recorded event rate of about 1 kHz.
3 Theoretical predictions and event simulation
The Higgs-boson production cross sections and decay branching ratios, as well as their uncertainties, are taken from Refs. [15–18], and are referred to as LHCXSWG. The cross section for Higgs-boson production via ggF is available at next-to-next-to-next-to-leading order (N3LO) in QCD and has next-to-leading order (NLO) electroweak (EW) corrections applied [19–32]. The cross section for the VBF process is calculated with full NLO QCD and EW corrections [33–35], and approximate next-to-next-to-leading-order (NNLO) QCD corrections are applied [36]. The cross sections for the production of a weak boson in association with a Higgs boson,V H (V =W,Z), are calculated at NNLO accuracy in QCD [37,38] and NLO EW radiative corrections [39] are applied. The cross section for the associated production of a Higgs boson with at¯t pair (t¯t H) is calculated up to NLO accuracy in QCD [40–43]. The cross section for thebbH¯ process is calculated by the Santander matching with five-flavour scheme (NNLO in QCD) and four-flavour scheme (NLO in QCD) [44]. The composition of the different production modes in the SM is 87.3%
(ggF), 6.8% (VBF), 4.1% (V H), 0.9% (tt H¯ ), 0.9% (bbH¯ ).
The Higgs-boson decay branching ratio to the four-lepton final state (` = e, µ) for mH = 125 GeV is predicted to be 0.0124% [45] in the SM using PROPHECY4F [46,47], which includes the complete NLO QCD and EW corrections, and the interference effects between identical final-state fermions. Due to the latter, the expected branching ratios of the 4eand 4µfinal states are about 10% higher than the branching ratios to 2e2µand 2µ2efinal states.
The POWHEG-BOX v2 Monte Carlo (MC) event generator [48–50] is used to simulate ggF [51], VBF [52]
andV H [53] processes, using the PDF4LHC NLO PDF set [54]. The ggF Higgs-boson production is accurate to NNLO in QCD, using the POWHEG method for merging the NLO Higgs-boson plus jet cross section with the parton shower, and the MiNLO method [55] to simultaneously achieve NLO accuracy for inclusive Higgs-boson production. Furthermore, a reweighting procedure is performed using the HNNLO program [56,57] to achieve full NNLO accuracy. This sample is referred to as NNLOPS. The VBF and V Hsamples are produced at NLO accuracy in QCD. ForV H, the MiNLO method is used to merge 0- and 1-jet events [58]. For Higgs-boson production in association with a heavy quark pair, events are simulated at NLO with MadGraph5_aMC@NLO [59], using the CT10nlo PDF set [60] fortt H¯ and the NNPDF23 PDF set [61] for bbH¯ . For the ggF, VBF,V H, and bbH¯ production mechanisms, PYTHIA 8 [62] is used for theH →Z Z∗→4`decay as well as for parton showering, hadronisation, and multiple partonic interactions using the AZNLO parameter set [63]. For thet¯t Hproduction mechanism, Herwig++ [64] is used with the UEEE5 parameter set [65].
The measured event yields and the differential fiducial cross-section measurements are compared to a SM prediction constructed from the MC predictions presented above, after normalizing each sample to the corresponding LHCXSWG prediction. All samples are generated formH =125 GeV.
An alternative prediction for ggF SM Higgs-boson production is generated using MadGraph5_aMC@NLO at NLO accuracy in QCD for 0, 1, 2 additional jets, merged with the FxFx scheme [59,66], using the NNPDF30_nlo_as_0118 PDF set [67]. This MG5_aMC@NLO_FxFx sample is interfaced to PYTHIA 8 for Higgs-boson decay, parton showering, hadronisation and multiple partonic interactions using the
AZNLO parameter set. The data are also compared to ggF SM Higgs-boson production in the 4`decay channel simulated with HRes v2.3 [68,69], using the MSTW2008 NNLO PDF set [70]. The HRes pro- gram computes fixed-order cross sections for ggF SM Higgs-boson production up to NNLO in QCD and describes thepT,4`distribution at NLO. All-order resummation of soft-gluon effects at small transverse momenta is consistently included up to NNLL (next-to-next-to-leading logarithmic order) in QCD, using dynamic factorisation and resummation scales (the central scales are chosen to bemH/2). The program implements top- and bottom-quark mass dependence up to NLL + NLO in QCD. At NNLL + NNLO accuracy only the top-quark contribution is considered. HRes does not perform showering and QED final-state radiation effects are not included. Both the MG5_aMC@NLO_FxFx and the HRes prediction are normalized to the LHCXSWG cross section.
A ggF sample used to study deviations from the SM predictions within the pseudo-observable framework is generated with MadGraph5 at LO using FeynRules 2 [71] and the NN23PDF PDF set [13,72]. The sample is interfaced to PYTHIA 8 using the A14 parameter set [73]. It is normalized to the LHCXSWG cross section.
TheZ Z(∗)continuum background is simulated using Sherpa 2.2 [74–76] for quark-antiquark annihilation, using the NNPDF3.0 NNLO PDF set. NLO accuracy is achieved in the matrix element calculation for 0-, and 1-jet final states and LO accuracy for 2- and 3-jet final states. The merging is performed with the Sherpa parton shower [77] using the ME+PS@NLO prescription [78]. NLO EW corrections are applied as a function of the invariant mass of theZ Z∗systemmZ Z∗ [79,80]. The gluon-inducedZ Z∗production is modelled with gg2VV [81] at leading order in QCD. The k-factor accounting for missing higher order QCD effects in the calculation of thegg→Z Z∗continuum is taken to be 1.7±1.0 [82–86].
Sherpa 2.2 is also used to generate samples of the Z + jets background at NLO accuracy for 0-, 1- and 2-jet final states and LO accuracy for 3- and 4-jet final states. In this measurement, the Z +jets background is normalized using control samples from data. For comparisons with simulation, the QCD NNLO FEWZ [87,88] and MCFM cross-section calculations are used for inclusiveZboson and Z+bb¯ production, respectively. Samples for the t¯t background are produced with POWHEG interfaced to PYTHIA 6 [89] for parton shower and hadronisation, to PHOTOS [90] for QED radiative corrections, to Tauola [91,92] for the simulation ofτlepton decays and to EvtGen for the simulation ofB-hadron decays. For this sample, the Perugia 2012 parameter set [93] is used. TheW Zbackground is modelled using POWHEG+PYTHIA 8 and the AZNLO parameter set. The triboson backgrounds Z Z Z, W Z Z, andW W Zwith four or more leptons originating from the hard scatter, as well as thett¯+W process are produced with Sherpa 2.1. MadGraph, interfaced to PYTHIA 8 with the A14 parameter set is used to simulate the all-leptonict¯t+Z.
The particle-level events produced by each event generator are passed through the Geant4 [94] simulation of the ATLAS detector [95] and reconstructed in the same way as for the data. Additionalppinteractions in the same and nearby bunch crossings (pile-up) are simulated using inelasticppcollisions generated using PYTHIA 8 (with the A2 MSTW2008LO parameter set) and overlaid on the simulated events discussed above. The MC events are weighted to reproduce the distribution of the average number of interactions per bunch crossing observed in the data.
4 Event selection
Electrons are reconstructed using tracks in the ID and energy clusters in the EM calorimeter [96]. They are required to satisfy loose identification criteria based on tracking and calorimeter information. Muons are reconstructed as tracks in the ID and the MS [97] if they lie in the region 0.1 < |η| < 2.5. In the region |η| < 0.1, the MS has reduced coverage, and muons are reconstructed from ID tracks and identified by either a minimal calorimeter deposit or hits in the MS. For 2.5 < |η| < 2.7, only the MS can be used. For events with four muons, at least three muons are required to be reconstructed combining ID and MS tracks. Each muon (electron) must have transverse momentum pT > 5 GeV (transverse energyET > 7 GeV), within the pseudorapidity range|η| < 2.7 (2.47) and with a longitudinal impact parameter |z0sin(θ)| < 0.5 mm. Muons originating from cosmic rays are removed with the transverse impact parameter requirement|d0| < 1 mm. Jets are reconstructed from topological clusters of calorimeter cells using the anti-kt algorithm [98, 99] with the distance parameter R = 0.4. Jets are corrected for detector response and pile-up contamination [100,101] and required to havepT> 30 GeV, and|η| <4.5. In order to avoid double counting of electrons also reconstructed as jets, jets are removed if
∆R(jet,e) =p
∆φ(jet,e)2+∆η(jet,e)2< 0.2. This overlap removal is also applied to jets close to muons if the jet has less than three tracks and the energy and momentum differences between the muon and the jet are small, or if∆R(jet, µ) < 0.1.
Events with at least four leptons are selected with single-lepton, dilepton and trilepton triggers. The trigger selections changed with the increase of instantaneous luminosity during data-taking, e.g. the single electron trigger minimumET requirement changed from 24 to 26 GeV. The multilepton triggers have lowerET orpT requirements. The overall trigger efficiency in this analysis is about 98%. The data are subjected to quality requirements to reject events in which detector components were not operating correctly. Events are required to have at least one vertex with two associated tracks withpT> 400 MeV, and the primary vertex is chosen to be the reconstructed vertex with the largestP
p2
T of reconstructed tracks.
Higgs-boson candidates are formed by selecting two same-flavour opposite-sign (SFOS) lepton pairs, called a lepton quadruplet. The analysis selection proceeds in parallel for the four final states (4µ, 2e2µ, 2µ2e, 4e). For each final state, a quadruplet is chosen in which the three leading leptons pass pT (ET)
> 20, 15, 10 GeV. The leading pair is defined as the SFOS pair with the massm12 closest to the Z boson mass and the subleading pair is defined as the SFOS pair with the massm34second closest to the Z boson mass. In addition to the dilepton mass, lepton separation and J/ψ veto requirements (given in Table 1), loose calorimeter- and track-based isolation as well as impact parameter requirements are imposed on the leptons. For the track-based isolation, the sum of the pT of the tracks lying within a cone of∆R ≤ min[0.3,10 GeV/pT] (min[0.2,10 GeV/ET]) around the muon (electron) is required to be smaller than 15% of the leptonpT (ET). Similarly, the sum of the calorimeter ET deposits in a cone of
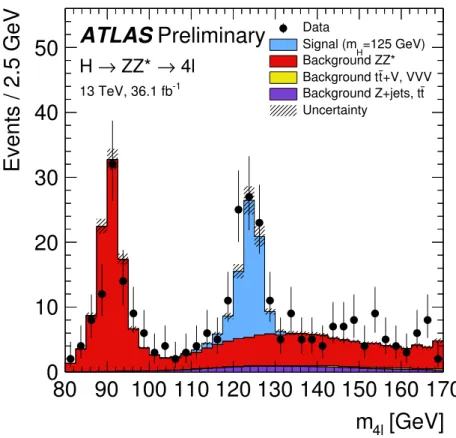
∆R≤ 0.2 around the muon (electron) is required to be smaller than 30% (20%) of the leptonpT(ET). As the four leptons should originate from a common vertex point, a requirement on the χ2value of a common vertex fit is applied, corresponding to a signal efficiency of 99.5% for all decay channels. If more than one quadruplet passes all requirements, e.g. forV H ortt H¯ , the channel with the highest expected signal rate is selected, in the order: 4µ, 2e2µ, 2µ2eand 4e. The invariant mass distribution of the four leptons of the selected events is shown in Figure1. Only events with a four-lepton invariant mass in the range 115−130 GeV are used in the final fit.
The selected events are divided into bins of the variables of interest. The bin boundaries are chosen such that each bin has an expected signal significance greater than 2σ and that there are minimal migrations
[GeV]
m4l
80 90 100 110 120 130 140 150 160 170
Events / 2.5 GeV
0 10 20 30 40 50
Data
=125 GeV) Signal (mH
Background ZZ*
+V, VVV t
Background t t Background Z+jets, t Uncertainty
ATLAS Preliminary
4l ZZ* → H →
13 TeV, 36.1 fb-1
Figure 1: Four-lepton invariant mass distribution of the selected events before them4`requirement. The error bars on the data points indicate the statistical uncertainty. The SM Higgs signal prediction is obtained from the samples discussed in Section3. The backgrounds are determined following the description in Section6. The systematic uncertainty on the prediction is shown by the dashed band, calculated as described in Section9.
between bins, which reduces the model-dependence of the extrapolation to the fiducial phase space.
5 Fiducial phase space
The fiducial cross sections are defined at particle-level using the selection requirements outlined in Table1, which are chosen to closely match those in the detector-level analysis in order to minimize model-dependent acceptance extrapolations.
The fiducial selection is applied to final-state3electrons and muons that do not originate from hadrons orτ-decays. The leptons are “dressed”, i.e. the transverse momenta of photons within a cone of∆R= 0.1 are added to each lepton, requiring the photons to not originate from hadron decays. Particle-level jets are reconstructed from final-state particles using the anti-kt algorithm with radius parameterR= 0.4.
Electrons, muons, and neutrinos, if they are not from hadron decays, and photons used to dress leptons are excluded from the jet clustering. Jets are removed if they are within a cone of∆R= 0.1 (0.2) of a selected muon (electron).
3Final-state particles are defined as particles with a life timecτ >10 mm.
Table 1: List of event selection requirements which define the fiducial phase space of the cross-section measurement.
SFOS lepton pairs are same-flavour opposite-sign lepton pairs.
Leptons and jets Muons: pT > 5 GeV,|η|< 2.7 Electrons: pT > 7 GeV,|η|< 2.47 Jets: pT >30 GeV,|y| < 4.4
Jet-lepton overlap removal: ∆R(jet, `) >0.1(0.2) for muons (electrons) Lepton selection and pairing
Lepton kinematics: pT > 20,15,10 GeV
Leading pair (m12): SFOS lepton pair with smallest|mZ−m``|
Subleading pair (m34): remaining SFOS lepton pair with smallest|mZ−m``| Event selection (at most one quadruplet per channel)
Mass requirements: 50< m12<106 GeV and 12< m34< 115 GeV
Lepton separation: ∆R(`i, `j) >0.1(0.2)for same- (different-) flavour leptons J/ψveto: m(`i, `j) >5 GeV for all SFOS lepton pairs
Mass window: 115 GeV< m4` <130 GeV
Quadruplets are formed with the selected dressed leptons in the same manner as for the reconstructed events. This allows for mispairing of the Higgs-boson leptons when assigning them to the leading and subleadingZ boson and the inclusion of leptons coming from vector bosons produced in association with the Higgs boson. The differential variables are calculated using the dressed leptons in the quadruplets.
The acceptance of the fiducial selection (with respect to the full phase space of H → Z Z∗ → 2`2`0, where`, `0 = eor µ) is 42% for a SM Higgs boson with mH = 125 GeV. The ratio of the number of events passing the detector-level event selection to those passing the particle-level selection, is 53%. Due to resolution effects, about 2% of the events which pass the detector-level selection fail the particle-level selection.
6 Background estimates
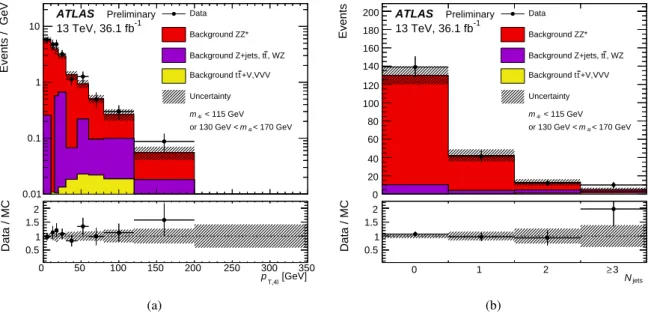
Non-resonant SM Z Z∗ production viaqq¯annihilation and gluon-gluon fusion can result in four prompt leptons in the final state and constitutes the largest background for this analysis. It is estimated using the Sherpa and gg2VV simulated samples presented in Section3. To cross-check the theoretical modelling of this background, a Z Z∗-enriched control region is formed using almost the full event selection, but requiring that the four-lepton invariant mass is outside of the region 115 < m4` < 130 GeV. In this control region, good agreement is observed between the simulation and the data for all distributions, as demonstrated forpT,4`andNjetsin Figure2.
Other processes that contribute to the background, such asZ+jets,t¯t, andW Z, contain at least one object that is misidentified as a prompt lepton. These backgrounds are significantly smaller than the non-resonant Z Z∗background and are estimated using data where possible, following slightly different approaches for the``µµand``eefinal states [102].
In the``µµfinal states, the normalisations for the Z +jets andtt¯backgrounds are determined using fits to the invariant mass of the leading lepton pair in dedicated data control regions. The control regions are
[GeV]
pT,4l
Events / GeV
0.01 0.1 1 10
Data Background ZZ*
, WZ t Background Z+jets, t +V,VVV t Background t Uncertainty
ATLAS Preliminary 13 TeV, 36.1 fb-1
< 115 GeV m4l
< 170 GeV m4l
or 130 GeV <
[GeV]
pT,4l
0 50 100 150 200 250 300 350
Data / MC 0.5 1 1.5 2
(a)
Njets
Events
0 20 40 60 80 100 120 140 160 180
200 Data
Background ZZ*
, WZ t Background Z+jets, t +V,VVV t Background t Uncertainty
ATLAS Preliminary 13 TeV, 36.1 fb-1
< 115 GeV m4l
< 170 GeV m4l
or 130 GeV <
Njets
0 1 2 ≥3
Data / MC 0.5 1 1.5 2
(b)
Figure 2: Reconstructed event yields in bins ofpT,4`(a) andNjets(b), in a non-resonantZ Z∗-enriched control region, obtained by applying the full event selection except for them4`window, which here is required to bem4`<115 GeV or 130 GeV<m4` <170 GeV. The error bars on the data points indicate the statistical uncertainty. The systematic uncertainty on the prediction is shown by the dashed band. The bottom part of the figures shows the ratio of data over expectation.
formed by relaxing the χ2 requirement on the vertex fit, and by inverting and relaxing isolation and/or impact-parameter requirements on the subleading muon pair. An additional control region (eµµµ) is used to improve thet¯t background estimate. Transfer factors to extrapolate from the control regions to the signal region are obtained separately fort¯tandZ+jets using simulation. The shapes of theZ+jets andt¯t backgrounds for the differential observables are taken from simulation and normalized using the inclusive data-driven estimate. Comparisons in the control regions show good agreement between data and the simulation for the different observables.
The``ee control-region selection requires the electrons in the subleading lepton pair to have the same charge, and relaxes the identification and isolation requirements on the electron candidate with the lowest transverse energy. This electron candidate can be a light-flavour jet, a photon conversion or an electron from heavy-flavour hadron decay. The heavy-flavour background is completely determined from simulation, whereas the light-flavour and photon conversion background is obtained with the sPlot [103] method, based on a fit to the number of hits in the innermost ID layernIBLin the data control region. Efficiencies for the light-flavour jets and converted photons, obtained from simulated samples, are corrected using Z +X control regions and then used to extrapolate the extracted yields to the signal region. Both the yield extraction and the extrapolation are performed in bins of the transverse momentum of the electron candidate and the jet multiplicity. In order to extract the shape of the backgrounds from light-flavour jets and photon conversions in bins of the differential distributions, a similar method is used, except that the extraction and extrapolation is now performed as a function of the transverse momentum of the electron candidate in each bin of the variable of interest.
Them4`shapes are extracted from simulation for most background components except for the light-flavour jet contribution in the``eefinal state, which is not well described by the simulation and therefore taken
from the control region and extrapolated using the data-corrected efficiencies. It was observed that them4` shape of theZ+jets andt¯tbackgrounds does not change significantly across the differential distributions, and so the inclusive shape is used for all bins.
TheW Zproduction is included in the data-driven estimates for the``eefinal states, while it is added from simulation for the``µµfinal states. The contributions fromt¯t+Z and triboson processes are very small and taken from simulated samples.
7 Measured data yields
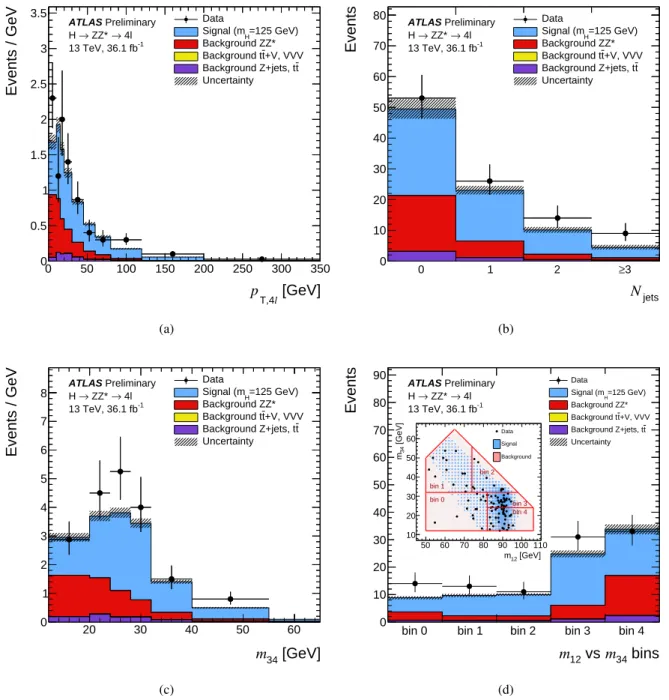
The number of events in the four decay channels observed in data after the event selection, as well as the expected signal and background yields, are presented in Table2. Figure3 shows the expected and observed event yields after the analysis selection for four of the measured differential spectra. The total observed and predicted event counts agree within 1.3 standard deviations.
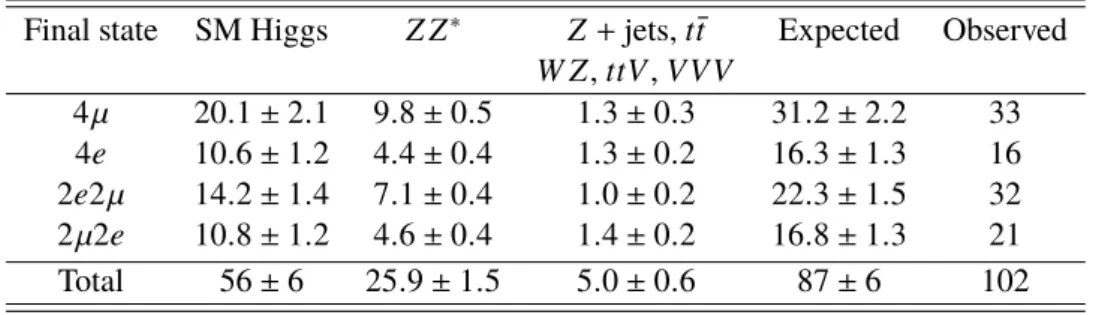
Table 2: Number of expected and observed events in the four decay channels after the event selection, in the mass range 115 GeV<m4` <130 GeV. The sum of the expected number of SM Higgs-boson events and the estimated background yields is compared to the data. Combined statistical and systematic uncertainties are included for the predictions (see Section9).
Final state SM Higgs Z Z∗ Z+jets,t¯t Expected Observed W Z,ttV,V V V
4µ 20.1±2.1 9.8±0.5 1.3±0.3 31.2±2.2 33 4e 10.6±1.2 4.4±0.4 1.3±0.2 16.3±1.3 16 2e2µ 14.2±1.4 7.1±0.4 1.0±0.2 22.3±1.5 32 2µ2e 10.8±1.2 4.6±0.4 1.4±0.2 16.8±1.3 21 Total 56±6 25.9±1.5 5.0±0.6 87±6 102
8 Signal extraction and correction for detector effects
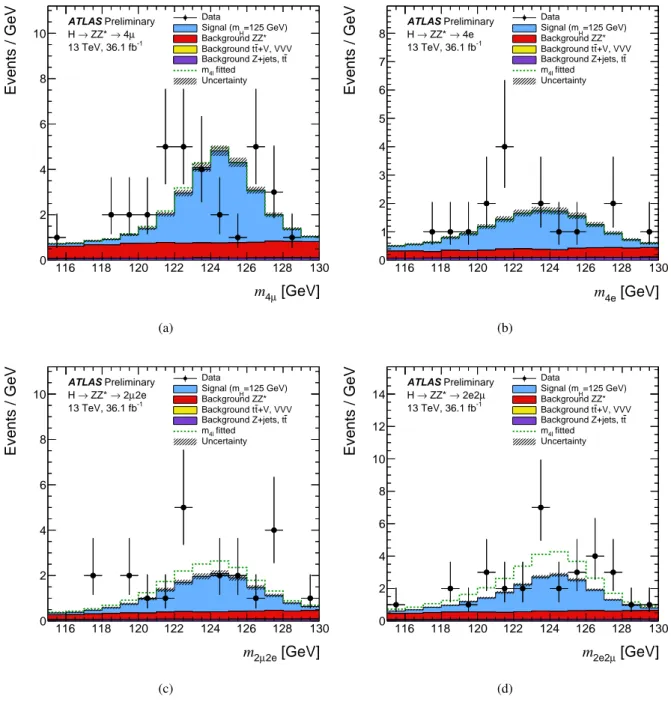
To extract the number of signal events, in each bin of a differential distribution (or for each decay channel for the inclusive fiducial cross section), templates for the Higgs-boson production and the background processes are fit to them4`distribution in data. The signal shape is obtained from the simulated samples described in Section3at a Higgs-boson mass of 125 GeV. Most of the background shapes are also obtained from the simulated samples described in Section3, while some of the backgrounds in the``eechannel are derived from control regions in data, as discussed in Section6. The normalisation of the backgrounds is fixed in this fit. Figures4and5show the data, templates and best fits for them4`distributions in the four decay channels for the extraction of the inclusive fiducial cross section, and in representative bins of the transverse momentum of the four leptons. For the differential distributions, no split into decay channels is performed, and the SMZ Z∗→4`decay fractions are assumed.
The fiducial cross sectionσi,fidfor a given final state or bin of the differential distribution is defined as:
[GeV]
l
pT,4
0 50 100 150 200 250 300 350
Events / GeV
0 0.5 1 1.5
2 2.5 3 3.5
13 TeV, 36.1 fb-1
ATLAS
→ 4l ZZ*
→ H
Preliminary Data
=125 GeV) Signal (mH
Background ZZ*
+V, VVV t Background t
t Background Z+jets, t Uncertainty
(a)
Njets
0 1 2 ≥3
Events
0 10 20 30 40 50 60 70 80
13 TeV, 36.1 fb-1
ATLAS
→ 4l ZZ*
→ H
Preliminary Data
=125 GeV) Signal (mH
Background ZZ*
+V, VVV t Background t
t Background Z+jets, t Uncertainty
(b)
[GeV]
m34
20 30 40 50 60
Events / GeV
0 1 2 3 4 5 6 7 8
13 TeV, 36.1 fb-1
ATLAS
→ 4l ZZ*
→ H
Preliminary Data
=125 GeV) Signal (mH
Background ZZ*
+V, VVV t Background t
t Background Z+jets, t Uncertainty
(c)
bins m34 12 vs m
bin 0 bin 1 bin 2 bin 3 bin 4
Events
0 10 20 30 40 50 60 70 80 90
13 TeV, 36.1 fb-1
ATLAS
→ 4l ZZ*
→ H
Preliminary Data
=125 GeV) Signal (mH Background ZZ*
+V, VVV t Background t
t Background Z+jets, t Uncertainty
[GeV]
m12
50 60 70 80 90 100 110 [GeV]34m
10 20 30 40 50 60
bin 0 bin 1
bin 2
bin 3 bin 4 Data Signal Background
(d)
Figure 3: Measured data yields compared to SM Higgs-boson signal and background processes for the transverse momentum of the four leptonspT,4`(a), the number of jetsNjets(b), the invariant mass of the subleading lepton pair m34(c), and the invariant mass of the leading vs the subleading pairm12vsm34(d). Subfigure (d) also includes an illustration of the chosen bins, as well as the two-dimensional distributions of data and prediction. The error bars on the data points indicate the statistical uncertainty. The systematic uncertainty on the prediction is shown by the dashed band.
[GeV]
µ
m4
116 118 120 122 124 126 128 130
Events / GeV
0 2 4 6 8 10
13 TeV, 36.1 fb-1
ATLAS µ
→ 4 ZZ*
→ H
Preliminary Data
=125 GeV) Signal (mH
Background ZZ*
+V, VVV t Background t
t Background Z+jets, t
fitted m4l
Uncertainty
(a)
[GeV]
m4e
116 118 120 122 124 126 128 130
Events / GeV
0 1 2 3 4 5 6 7 8
13 TeV, 36.1 fb-1
ATLAS
→ 4e ZZ*
→ H
Preliminary Data
=125 GeV) Signal (mH
Background ZZ*
+V, VVV t Background t
t Background Z+jets, t
fitted m4l
Uncertainty
(b)
[GeV]
µ2e
m2
116 118 120 122 124 126 128 130
Events / GeV
0 2 4 6 8 10
13 TeV, 36.1 fb-1
ATLAS µ2e
→ 2 ZZ*
→ H
Preliminary Data
=125 GeV) Signal (mH
Background ZZ*
+V, VVV t Background t
t Background Z+jets, t
fitted m4l
Uncertainty
(c)
[GeV]
µ
m2e2
116 118 120 122 124 126 128 130
Events / GeV
0 2 4 6 8 10 12 14
13 TeV, 36.1 fb-1
ATLAS µ
→ 2e2 ZZ*
→ H
Preliminary Data
=125 GeV) Signal (mH
Background ZZ*
+V, VVV t Background t
t Background Z+jets, t
fitted m4l
Uncertainty
(d)
Figure 4: Template fit of Higgs-boson signal and background to the data for the inclusive distributions for the different decay channels. The error bars on the data points indicate the statistical uncertainty. The SM Higgs-boson predictions are normalized to the cross sections discussed in Section3, while the backgrounds are normalized to the estimates described in Section6. The systematic uncertainty on the prediction is shown by the dashed band.
[GeV]
m4l
116 118 120 122 124 126 128 130
Events / GeV
0 1 2 3 4 5 6 7 8
< 10 GeV pT,4l
0 <
13 TeV, 36.1 fb-1
ATLAS
→ 4l ZZ*
→ H
Preliminary Data
=125 GeV) Signal (mH
Background ZZ*
+V, VVV t Background t
t Background Z+jets, t
fitted m4l
Uncertainty
(a)
[GeV]
m4l
116 118 120 122 124 126 128 130
Events / GeV
0 0.2 0.4 0.6 0.8 1 1.2 1.4 1.6 1.8 2
< 350 GeV pT,4l
200 <
13 TeV, 36.1 fb-1
ATLAS
→ 4l ZZ*
→ H
Preliminary Data
=125 GeV) Signal (mH
Background ZZ*
+V, VVV t Background t
t Background Z+jets, t
fitted m4l
Uncertainty
(b)
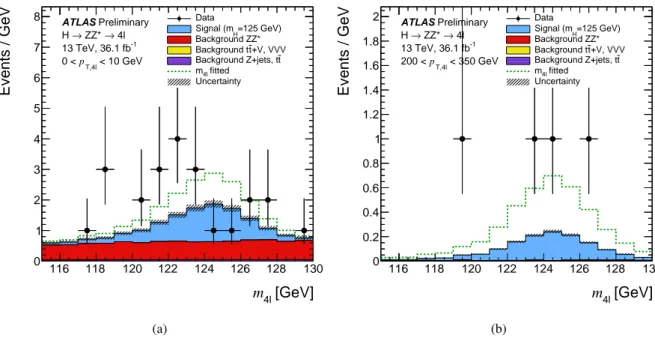
Figure 5: Template fit of Higgs-boson signal and background to the data for the first and last bins of the distribution of the transverse momentum of the four leptons pT,4`. The error bars on the data points indicate the statistical uncertainty. The SM Higgs-boson predictions are normalized to the cross sections discussed in Section3, while the backgrounds are normalized to the estimates described in Section6. The systematic uncertainty on the prediction is shown by the dashed band. The dotted green line illustrates the best fit.
σi,fid=σi× Ai×BR= Ni,fit
L ×Ci, Ci = Ni,reco
Ni,part, (1)
where Ai is the acceptance in the fiducial phase space, BR the branching fraction and σi is the total cross section in bini. Ni,fitis the number of extracted signal events in data,L the integrated luminosity andCi the bin-by-bin correction factor for detector inefficiency and resolution. Ni,recois the number of reconstructed signal events and Ni,partis the number of events at the particle-level in the fiducial phase- space. The correction factor is calculated from simulated Higgs-boson samples, assuming SM production mode fractions and Z Z∗ → 4`decay fractions as discussed in Section 3. The systematic uncertainties on this assumption are described in Section9. The correction factors for the different Higgs production modes agree within 15%, except for thett H¯ mode, which differs by up to 40%, due to the fact thatt¯t H events have more hadronic jets and no isolation requirements are applied to the leptons at the particle-level.
The correction factors for the four final states are 0.64±0.04 (4µ), 0.55±0.03 (2e2µ), 0.48±0.05 (2µ2e), 0.43±0.06 (4e). Figure6shows the bin-by-bin correction factors including systematic uncertainties for thepT,4` andNjetsdistributions. The same figure also shows the purity, defined as the fraction of events in a bin of the reconstructed distribution that are found in the same bin at particle level. The purity is greater than 0.75 for the Higgs kinematic and decay observables, and typically greater than 0.6 for the jet variables. It can be seen that the narrower bins at lowpT,4`have a slightly reduced purity, as detector resolution effects result in larger bin migrations.
The signal, background, and datam4`distributions, as well as the correction factors, are used as input to