ATLAS-CONF-2017-051 10July2017
ATLAS CONF Note
ATLAS-CONF-2017-051
5th July 2017
Search for W W/W Z resonance production in `νq q final states in pp collisions at √
s = 13 TeV with the ATLAS detector
The ATLAS Collaboration
A search is presented for new resonances decaying to aW W orW Z boson pair, where one W boson decays leptonically and the otherW or Z boson decays hadronically. It is based on proton-proton collision data, utilizing 36.1 fb−1, collected with the ATLAS detector at the Large Hadron Collider at a center-of-mass energy of
√s = 13 TeV in 2015 and 2016.
The search is sensitive to diboson resonance production via quark-antiquark, gluon-gluon and vector-boson fusion mechanisms. No significant excess is observed in data with respect to Standard Model backgrounds. Several benchmark models are used to interpret the results.
Limits on the production cross section are set for a new narrow scalar resonance, a new heavy vector-boson coupling to the Standard Model gauge bosons and a spin-2 Randall-Sundrum bulk graviton.
© 2017 CERN for the benefit of the ATLAS Collaboration.
Reproduction of this article or parts of it is allowed as specified in the CC-BY-4.0 license.
1 Introduction
Diboson resonances are predicted in several extensions to the Standard Model (SM), such as composite Higgs models [1, 2], warped extra dimensions [3–5], models with an extended Higgs sector [6, 7] and Grand Unified Theories [8–11]. Searches for diboson resonances in different decay channels have been carried out at the Large Hadron Collider (LHC), but no evidence of such resonances has been observed [12–
18].
This study reports on a search for a charged or neutral resonant state, in a mass range from 300 GeV to 5000 GeV, that decays to a W Z orW W boson pair. The semileptonic final state where oneW boson decays leptonically (W →`νwith`=e, µ) and the otherW/Z boson (denoted asV) decays hadronically (V →qq¯0/qq¯ withq,q0= u,d,c,sorb) is considered. The search uses ppcollision data at a center-of- mass energy of 13 TeV that were collected by the ATLAS experiment in 2015 and 2016, corresponding to an integrated luminosity of 36.1 fb−1. The identification of the candidate resonance depends on the feasibility to resolve the two quarks from the hadronically decayingVboson as separate objects. For high mass resonances, theV bosons have small opening angles between the quarks and can be identified as single objects. This case is referred to as the merged analysis and is denoted as`νJhereafter in this study, whereas separate identification of the two quarks is referred to as the resolved analysis and is denoted as
`νj j.
In addition to the increase of sample size, the search makes use of an improved methodology with respect to the most recent ATLAS result [12]. The resolved analysis is included in the current search and event selections are optimized for two different production modes: the vector-boson fusion (VBF) and the gluon- gluon fusion (ggF) or quark–antiquark (qq¯) fusion. In addition, a new mass reconstruction is implemented for hadronically decaying objects that are highly Lorentz boosted. It is based on both calorimeter energy deposits and charged tracks, instead of cluster information alone as used in the previous publication [12].
The VBF process is characterized by the presence of two jets with a large opening angle resulting from a quark from each proton beam, from which a vector boson is radiated. Absence of this topology is interpreted as ggF or qq¯ production, collectively referred to as Drell-Yan (DY) in this study. Results are provided for the VBF and DY categories separately and possible signal leak between categories is ignored.
The spectrum of the reconstructed invariant mass of theW V resonance candidates (m(W V)) is examined for localised excesses over the SM expectation. Three signal models are used to optimize the event selection, assess the sensitivity of the search and interpret the data: an additional heavy Higgs boson predicted by multiple beyond-the-SM theories, a Heavy Vector Triplet (HVT) parametrisation based on a simplified phenomenological Lagrangian [19,20] and a bulk Randall–Sundrum (RS) graviton [21].
2 ATLAS detector
The ATLAS detector [22] is a general-purpose particle detector used to investigate a broad range of physics processes. It includes an inner detector (ID) surrounded by a superconducting solenoid, electromagnetic (EM) and hadronic calorimeters and a muon spectrometer (MS) inside a system of toroid magnets. The ID consists of a silicon pixel detector including the newly installed Insertable B-Layer [23], a silicon microstrip detector and a straw tube tracker. It is immersed inside a 2 T axial magnetic field from the
solenoid and provides precision tracking of charged particles with pseudorapidity1|η| < 2.5. The straw tube tracker also provides transition radiation measurements for electron identification. The calorimeter system comprises finely segmented sampling calorimeters using lead/liquid-argon for the detection of EM showers up to|η| <3.2, and copper or tungsten/liquid-argon for hadronic showers for 1.5< |η| <4.9. In the central region (|η|<1.7), a steel/scintillator hadronic calorimeter is used. Outside the calorimeters, the muon system incorporates multiple layers of trigger and tracking chambers in a magnetic field produced by a system of superconducting toroids, enabling an independent precise measurement of muon track momenta for |η| < 2.7. The ATLAS detector has a two-level trigger system that is based on custom hardware followed by a software trigger to reduce the selected event rate to approximately 1 kHz for offline analysis [24].
3 Signal and Background Simulation
Samples of simulated signal and background events are used to optimize the event selection and to estimate the background contribution from various SM processes. For all the signal samples, the`νqqfinal state is imposed at the generator level.
The heavy neutral Higgs boson signal is generated using Powheg-Box v1 [25,26] with the next-to-leading order (NLO) gg_H [27] and VBF_H [28] modules and the CT10 [29] parton density functions (PDF).
The Powheg-Box generator is interfaced to Pythia 8.186 [30] for parton showering, underlying event and hadronization using the AZNLO tune [31] and the CTEQ6L PDF [32]. Possible interference effects with the SM diboson production is neglected. ScalarW Wresonances with masses ranging from 300 GeV to 3000 GeV are generated with a narrow width of 4 MeV; they are produced via either the ggF or VBF process [33,34].
For interpretation in terms of a vector resonance produced via qq¯ fusion, simulated Z0 → W W and W0 → W Z samples of two benchmark models based on the HVT parametrized Lagrangian [19, 20]
have been generated. Model A, with a strength of the vector boson interaction gV = 1, is typical of an extended gauge model [35] with the heavy vectors having comparable branching ratios to fermions and gauge bosons. Model B, with gV = 3, is representative of composite Higgs models, where the fermionic couplings are suppressed [36–38]. In both scenarios, the resonance width is narrower than the detector resolution. For the VBF Model samples, the coupling to fermions is set to zero, while the couplings to gauge bosons are similar to those in Model A. The signal samples are produced using MadGraph5_aMC@NLO v2.2.2 [39] interfaced to Pythia 8.186 with the NNPDF23_lo [40] PDF and the A14 tune [41] for the underlying event in a mass range that spans from 300 GeV to 5000 GeV.
The RS graviton (GK K →W W) [21] signal produced via ggF with masses from 300 GeV to 5000 GeV is generated using the same generators as for HVT [42]. The GK K is the first Kaluza–Klein mode [43]
of a spin-2 graviton in a warped extra dimension with curvaturek and dimensionless coupling constant k/M¯Pl ∼ O(1), where ¯MPlis the reduced Planck mass. For the interpretation of the results, a bulk RS GK K withk/M¯Pl=1.0 is considered.
1ATLAS uses a right-handed coordinate system with its origin at the nominal interaction point (IP) in the center of the detector and thez-axis along the beam pipe. The x-axis points from the IP to the center of the LHC ring, and the y-axis points upwards. Cylindrical coordinates(r, φ)are used in the transverse plane,φbeing the azimuthal angle around the beam pipe.
The pseudorapidity is defined in terms of the polar angleθasη =−ln tan(θ/2). Angular distance is measured in units of
∆R≡ q
(∆η)2+(∆φ)2.
The dominant SM background arises from events with a W boson produced in association with jets (W+jets). Additional sources of SM background include the production of top quarks, multijet, dibosons and Z+jets. Events containing W or Z bosons with associated jets are simulated using the Sherpa 2.2.1 [44] generator using the NNPDF30_nnlo [40] PDF set. Samples ofV+jets have been produced with a simplified scale setting prescription in the multi-parton matrix elements, to improve the event generation speed. To estimate systematic uncertainties related to the V+jets processes, alternative samples are generated using MadGraph5_aMC@NLO v2.2.2 interfaced to the Pythia 8.186 parton shower model, using the A14 tune together with the NNPDF23_lo PDF set. For the generation oft¯tand single top quarks the Powheg-Box v2 [45] generator with the CT10 PDF sets in the matrix element calculations is used.
Systematic uncertainties associated with showering and hadronisation are evaluated using alternative Powheg-Box samples interfaced with Herwig++ 2.7.1 [46] and using the UEEE5 underlying event tune [47]. Diboson samples (W W, W Z and Z Z) are generated using Sherpa 2.1 [44] with the CT10 PDF. Additional Diboson events using the Powheg-Box generator, interfaced to the Pythia 8.186 parton shower model, are generated for systematic uncertainty estimate, where the CT10NLO set [29] is used for PDF of the hard-processing and the CTEQL1 PDF set [32] is used for the parton shower. All the background cross sections are computed to the next-to-next-leading order (NNLO) [48–52], except for the Diboson samples for which the generator cross sections at NLO are used. EvtGen 1.2.0 [53] is used for simulating the bottom and charm hadron decays, except for the case of Sherpa. The multijet background estimation relies purely on data-driven techniques.
The effect of multipleppinteractions in the same and neighboring bunch crossings (pile-up) is included by overlaying minimum-bias events simulated with Pythia 8.186 on each generated signal and background event. The number of overlaid events is reweighted in such a way that the distribution of the average number of interactions perppbunch crossing in the simulation matches that observed in the data. The generated samples are processed through a GEANT4-based detector simulation [54,55] and the standard ATLAS reconstruction software.
4 Object Reconstruction and Identification
Events are required to have at least one primary vertex with at least two associated tracks, each with transverse momentumpT> 400 MeV. If there is more than one primary vertex reconstructed in the event, the one with the largest trackP
p2
Tis chosen as the hard-scatter primary vertex and is subsequently used for calculation of the main physics objects in the analysis: electrons, muons, jets and missing transverse momentum. Only events with exactly one “signal” lepton and no additional so-called “veto” leptons, as defined later in this section, are selected.
Electrons are reconstructed from clusters of energy deposits in the EM calorimeter that match a track reconstructed in the ID. They are identified using a likelihood identification criterion described in Ref. [56].
“Signal” electrons are required to pass “Tight” identification criteria and have transverse momentumpT>
27 GeV, while “veto” electrons are required to pass the “Loose” selection andpT> 7 GeV. All electrons have to satisfy |η| < 2.47, excluding the transition region between the barrel and endcaps (1.37 < |η| <
1.52). Electron candidates are further required to be isolated from other tracks and calorimetric activity.
This is achieved by examining the scalar sum of transverse momenta of tracks and the sum of transverse energy deposits within a cone of size∆R=0.2 around the electron track, excluding the transverse energy of the electron itself and correcting for the expected pile-up contributions. The isolation requirement
for electrons is chosen to ensure approximately 95 % and 99 % selection efficiency, for signal and veto electrons, respectively.
Muons are reconstructed by combining ID and MS tracks that have consistent trajectories [57]. Based on the quality of their reconstruction and identification, signal muons are required to pass the “Medium”
selection withpT> 27 GeV and|η|< 2.5, while veto muons are required to pass the “Loose” selection,pT
> 7 GeV and|η|< 2.7. In addition, a similar isolation requirement to that used for electron candidates is applied to signal and veto muon candidates with an efficiency working point of 99%, but only considering tracks within a cone of∆R=0.3.
To reject non-prompt leptons, requirements of|d0|/σd0 < 5(3)and|z0sinθ| < 0.5 mm are imposed on the tracks associated with the electrons (muons), whered0is the transverse impact parameter with respect to the measured beam line position,σd0 is the corresponding uncertainty, z0 is the longitudinal impact parameter with respect to the primary vertex andθ is the polar angle of the track2.
Jets are reconstructed using the anti-kt algorithm [58] from three-dimensional topological clusters of energy deposits in the calorimeter [59], with two different radius parameters: R = 1.0 for large-R jets (denoted asJ) andR=0.4 for small-Rjets.
Small-Rjets [60] are required to have pT > 20 GeV and|η| < 2.4, while jets considered for the tagging of VBF events are required to havepT> 30 GeV and|η|< 4.5. For jets withpT< 60 GeV and|η| < 2.4 a jet-vertex-tagger multivariate discriminant selection [61], based on tracking and vertexing information, is applied to select jets that originate from the primary vertex. The selected working point provides 92%
efficiency.
An overlap removal procedure is applied to prevent using the same energy deposits to reconstruct multiple objects. Small-R jets are discarded if they are within a cone of size ∆R < 0.2 around the direction of an electron candidate. However, if the distance between a jet and an electron candidate is within 0.2 < ∆R < min(0.4,0.04+10/pT(e)), the jet is retained but the nearby electron is rejected from the analysis. A muon candidate within∆R < min(0.4,0.04+10/pT(µ)) from a small-R jet is discarded unless it is within∆R <0.2 and satisfies one of the two following requirements: (a) The small-Rjet has fewer than three tracks; (b) pT(µ)/pT(j) > 0.5 and pT(µ)/P
pT > 0.7, where P
pT is the sum of the transverse momenta of tracks associated with the small-Rjet. In this case, the muon is retained but the nearby small-Rjet is rejected.
Small-Rjets containingb-hadrons are identified using the MV2c10b-tagging algorithm [62,63] with an efficiency of 85%, determined fromtt¯simulated events. In this study, small-Rjets identified asb-quark- induced are referred to asb-jets. The corresponding misidentification rate for selecting jets originating from a light quark or gluon is∼3%. Thec-jet rejection factor is approximately 3.1. For simulated samples the tagging efficiencies are corrected to match those measured in data [62].
Large-R jets [64, 65] are formed from constituent energy deposits and are trimmed to mitigate pile-up effects and soft radiation. The jet constituents are re-clustered into sub-jets using thek⊥algorithm with R=0.2 [66], removing those which carry less than 5% of thepTof the original jet [67]. To improve over the limited angular resolution of the calorimeter, the mass of a large-Rjet is computed using a combination of calorimeter and tracking information [68]. The mass is defined as:
2The transverse impact parameter, longitudinal impact parameter and polar angle are calculated at the point of closest approach of the track with respect to the beam line.
m(J) ≡wcalo×mcalo(J)+wtrack×
mtrack(J)pcalo
T
ptrack
T
,
wheremtrack(J)(mcalo(J)) andptrack
T (pcalo
T ) are the invariant mass and total transverse momentum obtained when using the charged tracks (calorimeter energy clusters) associated with the large-Rjet, respectively. In this study, the track and large-Rjet association is performed using ghost association for charged tracks with pT > 0.4 GeV [69]. To correct for the missing neutral component in the calculation of the track-based jet mass,mtrack(J)is scaled by the ratio of calorimeter to trackpTestimates. The weighting factorswcaloand wtrackarepT-dependent functions of the calorimeter and track-based jet mass resolutions which optimize the combined jet mass resolution. In addition, the measured large-Rjet momentum is recalculated as pT =pcalo
T ×(m(J)/mcalo(J)). In this analysis, large-Rjets are required to havepT >200 GeV,|η| <2.0, m(J) > 50 GeV and an angular separation of∆R>1.0 from signal electrons.
A jet substructure variable (D2), defined in Ref. [70], is used to classify large-R jets. The variable D2 is defined as a ratio of two- and three-point energy correlation functions [70, 71], which are based on the energies and pair-wise angular distances of particles within a jet. This variable is optimised to distinguish between jets originating from a single parton and those coming from the two-body decay of a heavy particle. A detailed description of the optimisation can be found in Ref. [64,65], while a baseline selection providing 80 % efficiency forV signal is applied to all large-Rjets considered in this study. To further distinguish hadronically-decayingV bosons from jets originating from non-top quarks or gluons, boson tagging algorithms (V-tagging) are constructed based on the combined large-Rjet mass and theD2 variable, separately for theW andZ bosons. In this analysis, two differentV-tagging working points are used resulting in 50% and 80%V signal selection efficiency. The exact cut values on theD2variable and the mass window depend on the jetpT.
The missing transverse momentum (Emiss
T ) is the absolute value of the negative vectorial sum of the transverse momenta of calibrated objects, namely electrons, muons, and small-R jets. Reconstructed charged particle tracks originating from the primary vertex and not matched to any of those objects are also included in theEmiss
T reconstruction [72].
The neutrino four-vector is reconstructed by imposing aWboson mass constraint on the charged-lepton–
neutrino system. The neutrino transverse momentum components are set equal to the missing transverse momentum of the event and the unknown z-component of the momentum (pz) is obtained from the resulting quadratic equation. The pz is chosen as either the smaller in absolute value of the two real solutions or, if the solution is complex, its real part.
5 Trigger and Event Selection
The analysis selects events that contain exactly one charged signal lepton and no additional veto electrons or muons. Events recorded by single lepton andEmiss
T triggers are analysed if the signal lepton matches the trigger lepton in the former case. Trigger with lepton isolation selection is only imposed on leptons withpT< 60 GeV to maximize the efficiencies. Single electron triggers that have a minimum transverse energy (ET) threshold of 24 GeV and 26 GeV in 2015 and 2016 data, respectively, are applied to record events in the electron final state. They have at least 90% efficiency with respect to a selected offline electron, depending on the lepton pT. As for the muon final state, the events are recorded either by the single muon trigger or by theEmiss
T triggers. The single muon trigger, with pT > 20 (26) GeV in 2015
(2016), is subject to an inefficiency of 30% due to limited trigger hardware coverage. TheEmiss
T trigger has an online threshold of 70 GeV for the 2015 data and of 90-110 GeV for the 2016 data taking periods, where the muon term is not used to computeEmiss
T in the trigger algorithm. Therefore, it is fully efficient forW → `ν with pT (W) > 200 GeV and it is used in the merged analysis, where a high-pT lepton is expected, to recover the single muon trigger inefficiency.
The sensitivity to resonances of different masses is optimized by classifying the events according to the topology, production mechanism and amount of background. The complete event selection criteria are summarized in Tables1 and2for the merged and resolved analyses respectively. Fig.1 illustrates graphically the signal and control regions.
HP CR HP
CR LP
CR LP CR
D2
mJ [GeV]
50
LP SR (WW) LP SR (WZ) HP SR (WW) HP SR (WZ)
(β=1)
mW mZ
ε=50%
ε=80%
(a)
Resolved CR Resolved
CR
mjj [GeV]
66 82 94 106 200
Resolved SR (WW) Resolved
SR (WZ)
(b)
Figure 1:(a)Illustration of the mergedW W (shaded area) andW Z (dashed lines) signal regions (SR) for large-R jets. The 50% and 80%V-tagging efficiency working points are used to form the high purity (HP) and low purity (LP) regions respectively. For each working point, the mass window and the upper cut on the substructure variable depend on the large-RjetpT. Therefore an absolute definition is not given in the figure. The resolved SR definitions are presented in Fig.(b). In both channels, the SR mass sidebands are used to define theW+jets control region (CR).
The unique kinematic signature of the VBF process is used to categorize the events according to the production mechanism and maximize the sensitivity. Events with two small-R(“tag”) jets with invariant massmtag(j,j) >770 GeV and pseudorapidity gap between them|∆ηtag(j,j)| >4.7 are classified as VBF candidates. In case there are more than two tag-jets, the pair with the largest invariant mass is chosen.
Selected events that fail the VBF selection are assigned to the DY category.
Events belonging in the VBF or DY categories are further assigned to merged and resolved regions as follows:
• Merged signal region: the large-R jet with the highest pT is selected as the candidate of the hadronically-decayingVboson, requiring no overlap with either of the tag-jets in the VBF category (∆R(jt ag,J) > 1.0). Furthermore, the event is required to have Emiss
T > 100 GeV to eliminate the multijet contamination. The leptonically decayingW candidate is required to have a lepton- neutrino system with transverse momentum pT(`ν) > 200 GeV. A threshold of 0.2 is set on the ratio Emiss
T /pT(eν) in the electron channel in order to further suppress the multijet background.
According to the signal topology, the two bosons are produced from a heavy resonance decay and
Table 1: Summary of the selection criteria used to define the mergedW W andW Z signal regions (SR) and their correspondingW+jets control regions (W CR) andtt¯control regions (tt¯CR) in the high-purity (HP) and low-purity (LP) categories. The events are also categorized according to their production mechanism, the VBF selection is prioritized and the remaining events are assigned to the DY category.
Selection SR: HP (LP) W CR: HP (LP) tt¯CR: HP (LP)
Production Category VBF mtag(j,j) >770 GeV and|∆ηtag(j,j)| >4.7
DY Fails VBF selection
W →`νselection
Num. of signal leptons 1
Num. of veto leptons 0
Emiss
T >100 GeV
pT(`ν) >200 GeV
Emiss
T /pT(eν) >0.2
V → Jselection
Num. of large-Rjets ≥ 1
D2Eff. working point (%) Pass 50 (80) Pass 50 (80) Pass 50 (80) Mass window
Eff. working point (%) Pass 50 (80) Fail 80 (80) Pass 50 (80) Topology cuts pT(`ν)/m(W V) >0.3 for VBF and>0.4 for DY category
pT(J)/m(W V)
Num. ofb-jets ∆R(J,b) >1.0 0 ≥ 1
their transverse momenta are expected to be close to half the reconstructed resonance mass. As a result, a threshold of 0.4 (0.3) is applied topT(J)/m(W V) andpT(`ν)/m(W V) in the DY (VBF) category. Furthermore, events are rejected if there is a b-jet present with a separation of∆R >
1.0 from the hadronically decayingV candidate. The latter requirement rejects more than 70% of background events fromt¯tproduction while keeping more than 95% of signal events, independently of the resonance mass. The surviving events are assigned to the high-purity (HP) region if the large-Rjet satisfies theV-tagging 50% efficiency working point, for both the mass window and the D2variable, as defined in Sec.4. Otherwise, it is considered as a low-purity (LP) event candidate if it satisfies the 80% efficiency working point. The selected HP and LP events can simultaneously pass bothW WandW Zselections if the large-Rjet passes both theW- andZ-selections.
• Resolved signal region: events that fail the selection criteria of the merged region and haveEmiss
T
> 60 GeV andpT (`ν) >75 GeV are considered. The hadronically decayingV candidate is formed by combining the two small-Rjets, excluding VBF tag-jets, with the highestpT and requiring their invariant mass to be between 66 and 94 (82 and 106) GeV in order to be consistent with theW (Z) boson mass. The two selected small-Rjets are required to have pT > 45 GeV (60 GeV for the highest pT jet) and the azimuthal angle separation between jets, lepton and Emiss
T direction must satisfy∆φ(j, `) >1.0,∆φ(j,Emiss
T ) >1.0,∆φ(j,j) <1.5 and∆φ(`,Emiss
T ) <1.5. In the calculation of theW V invariant mass, aV mass constraint is imposed to the two small-Rjets by rescaling the pTof the dijet system to bepj j
T ×m(V)/m(j j), wherepj j
T andm(j j)are the transverse momentum and the invariant mass of the dijet system respectively, andm(V)is the known value of theVboson mass. Studies using MC simulated events show that the mass constraint improves the resolution of the reconstructed diboson resonance mass by approximately 20%. In addition, selected events in the DY (VBF) category are required to satisfypT(j j)/m(W V) >0.35 (0.3) andpT(`ν)/m(W V) >
0.35 (0.3). Events are also rejected from theW W selection if both jets from theV boson decay are tagged asb-jets and from theW V selection if there is at least one additional jet tagged asb-jet in
Table 2: The list of the selection cuts in the resolved analysis for theW W andW Z signal regions (SR),W+jets control region (W CR) andtt¯control region (tt¯CR). The events are also categorized according to their production mechanism, the VBF selection is prioritized and the remaining events are assigned to the DY category.
Selection W W (W Z) SR W CR t¯tCR
Production Category VBF mtag(j,j) >770 GeV and|∆ηtag(j,j)| > 4.7
DY Fails VBF selection
W →`νselection
Num. of signal leptons 1
Num. of veto leptons 0
Emiss
T >60 GeV
pT(`ν) >75 GeV
Emiss
T /pT(eν) >0.2
V → j jselection
Num. of small-Rjets ≥ 2
pT(j1) >60 GeV
pT(j2) >45 GeV
m(j j)[ GeV] [66, 94] <66 [66, 106]
([82, 106]) or [106, 200]
Topology cuts
∆φ(j, `) >1.0
∆φ(j,Emiss
T ) >1.0
∆φ(j,j) <1.5
∆φ(`,Emiss
T ) <1.5
pT(`ν)/m(W V) >0.3 for VBF and 0.35 for DY category pT(j j)/m(W V)
Num. ofb-jets
b≡ j1orj2
whereV → j1j2 ≤ 1(2) ≤ 1 >2
b, j1andb, j2 or
whereV → j1j2 0 ≥1
the event. As for the merged channel, a threshold of 0.2 is set on the ratioEmiss
T /pT(eν)to suppress the multijet background in theeνqqchannel.
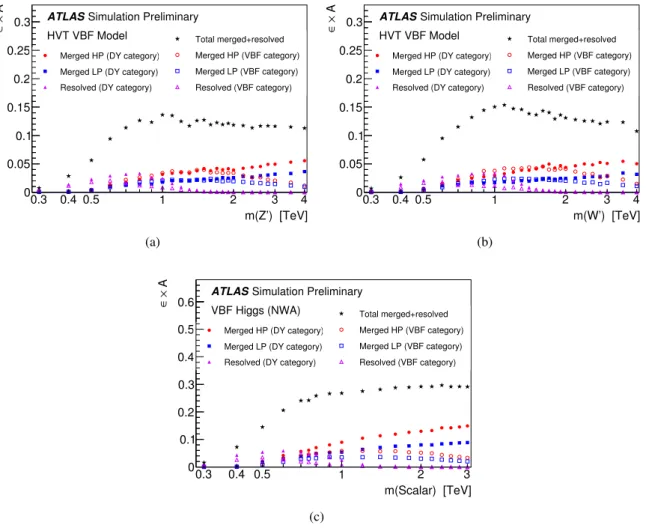
The signal acceptance times efficiency ( ×A), defined as the ratio of the number of signal events in the signal region to the number of generated signal events, is presented as a function of theW V → `νqq signal mass in Figs.2 and3for all the benchmark signals. To increase the sensitivity, priority is given to the VBF category in this study because of the lower cross section of VBF than DY, the small × A and the high fraction of the VBF signal leaks in the DY category. Concerning the × Aof the various analyses, the resolved analysis is more sensitive in the low-mass region, while the merged analysis is more efficient in the high mass region with a relatively constant×A. Overall, in the DY category, the selection efficiency is lower for the scalar signal because the production angle of the two bosons is less central and thepT(V)/m(W V)requirements reject more signal.
Studies using simulated events show thatW+jets andt¯tproduction are the dominant background sources.
TheW+jets contribution is found to be approximately 50%, 70% and 60%-65% in the high purity, low purity and resolved (W W-W Z) signal regions, respectively, while the corresponding fractions in the VBF category are 40%, 60% and 40%-55%. The different W W andW Z background compositions in the resolved analysis originate from the b-tagging strategies. Thett¯contamination in the DY category is
m(Z’) [TeV]
0.3 0.4 0.5 1 2 3 4
A×∈
0 0.05 0.1 0.15
0.2 0.25 0.3
Merged HP (DY category) Merged LP (DY category) Resolved (DY category)
Total merged+resolved Merged HP (VBF category) Merged LP (VBF category) Resolved (VBF category)
Simulation Preliminary ATLAS
HVT VBF Model
(a)
m(W’) [TeV]
0.3 0.4 0.5 1 2 3 4
A×∈
0 0.05 0.1 0.15 0.2 0.25 0.3
Merged HP (DY category) Merged LP (DY category) Resolved (DY category)
Total merged+resolved Merged HP (VBF category) Merged LP (VBF category) Resolved (VBF category)
Simulation Preliminary ATLAS
HVT VBF Model
(b)
m(Scalar) [TeV]
0.3 0.4 0.5 1 2 3
A×∈
0 0.1 0.2 0.3 0.4 0.5 0.6
Merged HP (DY category) Merged LP (DY category) Resolved (DY category)
Total merged+resolved Merged HP (VBF category) Merged LP (VBF category) Resolved (VBF category)
Simulation Preliminary ATLAS
VBF Higgs (NWA)
(c)
Figure 2: The product of signal efficiency () and acceptance (A) for signals produced via VBF mechanism is presented in both the DY and VBF categories. The×Ais presented for HVTW W →`νqq(a), HVTW Z →`νqq(b) and neutral scalar signal(c)decaying to`νqqin the various analysis signal regions. It is defined as the ratio of the number of signal events reconstructed in the signal region to the number of generated signal events.
measured to be 30% (20%) in the high (low) purity and 25% (30%) in the resolvedW W (W Z) signal regions. In the VBF category, 50%, 30% and 35%-50% of the events in the high purity, low purity and the resolved (W W-W Z) signal regions, respectively, are fromt¯t production. Smaller background contributions arise fromZ+jets, single-top and SM diboson productions. Control regions for the merged and resolved analyses as well as high and low purity categories are defined for events that fail the selection criteria of the signal regions in order to estimate the dominant background contributions:
• W+jets control regions are formed from events satisfying the signal region selection except for the invariant mass requirement of the hadronically decayingV candidate. The mass is required to be in the sideband region which is defined asm(j j) <66 GeV or 106 <m(j j)< 200 GeV for the resolved analysis. In the merged analysis, the sideband regions are formed by events not satisfying the mass window requirement for the 80% efficiency working point. Approximately 65% and 77% of the selected events are fromW+jets production in the DY category of the merged and resolved analyses, respectively. The remaining events are primarily fromtt¯production. The contribution ofW+jets
m(Z’) [TeV]
0.3 0.4 1 2 3 4 5
A×∈
0 0.1 0.2 0.3 0.4 0.5
Total merged+resolved Merged HP (DY category) Merged LP (DY category) Resolved (DY category)
Simulation ATLAS
Preliminary HVT DY Model
(a)
m(W’) [TeV]
0.3 0.4 1 2 3 4 5
A×∈
0 0.1 0.2 0.3 0.4 0.5
Total merged+resolved Merged HP (DY category) Merged LP (DY category) Resolved (DY category)
Simulation ATLAS
Preliminary HVT DY Model
(b)
) [TeV]
m(GKK
0.3 0.4 1 2 3 4 5
A×∈
0 0.1 0.2 0.3 0.4 0.5
Total merged+resolved Merged HP (DY category) Merged LP (DY category) Resolved (DY category)
Simulation ATLAS
Preliminary
=1.0) MPl
Bulk RS Model (k/
(c)
m(Scalar) [TeV]
0.3 0.4 0.5 1 2 3
A×∈
0 0.05 0.1 0.15 0.2 0.25 0.3 0.35
0.4 Total merged+resolved
Merged HP (DY category) Merged LP (DY category) Resolved (DY category)
Simulation ATLAS
Preliminary ggF Higgs (NWA)
(d)
Figure 3: The product of signal efficiency () and acceptance (A) is presented in the DY category for signals produced via ggF orqq¯fusion. The×Ais presented for HVTW W →`νqq(a), HVTW Z→`νqq(b), RSGkk→`νqq(c) and neutral scalar signal decaying to`νqqin the narrow width approximation (NWA)(d)in the various analysis categories. It is defined as the ratio of the number of signal events reconstructed in the signal region to the number of generated signal events.
processes is 50% and 65% for the merged and resolved analyses, respectively, in the VBF category.
• tt¯control regions are formed from events satisfying the signal region selection except for theb-jet requirement which is inverted. Studies using simulated events show that 77 - 87% of the selected DY and VBF category events are fromt¯t production and the rest are from single-top,V+jets or diboson production, for both merged and resolved event topologies.
6 Background Estimation
The shapes of the mass distributions for events from SM production ofW+jets andt¯tare modeled using simulated events. Their normalizations are determined from a combined fit to the events in the signal and control regions. Concerning the sub-dominant background contributions from Z+jets, single-top
and SM diboson productions, simulation is used to obtain the shapes and normalizations which are subsequently constrained within statistical and theoretical uncertainties. The contribution of multijet production primarily originates from events with jets or photon conversions misidentified as leptons or real but non-prompt leptons from heavy flavour decays of hadrons.
The multijet background in the merged event topology is found to be negligible. It is estimated by a fit to the Emiss
T distribution of events that satisfy all the signal selection criteria but without any Emiss
T
cut. The background shape of multijet background events is obtained from an independent data sample that satisfies the signal selection criteria except for the Emiss
T requirement and the lepton requirement:
the leptons are required to satisfy the veto lepton selection, defined in Sec.4, but not the signal lepton selection. Contributions from other processes with real leptons to the control sample are subtracted from data using samples of simulated events in the extraction of the multijet background shape. In the fit, the normalizations of the W+jets and the multijet components are allowed to float, with all the other backgrounds being fixed to their predicted cross sections.
A fake factor method is implemented to estimate the multijet background contribution in the resolved topology. New regions are defined to calculate the factor. The “signal lepton” control region is formed by events that have exactly one signal lepton and one small-Rjet. The same event selection criteria are applied to the events in the “inverted lepton” control region except for the lepton requirement: the selected electron candidate is required to be “Medium” but not “Tight”, and the selected muon candidate is required to fail the nominal but pass a looser isolation requirement. The fake factor is defined as the ratio of the number of events in the signal lepton to the number of events in the inverted lepton control regions, after using simulation to subtract contributions from other processes with prompt leptons. The fake factor is calculated as a function of the leptonpT andη, and Emiss
T . It is subsequently used to reweight a multijet control sample of events selected with the inverted lepton selection, as previously described, that satisfy the rest of the signal region selection.
7 Systematic Uncertainties
Modeling uncertainties affecting the shape of the final mass discriminant are evaluated for theW+jets background. These include uncertainties on the renormalisation and factorisation scales, the CKKW [73, 74] matching scales, the resummation scale, the PDF and the αs uncertainties. These uncertainties are obtained by varying the corresponding parameters in the nominal generator. Potential systematic uncertainties due to choices of parton shower and matrix element implementations are evaluated by comparing the nominal MC samples to the alternative samples generated using MadGraph.
The uncertainty in the shape of them(W V)distribution from thet¯tbackground is estimated by comparing the alternative sample generated by aMC@NLO [39] to the nominal sample. Additional systematic uncertainties associated to parton showering are evaluated by comparing the nominal Powheg+Pythia sample to the Powheg+Herwig++ sample described in Sec.3. The factorization and renormalization scales of the nominal generator are doubled and halved and their difference from the nominal sample is also applied as systematic uncertainty.
The SM diboson production cross section is fixed to the inclusive next-to-leading order calculation with a 30 % systematic uncertainty on the normalization. The m(W V) distribution shape uncertainty of the diboson background is estimated by comparing the prediction of the Powheg-Box to the nominal Sherpa.
Systematic uncertainties on the multijet background estimate are only considered in the resolved analysis, as this background contribution in the merged analysis is negligible. These are obtained by varying the lepton or isolation selection used in the fake factor calculation. In addition, the statistical uncertainties of the measured fake factors and the systematic uncertainties of the SM background contribution in the measurement of the fake factors, are taken into account in the evaluation of systematic uncertainties of the multijet background modeling.
Experimental uncertainties related to the physics objects used in this search are considered, affecting the shape and normalization of both background and signal distributions. These are evaluated for the trigger efficiencies, the energy scale and resolution of small-Rjets [60] and large-Rjets [64], lepton identification, reconstruction and isolation efficiencies, lepton momentum scales and resolutions [56, 57], b-tagging efficiency and misidentification rates [62,63], and missing transverse momentum resolution [72].
For central small-Rjets (|η| < 2.0), the total relative uncertainty on the jet energy scale [60] ranges from about 6% for jets withpTof 25 GeV to about 2% forpT of 1000 GeV. The uncertainty on the small-Rjet energy resolution ranges from 10 - 20% for jets withpTof 20 GeV to less than 5% for jets withpT > 200 GeV.
The uncertainties on the scale of the D2 variable and on the large-R jet energy and mass are evaluated by comparing the ratio of calorimeter-based to track-based energy and mass measurements in dijet data and simulation [64]. These uncertainties are of the order of 2 - 5%. An absolute uncertainty of 2% is assigned to the large-Rjet energy resolution and a relative uncertainty of 20% and 15% is assigned to the resolution of the large-Rjet mass andD2, respectively.
The dominant uncertainties on the signal yields arise from the choice of PDF and the uncertainty on the amount of initial and final state radiation (ISR and FSR, respectively) in simulated events. The cross section obtained with the nominal PDF set is compared to those of MMHT2014 [75] PDF and CT14 [76]
PDF to derive the uncertainties on the yield. The prescription in Ref. [77] is followed and the envelop of the uncertainties associated to the three PDF sets is used. The ISR/FSR contributions are computed by varying the parton shower and multi-parton interaction parameters following the prescription in Ref. [41].
The uncertainty in the combined 2015+2016 integrated luminosity is 3.2%. It is derived, following a methodology similar to that detailed in Ref. [78], from a preliminary calibration of the luminosity scale usingx-ybeam-separation scans performed in August 2015 and May 2016. This uncertainty is applied to the yields predicted by the simulation.
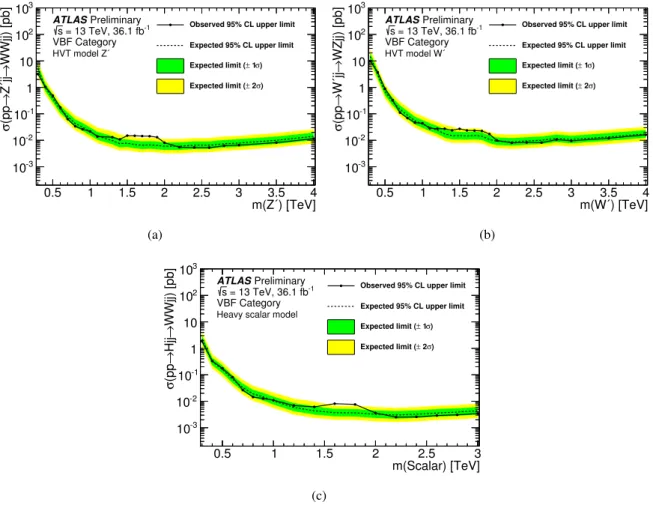
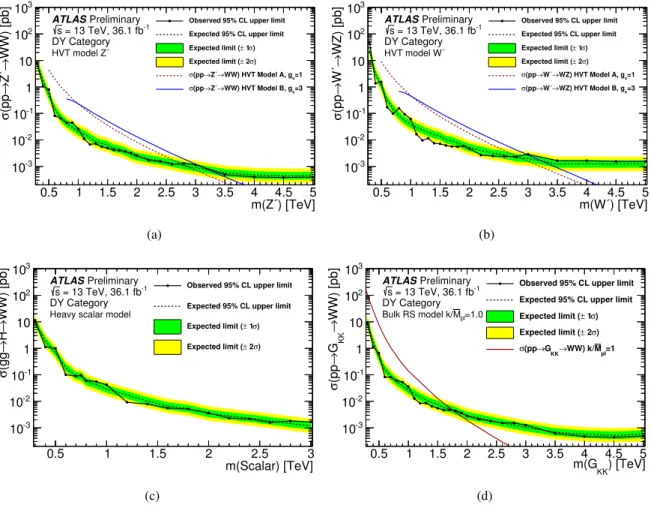
8 Results
The results are extracted by performing a simultaneous binned maximum-likelihood fit to the m(W V) distributions in the signal regions and the control regions forW+jets andt¯t. TheW W andW Z channels are treated individually because they partially overlap. A test statistic based on the profile likelihood ratio [79] is used to test hypothesized values of the global signal strength factor (µ), separately for each model considered. The likelihood is defined as the product of the Poisson likelihoods for all signal and control regions for a given production mechanism category and channel (W W orW Z), simultaneously for the electron and muon channels. The fit includes six contributions: W+jets, t¯t, single-top, Z+jets, diboson production and multijet processes. The main background sources, namelyW+jets and t¯t, are constrained by the corresponding control regions and are treated as uncorrelated among the resolved and merged signal regions. For each of these backgrounds, a normalization factor, defined as the ratio between