ATLAS-CONF-2013-028 24/04/2013
ATLAS NOTE
ATLAS-CONF-2013-028
March 10, 2013
Minor Revision: April 24, 2013
Search for electroweak production of supersymmetric particles in final states with at least two hadronically decaying taus and missing transverse
momentum with the ATLAS detector in proton-proton collisions at√ s =8 TeV
The ATLAS Collaboration
Abstract
Results of a search for the production of weakly coupled supersymmetric particles de- caying into final states with at least two hadronically decaying taus and missing transverse momentum are presented. The analysis uses the complete 2012 data sample of √
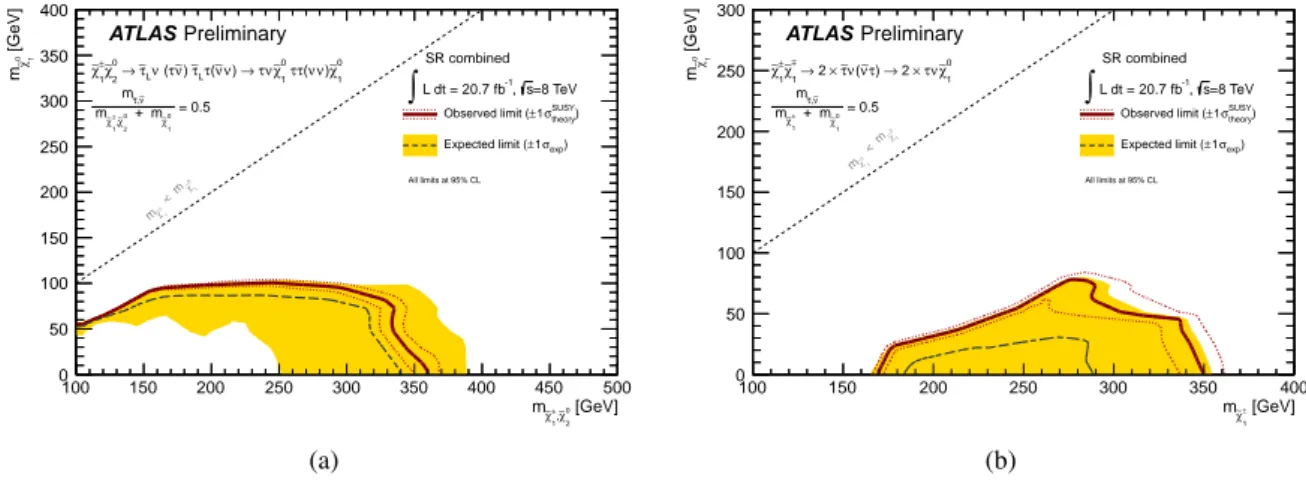
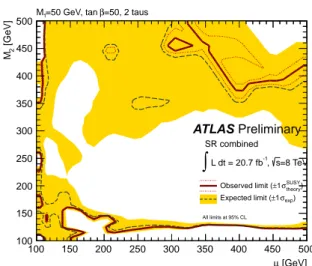
s=8 TeV proton-proton collisions recorded with the ATLAS detector at the CERN Large Hadron Col- lider, corresponding to a total integrated luminosity of 20.7 fb−1. No deviation from the Standard Model expectation is observed. Exclusion limits at 95% confidence level are de- rived in the context of the phenomenological Minimal Supersymmetric Standard Model and Simplified Models characterized by the presence of low mass staus. For Simplified Mod- els, chargino masses up to 350 GeV are excluded for a massless lightest neutralino in the scenario of direct production of wino-like chargino pairs decaying into the lightest neu- tralino via an intermediate on-shell tau slepton. In the case of pair production of degenerate charginos and next-to-lightest neutralinos, masses up to 330 (300) GeV are excluded for lightest neutralino masses below 50 (100) GeV.
A typo has been found in the mass ofχ˜±1 of SUSY reference point 2 on page 3 in the version of March 10. None of the figures, tables or conclusion have been changed.
c
Copyright 2013 CERN for the benefit of the ATLAS Collaboration.
Reproduction of this article or parts of it is allowed as specified in the CC-BY-3.0 license.
1 Introduction
One of the most appealing extensions to the Standard Model (SM) of particle physics is supersymmetry (SUSY) [1–9]. In R-parity conserving SUSY models [10–14], SUSY particles are produced in pairs and the Lightest Supersymmetric Particle (LSP) is stable and weakly interacting. From a theoretical point of view, beneficial features of SUSY models are that they could solve the hierarchy problem [14–
19], as well as provide a dark matter candidate (the LSP) [20–22]. In several SUSY models, the mass eigenstates formed from the linear superposition of the SUSY partners of the charged and neutral Higgs and electroweak gauge bosons, charginos ( ˜χ±i, i= 1, 2) and neutralinos ( ˜χ0j, j= 1, 2, 3, 4), as well as sleptons (superpartners of leptons, ˜`and ˜ν) can be sufficiently light to be produced at the LHC.
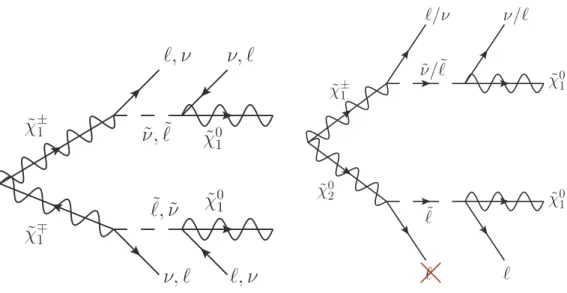
In the search presented here, Simplified Models [23] based on ˜χ±1χ˜02production and ˜χ±1χ˜∓1 production, where the charginos and neutralinos decay with 100% branching fraction to final states with (s)taus, are considered. A similar situation may also be realized in the framework of the phenomenological Minimal Supersymmetric Standard Model (MSSM), the pMSSM [24], where the dominant electroweak production channels are ˜χ±1χ˜02 and ˜χ±1χ˜∓1. Their decay properties depend on the MSSM parameters M1 and M2 (the gaugino masses), tanβ (the ratio of the vacuum values of the two neutral Higgses), and µ(the higgsino mixing mass term) which enter the neutralino and chargino mixing matrices [25]. The results are therefore also interpreted in the context of the pMSSM, with parameters chosen to enhance (s)tau production. In all cases the lightest neutralino ( ˜χ01) is the LSP. The probed new physics signatures are (see Figures 1 and 2):
• chargino-neutralino production, ˜χ±1χ˜02→τ˜Lν(τ˜ν) ˜τLτ→τνχ˜01ττχ˜01;
• chargino-chargino production: ˜χ±1χ˜∓1 →2×τν(˜˜ ντ)→2×τνχ˜01;
• direct tau slepton production: ˜τ±τ˜∓→2×τχ˜01.
Previous results from the ATLAS Collaboration cover electroweak production of supersymmet- ric particles in final states with electrons and muons, using signal models where the neutralinos and charginos decay with equal probability to all lepton flavours [26–28]. Preliminary limits on the chargino and neutralino masses in tau dominated scenarios have recently been presented by the CMS collabora- tion [29].
Final states containing at least two hadronically decaying taus are considered in this search. At least one tau pair is required to have opposite sign (OS). Events with additional light leptons (electrons or muons) are vetoed to allow for a statistical combination with similar searches using light leptons. The main SM background processes contributing to the selected final states are multi-jet production andW bosons produced in association with jets. In the first case the two tau candidates are misidentified; in the second case, one tau is produced in theWboson decay, and the other candidate is a misidentified jet. The analysis exploits the expected large magnitude of the missing transverse momentum,EmissT , generated by undetected LSPs, to discriminate SM processes from SUSY signal events. A further discriminating variable used in this search is the “stransverse mass” reconstructed using the two hadronic taus and EmissT . The stransverse mass, mT2, can be shown to have a kinematic endpoint for events where two massive pair-produced particles both decay to two objects, one of which is detected (the lepton in this case) and the other not (the neutralino) [30, 31]. In signal events, the kinematic endpoint depends on the mass difference between the decaying SUSY particle and the LSP.
2 SUSY models
We consider a pMSSM model with the following specifications. Squark and gluino masses are set to 3 TeV, tanβto 50, andM1to 50 GeV.M2andµare varied between 100 and 500 GeV. The lightest stau mass
˜ χ±1
˜ χ∓1
ℓ, ν ν, ℓ
˜
ν,ℓ˜ χ˜01
ℓ,˜ ν˜
ν, ℓ ℓ, ν
˜ χ01
˜ χ±1
˜ χ02
ℓ/ν
˜ ν/ℓ˜
ν/ℓ
˜ χ01
ℓ ℓ˜
ℓ
˜ χ01
Figure 1: Feynman diagrams for ˜χ±1χ˜∓1 (left) and ˜χ02χ˜±1 (right) decays with intermediate light left-handed charged sleptons and sneutrinos. The ˜χ02χ˜±1decay yields either 3 hadronic taus in the final state, or two in the case where the third lepton is missed because it is not reconstructed or is out of the detector acceptance.
Figure 2: A Feynman diagram illustrating the pair production of charged sleptons and subsequent decay into a two-lepton final state. Only staus are considered throughout this document.
is set to 95 GeV (LEP limit) [32–35], and the other slepton masses are heavy. In the considered pMSSM scenario, the dominant production processes are direct stau production and pair production of neutralino- chargino or chargino-chargino. In the former case, staus decay directly to the lightest neutralino and a tau, resulting in a τ+τ−+EmissT final state. In the latter case, the neutralinos and charginos will decay giving a variety of final states with multiple taus.
In addition, two Simplified Models are considered: neutralino-chargino ( ˜χ±1χ˜02) and chargino-chargino ( ˜χ±1χ˜∓1) production, where the neutralinos and charginos decay via intermediate charged sleptons and sneutrinos. All sparticles other than ˜χ±1, ˜χ02, ˜χ01, left-handed stau and tau sneutrino are assumed to be heavy. The stau and tau sneutrino are assumed to be mass degenerate, which is a fair assumption for large mass splitting between ˜χ±1 and ˜χ01. Furthermore, ˜χ±1 and ˜χ02 are assumed to be mass-degenerate without too much loss of generality. The ˜χ±1 mass is varied between 0 and 400 GeV, and the ˜χ01mass is varied between 0 and 250 GeV. The cross section for electroweak production of supersymmetric particles ranges between 10 and 0.01 pb in the considered models.
Two reference SUSY points are used throughout this document:
• SUSY Ref. point 1: chargino-neutralino production with mass( ˜χ±1, ˜χ01)=(250, 100) GeV;
• SUSY Ref. point 2: chargino-chargino production with mass( ˜χ±1, ˜χ01)=(250, 50) GeV.
A Simplified Model featuring only direct production of left-handed stau pairs is also considered, despite the low yields expected for this process. The cross section for direct stau production is one or two orders of magnitude lower than that of neutralinos and charginos and decreases from 0.2 to 0.03 pb as the stau mass increases from 80 to 140 GeV. The stau masses are generated in the range 80-140 GeV and the ˜χ01 mass varies between 0 and 40 GeV. Masses of all neutralinos and charginos other than the lightest neutralino are set to 2.5 TeV.
3 Signal and background simulation
The main sources of SM background, multi-jet andW+jets events, are estimated with data-driven meth- ods. Monte Carlo (MC) simulation is used to estimate the SUSY signal yields, as well as SM background contributions from processes leading to two real taus in the final state, such as top pair, single top and diboson (WW,WZ,ZZ) production, andZ boson production in association with jets. TheSHERPAgen- erator [36] is used for t¯t, VV (V = W,Z) and Z+jets simulation. SHERPAMC samples of W boson production in association with jets are used as a cross check and for systematics studies. TheW/Z+jets and t¯t samples contain matrix element (ME) calculations for up to four and five additional outgoing partons, respectively. The diboson samples use the defaultSHERPAsettings for renormalization and fac- torization scales and are generated with a cut on the invariant mass of the lepton pairs,mll > 0.4 GeV.
Samples oft¯t+V (V = W,Z) are generated with MadGraph[37] interfaced to PYTHIA[38]. Single-top production is simulated with MC@NLO(Wt ands-channel) [39] andAcerMC(t-channel) [40]. The NLO CT10 [41] parton distribution function (PDF) set is used forSHERPAandMC@NLO. The CTEQ6L1 [42]
set is used for MadGraph, AcerMC, PYTHIA. For the comparison with data, all SM background cross sections are normalized to the results of higher-order calculations when available. The theoretical cross sections forW+jets andZ+jets are calculated withDYNNLO[43] with the MSTW2008NNLO [44] PDF set. The inclusivet¯tcross section is calculated with HATHOR[45] using the MSTW2008NNLO PDFs.
The production of dibosons [46] and t¯tin association withW/Z [47, 48] are normalized to NLO cross sections.
The SUSY signal samples are generated withHERWIG++ [49] and the CTEQ6L1 PDF. The mass spectra are calculated with ISASUSY 7.80 [50], and the cross-sections are calculated to next-to-leading order withPROSPINO[51].
MC samples are processed through a detailed detector simulation [52] based onGeant4[53] and reconstructed in the same manner as the data. The effect of multiple ppcollisions in the same bunch crossing (pile-up) is modeled by overlaying simulated minimum-bias events to the MC hard-scattering event, suitably reweighted to reproduce the distribution observed in data.
4 Event selection and reconstruction
The ATLAS experiment is a multi-purpose particle physics detector with forward-backward symmet- ric cylindrical geometry, and nearly 4πcoverage in solid angle [54]. It features inner tracking detec- tors surrounded by a 2 T superconducting solenoid, electromagnetic and hadronic calorimeters, and a muon spectrometer consisting of precision-tracking and triggering chambers in a toroidal magnetic field.
The calorimeters, with acceptance covering the pseudorapidity1range|η| < 4.9, are composed of high- granularity liquid-argon calorimeters with lead, copper, or tungsten absorbers and an iron-scintillator calorimeter. Events are selected by a three level trigger system.
4.1 Object reconstruction
Jets are reconstructed from three-dimensional calorimeter energy clusters by the anti-ktalgorithm [55,56]
with a radius parameter of 0.4. Jet energies are corrected [57] for detector inhomogeneities, the non- compensating nature of the calorimeter, and the impact of multiple overlappingpp interactions, using factors derived from test beam, cosmic ray, andpp collision data, and from a detailedGeant4detector simulation [52]. We distinguish between light central jets, forward jets, andb-jets. Light central jets are required to have transverse momentum pT > 25 GeV and|η|< 2.5. To efficiently reject jets originating from pile-up interactions, at least 20% of the scalar sum of the pTof all tracks associated with the jet is required to come from tracks originating from the primary vertex of the event. The primary vertex of the event is required to be consistent with the beam spot envelope and to have at least 5 associated tracks;
when more than one such vertex is found, the vertex with the largest summed |pT|2 of the associated tracks is chosen. Forward jets must satisfy pT > 30 GeV and 2.5 < |η| < 4.5. Jets originating from b-quarks (b-jets) are identified using information related to track impact parameters and reconstructed secondary vertices [58]. The b-tagging requirements are set to an operating point corresponding to an average efficiency of 80%. Theb-jets are required to havepT >20 GeV and|η|<2.5.
The reconstruction of hadronically decaying taus is based on the information from topological clus- ters in the electromagnetic and hadronic calorimeters. The tau reconstruction algorithm is seeded by jets with pT > 10 GeV and |η| < 2.5. Tracks are subsequently associated with the tau cluster within a cone of ∆R < 0.2 around the axis of the seed jet. The reconstructed energy of the hadronic tau condi- dates is corrected to the tau energy scale, which is calibrated independently of the jet energy scale by a MC-based procedure [59]. Since the most common hadronic decays of taus are decays to either one or three charged pions, a neutrino and often additional neutral pions, taus are required to have 1 or 3 tracks (prongs) and a total charge of the tracks of either +1 or −1. For an improved discrimination between hadronically decaying taus and jets, electrons and muons, a multivariate algorithm is used [60]. The tau identification used in this analysis is based on the Boosted Decision Tree (BDT) method. A “jet BDT” is used to discriminate taus from jets, and an “electron BDT” to discriminate between electrons and taus.
Based on the jet BDT result, we distinguish between three tau identification criteria, corresponding to
“loose”, “medium”, and “tight” quality for the jet discrimination. These BDT identification for the jet discrimination have signal efficiencies of about 60%, 40% and 30%, respectively. The electron BDT discrimination is applied only to 1-prong taus, and the “loose” quality selection point is chosen. This requirement has about 95% signal efficiency. In addition, a dedicated muon veto is applied to remove tau candidates from muons coinciding with anomalous energy deposits in the calorimeter. Tau candidates are required to havepT>20 GeV and|η|<2.5.
Electron candidates must satisfy the “medium++” selection criteria [61] and are required to fullfill pT > 10 GeV, |η| < 2.47. Muon candidates are identified by matching an extrapolated inner detector track and one or more track segments in the muon spectrometer [62, 63]. They are required to fulfill
pT>10 GeV,|η|<2.4.
The calculation ofEmissT [64] is based on the vectorial sum of the pT of reconstructed objects (jets, leptons, photons) as well as calorimeter energy clusters (with|η| < 4.9) not belonging to reconstructed objects.
1The pseudorapidity is defined in terms of the polar angle θas η = −ln tan(θ/2) and the rapidity is defined asy = ln[(E+pz)/(E−pz)]/2. The separation between final state particles is defined as∆R=p
(∆y)2+(∆φ)2and is Lorentz invariant under boosts along thez-axis. The transverse momentum is denoted aspT.
The overlap between the various reconstructed objects is resolved as follows. Jet candidates are removed if they lie within a distance∆R= p
(∆η)2+(∆φ)2<0.2 of a tau or an electron. The remaining electron and muon candidates are rejected if they lie within 0.2<∆R<0.4 of a jet. Electron and muon candidates closer than∆R=0.1, or muon candidates closer than∆R=0.05, are rejected. To remove low mass resonances, pairs of opposite sign and same flavour leptons are rejected if their invariant mass is less than 12 GeV. Any tau candidate lying within a distance∆R<0.2 of any remaining electron or muon is discarded.
4.2 Event selection
In order to maximize the efficiency for SUSY signal events a combination of a di-tau trigger and a trigger on missing transverse momentum is used. Trigger efficiency studies show that the di-tau trigger reaches its efficiency plateau (at about 65% efficiency) when the leading tau has pT > 40 GeV and the next-to-leading tau has pT > 25 GeV. The EmissT trigger is fully efficient for events with ETmiss above 150 GeV. Events where the taus have pT > 20 GeV but the di-tau trigger has not fired are recovered by the EmissT trigger. Due to the largeEmissT requirement, however, this trigger only contributes a small fraction of the signal acceptance.
The event preselection requires the di-tau and/orEmissT -based trigger to have fired. Events with at least two taus of medium quality for the jet discrimination are selected, and one of these must satisfy the tight quality requirement. At least one of the selected tau pairs must be oppositely charged. Events with additional light leptons are vetoed.
To reject Z+jets events, events where the visible invariant mass of at least one of the oppositely charged tau pairs is within 10 GeV of the fitted value of the visible Z boson mass (81 GeV) obtained from a MCZ(→ ττ)+jets sample are vetoed. This requirement on the visible di-tau mass is referred to as the “Z-veto”.
At tree level, no jet is present in the processes of interest shown in Figures 1 and 2. However, jets can be generated from initial state radiation (ISR). To reduce backgrounds with top quarks but allow for ISR, either an event-based jet veto, rejecting events containing light central jets, forward jets orb-jets, or ab-jet veto only, rejecting events containingb-jets, is applied. Both requirements are powerful in rejecting backgrounds containing top quarks. The rejection of the (b-)jet veto on top backgrounds (t¯t, single top andt¯t+V) is about (10) 100. The trigger efficiency on selected events passing all the analysis cuts is around 90% for SUSY Ref point 1 and 2.
4.3 Signal regions
To further improve the signal over background ratio, requirements on EmissT andmT2 are applied. In events where more than two taus are selected,mT2is computed among all possible OS tau pairs and the largest value is chosen.
The signal region definition has been optimized on the SUSY models described in Section 2. Two signal regions are defined (see also Table 1 for a detailed specification of the selection requirements):
• SR OS-mT2: A jet veto is applied. Events are required to haveEmissT >40 GeV andmT2>90 GeV;
• SR OS-mT2-nobjet: A b-jet veto is applied. Events are required to have ETmiss > 40 GeV and mT2>100 GeV.
Signal region requirements OSmT2 at least 1 OS tau pair
jet veto Z-veto EmissT >40 GeV
mT2>90 GeV OSmT2-nobjet at least 1 OS tau pair
b-jet veto Z-veto EmissT >40 GeV mT2>100 GeV
Table 1: Definition of the signal regions.
5 SM Background determination
Two types of SM backgrounds are considered, according to the origin of the tau: fake taus from mis- identified jets (the contribution of real taus from heavy-flavour decays in jets is negligible) and real taus from prompt boson decays.
The reducible background consists of events containing one or more fake taus, primarily multi-jet andW+jets events. The irreducible background consists of events containing real taus. These include diboson,Z+jets or top production (t¯t, single top andt¯t+V). There may be contributions from fake taus also in these processes, however these are subdominant with respect to the real tau contribution. The contribution from real taus exceeds 90% inZ+jets and diboson production, and ranges from 45% to 75%
in backgrounds containing top quarks.
5.1 Reducible background estimation
The dominant background in the SRs originates from fake taus (75-80%). The fake tau rate modelling in the MC is not accurate. Moreover the available MC samples for both multi-jet andW+jets production are insufficient to provide a precise estimate of these contributions. The latter are therefore derived from data using the “ABCD” method.
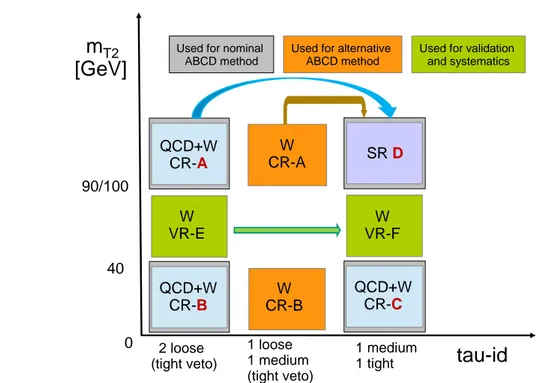
Four exclusive regions, labelled as A, B, C (the control regions) and D (the SR), are selected in a plane defined by two weakly correlated variables. For uncorrelated variables, the ratio of the numbers of events in the control regions A and B equals that of SR D to control region C: the number of events in the SR D, ND, can therefore be calculated from that in control region A,NA, multiplied by a normalization factorNC/NB.
The tau identification criterion (tau-id) andmT2 are chosen as discriminating variables to define the regions A, B, C and D. The control and signal regions are defined in the same way except that in the A and B control regions we require taus satisfying a “loose” but failing “tight” selection criteria (tight veto), which is orthogonal to the signal region criterion. In control regions B and C we require furthermore mT2<40 GeV. In the signal regions at least one tight tau and one medium tau are required, andmT2>90 GeV for SR OS-mT2(mT2>100 GeV for SR OS-mT2-nobjet). The main contribution to the CRs comes from by multi-jet andW+jets events (≥90%). TheW+jets contribution in the CRs ranges from 2% to 10%. Contributions from other SM processes are small and subtracted using the MC simulation. The definitions of the control and signal regions are summarized in Table 2. Furthermore two validation regions E and F are defined. The validation region E (F) has the same definition as the control region A
tau-id
1 loose 1 medium (tight veto)
1 medium 1 tight
mT2 [GeV]
0 40
QCD+W CR-B
QCD+W CR-C W
VR-E 90/100
QCD+W CR-A
W VR-F
SR D
Used for nominal ABCD method
Used for alternative ABCD method
Used for validation and systematics
W CR-A
W CR-B
2 loose (tight veto)
Figure 3: Illustration of the ABCD method for the inclusive multi-jet and W+jets background determi- nation. The control regions B, C, A, D for the nominal ABCD method described in the text (labelled as QCD+W CR-B/C/A and SR D) are drawn as light blue boxes. Shown in green and labelled as W-VR are the regions E (same as QCD+W CR-B except for requiring 40 < mT2< 90 GeV) and F (same as QCD+W CR-C except for requiring 40<mT2<90 GeV), which are used to validate the ABCD method and to estimate the systematic uncertainties. The nominal ABCD method is cross-checked by varying the composition of the CRs. The regions labelled as W CR-A, W CR-B are the ones used for the cross-check and are shown in orange.
(signal region D) except for requiring 40<mT2 <90 GeV. The validation regions E and F are richer in W+jets events than control regions B and C, and are used to verify the ABCD method and to estimate the systematic uncertainty from the residual correlation between tau-id andmT2. The regions A – F are drawn schematically in Figure 3.
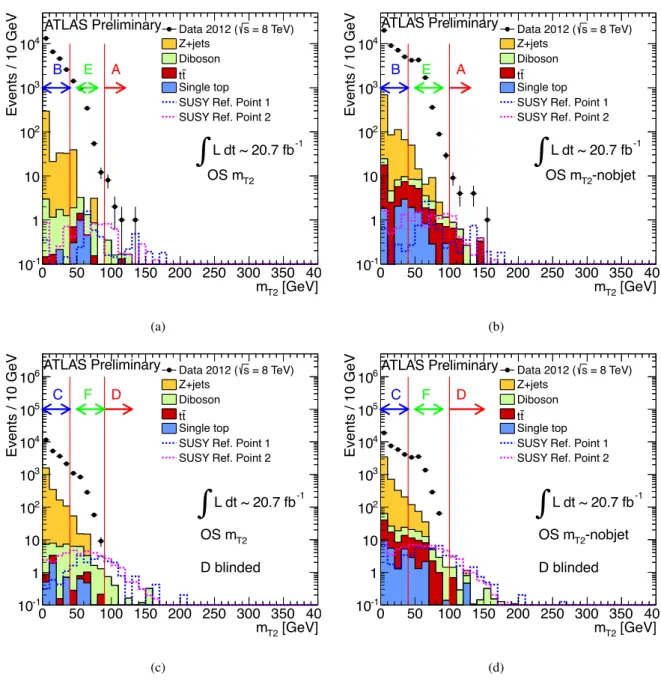
ThemT2 distributions in the control and validation regions are shown in Figure 4. The results of the ABCD method are summarized in Table 3. The impact of a possible contamination in the control regions has been tested using various signal models (also reported in Table 3). It has been found to be small compared to the total uncertainty in the multi-jet andW+jets background predictions.
The multi-jet and W+jets background estimation has been validated with an alternative ABCD method using control regions with different background composition, i.e. richer inW+jets events than the CRs A and B (theW-CRs A and B in Figure 4), and consistent results have been obtained.
5.2 Irreducible background estimation
Irreducible SM backgrounds arise mainly from t¯t, single top, t¯t+V, Z/γ∗+jets and diboson (WW, WZ andZZ) processes and are estimated from MC simulation. The simulation is corrected for the difference in efficiency of the tau identification and trigger between data and MC for both real and fake taus. The correction is calculated with a Tag-and-Probe method in a sample ofZ → ττ → µτhad events for real taus andW →µνevents for fake taus.
Regions multi-jet andW+jets background control region Signal region
A B C D
mT2>90 GeV mT2<40 GeV mT2<40 GeV mT2>90 GeV ETmiss>40 GeV ETmiss>40 GeV EmissT >40 GeV ETmiss>40 GeV OSmT2 ≥2 loose taus ≥2 loose taus ≥1 medium tau ≥1 medium tau
tight tau veto tight tau veto ≥1 tight tau ≥1 tight tau mT2>100 GeV mT2<40 GeV mT2<40 GeV mT2>100 GeV ETmiss>40 GeV ETmiss>40 GeV EmissT >40 GeV ETmiss>40 GeV OSmT2-nobjet ≥2 loose taus ≥2 loose taus ≥1 medium tau ≥1 medium tau
tight tau veto tight tau veto ≥1 tight tau ≥1 tight tau Table 2: The signal and the multi-jet andW+jets background control region definitions.
region A region B region C region E region F transfer
factor
multi-jet and W+jets in SR
Data 12 26932 22382 2781 2270
Z+jets - (3.7±0.6)
×102
(2.13±0.19)
×103 40±23 68±21
di-boson 0.84±0.22 6.6±0.8 23.1±1.3 4.8±0.7 15.8±1.2
single top - 0.21±0.21 3.1±1.9 1.7±1.1 1.1±0.5 0.760 8.4
OSmT2 tt¯ 0.13±0.13 0.31±0.20 2.0±0.7 1.0±0.4 1.2±0.4 ±0.010 ±3.0
Drell-Yan - 0.7±0.7 43±25 - -
Multi-jet,
W+jets 11.0±3.5 (2.655±0.018)
×104
(2.018±0.024)
×104
(2.73±0.06)
×103
2.08±0.04
×103 Ref. Point 1 1.5±0.5 0.6±0.3 2.4±0.6 2.9±1.4 12.4±1.5
Ref. Point 2 2.2±0.4 1.9±0.4 11.5±1.1 3.4±0.5 20.0±1.1
Data 18 41372 36291 10652 8597
Z+jets - (9.0±1.0)
×102
(4.47±0.21)
×103 56±24 175±29
di-boson 0.98±0.23 13.6±1.1 52.2±2.0 8.9±0.9 26.8±1.4
single top - 6.8±2.5 21±4 4.8±1.5 6.4±1.8 0.782 12
OSmT2 tt¯ 1.3±0.6 26.3±2.8 51.6±3.5 13.6±2.0 23.5±2.4 ±0.008 ±5
-nobjet Drell-Yan - 9±5 89±30 2.1±1.3 2.1±2.1
Multi-jet,
W+jets 16±4 (4.042±0.022)
×104
(3.160±0.029)
×104
(1.057±0.011)
×103
(8.26±0.08)
×103
Ref. Point 1 2.0±0.6 1.2±0.4 13.3±0.2 5.3±1.5 29.7±2.2
Ref. Point 2 2.6±0.4 4.1±0.5 22.8±1.4 6.9±0.7 36.3±1.5
Table 3: The expected backgrounds in each multi-jet andW+jets background control region and valida- tion region and the estimate of the multi-jet andW+jets background contribution in the signal regions.
The uncertainty in the last column is the total uncertainty on the multi-jet andW+jets background esti- mate, including both statistical and systematic uncertainties.
[GeV]
mT2
0 50 100 150 200 250 300 350 40
Events / 10 GeV
10-1
1 10 102
103
104
= 8 TeV) s Data 2012 ( Z+jets Diboson
t t Single top SUSY Ref. Point 1 SUSY Ref. Point 2
ATLAS Preliminary
L dt ~ 20.7 fb-1
OS mT2
A E B
(a)
[GeV]
mT2
0 50 100 150 200 250 300 350 40
Events / 10 GeV
10-1
1 10 102
103
104
= 8 TeV) s Data 2012 ( Z+jets Diboson
t t Single top SUSY Ref. Point 1 SUSY Ref. Point 2
ATLAS Preliminary
L dt ~ 20.7 fb-1
-nobjet OS mT2
A E B
(b)
[GeV]
mT2
0 50 100 150 200 250 300 350 40
Events / 10 GeV
10-1
1 10 102
103
104
105
106 Data 2012 ( s = 8 TeV)
Z+jets Diboson
t t Single top SUSY Ref. Point 1 SUSY Ref. Point 2
D F C
ATLAS Preliminary
L dt ~ 20.7 fb-1
OS mT2
D blinded
(c)
[GeV]
mT2
0 50 100 150 200 250 300 350 40
Events / 10 GeV
10-1
1 10 102
103
104
105
106 Data 2012 ( s = 8 TeV)
Z+jets Diboson
t t Single top SUSY Ref. Point 1 SUSY Ref. Point 2
D F C
ATLAS Preliminary
L dt ~ 20.7 fb-1
-nobjet OS mT2
D blinded
(d)
Figure 4:mT2distribution after requiring at least two loose but not tight taus in the multi-jet andW+jets background CRs corresponding to (a) SR OS-mT2and (b) SR OS-mT2-nobjet, and after requiring at least one tight and one medium tau for (c) SR OS-mT2 and (d) SR OS-mT2-nobjet. The stacked histograms show the contribution of the irreducible background from MC simulation, normalized to 20.7 fb−1. The data points show that the background is dominated by multi-jet andW+jets production. Indicated in the plots are the control (A,B,C) and validation (E,F) regions. Data events in the signal region D are not shown.
The inclusive contribution fromt¯t, single top,t¯t+V andZ/γ∗+jets amounts to about 1% of the total background in SR OS-mT2and to about 10% in SR OS-mT2-nobjet. The diboson background accounts for 20% in SR OS-mT2 and 15% in SR OS-mT2-nobjet respectively. The main contribution from diboson production is given byZZ→ττννevents. Other SM backgrounds are negligible.
The MC estimates, together with the prediction of the ABCD method, have been validated in regions enriched inW/Z+jets andt¯t events.
6 Systematic Uncertainties
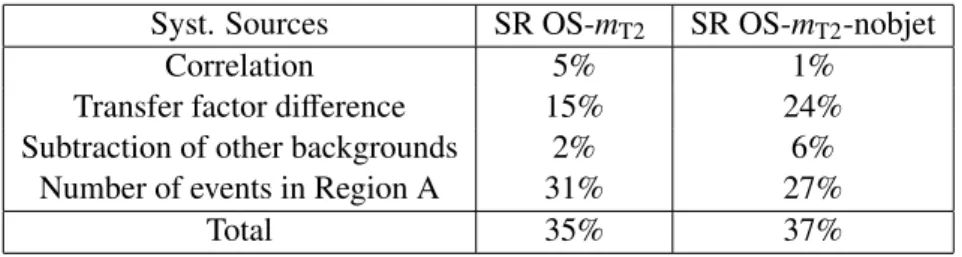
Several sources of systematic uncertainty are considered for the ABCD method used to determine the reducible background. The correlation between the tau-id andmT2variables for the multi-jet andW+jets backgrounds is estimated from the intermediate validation regions E and F. The transfer factor is defined as the ratio between the number of events in the loose tau-id regions (A, B) and the number of events in the medium+tight tau-id regions (D, C). Due to the small fraction of W+jets background events in the control regions, the transfer factor is dominated by multi-jet events. The transfer factor from the multi- jet dominated regions B and C is used, and the difference with the transfer factor calculated for W+jets events is treated as systematic uncertainty. The systematic uncertainty is obtained from the difference between the nominal ABCD transfer factor and that obtained using aW+jets MC sample. Other sources of systematic uncertainty arise from the subtraction of the irreducible background in region A (in regions B and C this background is negligible) and from the number of events in this region. The systematic uncertainties on the fake tau background estimation are summarized in Table 4. They are dominated by the limited statistics in the multi-jet and W+jets background control regions and by the transfer factor difference between multi-jet andW+jets background events.
Syst. Sources SR OS-mT2 SR OS-mT2-nobjet
Correlation 5% 1%
Transfer factor difference 15% 24%
Subtraction of other backgrounds 2% 6%
Number of events in Region A 31% 27%
Total 35% 37%
Table 4: Summary of systematic uncertainties on the fake tau background estimation.
The following systematic uncertainties on the irreducible background have been considered: jet en- ergy scale and resolution [57],ETmissenergy scale and resolution [64], and tau identification and trigger efficiencies and energy scale [59]. The main contribution comes from the tau-related systematic uncer- tainties, which are of the order of 5-30% forZ+jets, 5-15% for diboson production, and 30% fort¯t, single top andt¯t+V. Systematic uncertainties due to the choice of the MC generator have been evaluated by comparing the baseline estimates to those obtained with the following generators: HERWIG [65] for di- boson, Alpgen[66] forZ+jets, and PowHeg[67] fort¯t production. The resulting uncertainties are of the order of 10-30% for diboson, 40-50% forZ+jets, and 30-40% fort¯t production. A systematic uncertainty of the order of 10% associated with the simulation of pile-up is also taken into account. The luminos- ity uncertainty is 3.6% [68]. The theoretical uncertainties on the cross-sections are 5% forZ+jets [69],
+9.2
−10.1% fort¯t,+−2.694.07%,+−3.894.32% and+−7.697.43% for single top in thet-,s- andWt- channels respectively, and 5%, 5% and 7% forWW,ZZandWZ, respectively [70].
The total systematic uncertainty on the diboson background is around 30-40%, whereas fort¯t, single top,t¯t+V andZ+jets, it is around 70%. For signal events, the above sources of systematic uncertainties lead to a total systematic uncertainty of 15-20%.
7 Results and interpretations
The SM background estimates together with the observed data for each signal region are given in Table 5.
Good agreement is found. The observed and expected numbers of events together with their uncertainties are used to calculate exclusion limits for the SUSY models described in Section 2.
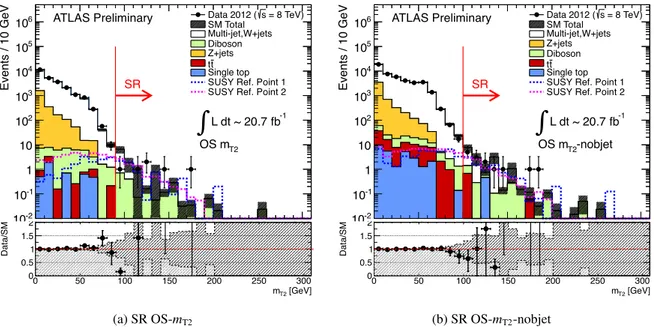
Figure 5 shows themT2 distribution for data and SM backgrounds in SR OS-mT2 and SR OS-mT2- nobjet. The SM background distributions are taken from MC, except for the multi-jet andW+jets con- tribution, which is estimated using the ABCD method.
SM process SR OSmT2 SR OSmT2-nobjet top 0.2±0.5±0.1 1.6±0.8±1.2 Z+jets 0.28±0.26±0.23 0.4±0.3±0.3 diboson 2.2±0.5±0.5 2.5±0.5±0.9 multi-jet &W+jets 8.4±2.6±1.4 12±3±3
SM total 11.0±2.7±1.5 17±4±3
data 6 14
SUSY Ref. point 1 6.8±1.0 9.2±1.2 SUSY Ref. point 2 7.5±0.7 8.9±0.7
Table 5: Expected number of events from SM processes in the signal regions, normalized to 20.7 fb−1, and the number of events observed in data. The first (second) uncertainty in each case is the statistical (systematic) uncertainty. The “top” contribution includes the single top, t¯t, andt¯t+V processes. The expected event yields for the two SUSY reference points are also shown.
[GeV]
miss
ET
0 50 100 150 200 250 300
Events / 10 GeV
10-2
10-1
1 10 102
103
104
105
106 Data 2012 (s = 8 TeV)
SM Total Multi-jet,W+jets Diboson Z+jets
t tSingle top SUSY Ref. Point 1 SUSY Ref. Point 2 ATLAS Preliminary
L dt ~ 20.7 fb-1
OS mT2
SR
[GeV]
mT2
0 50 100 150 200 250 300
Data/SM
0 0.5 1 1.5 2
(a) SR OS-mT2
[GeV]
miss
ET
0 50 100 150 200 250 300
Events / 10 GeV
10-2
10-1
1 10 102
103
104
105
106 Data 2012 (s = 8 TeV)
SM Total Multi-jet,W+jets Z+jets Diboson
t tSingle top SUSY Ref. Point 1 SUSY Ref. Point 2 ATLAS Preliminary
L dt ~ 20.7 fb-1
-nobjet OS mT2
SR
[GeV]
mT2
0 50 100 150 200 250 300
Data/SM
0 0.5 1 1.5 2
(b) SR OS-mT2-nobjet
Figure 5: mT2 distribution for (a) SR OS-mT2 and (b) SR OS-mT2-nobjet. The stacked histograms show the expected backgrounds. The white histogram represents the multi-jet andW+jets contribution obtained from data using the ABCD method. The SM backgrounds are normalized to 20.7 fb−1. The lower plots show the distributions of data over SM backgroud ratio.
The observed numbers of events in the signal regions are used to place model-independent upper limits at 95% confidence level (CL) on the visible cross-section. In addition, model-dependent exclusion limits at 95% CL are provided for the pMSSM and the Simplified Models described in Section 2. The exclusion limits are calculated using the CLs prescription [71] by comparing the number of observed events in data with the SM expectation using the profile likelihood ratio as test statistic. All systematic uncertainties are taken into account via nuisance parameters.