ATLAS-CONF-2014-014 27March2014
ATLAS NOTE
ATLAS-CONF-2014-014
March 25, 2014
Search for the direct pair production of top squarks decaying to a b-quark, a tau lepton, and weakly interacting particles in √
s = 8 TeV pp collisions using 20fb−1 of ATLAS data
The ATLAS Collaboration
Abstract
Preliminary results of a search for direct pair production of supersymmetric partners of the top quark decaying via aτslepton and with a gravitino in the final state (˜t1 →bνττ˜1 → bνττG) are reported. Top squarks are searched for in events with two leptons (electrons or˜ muons) in the final state using 20.3 fb−1 of integrated luminosity from LHC ppcollisions at √
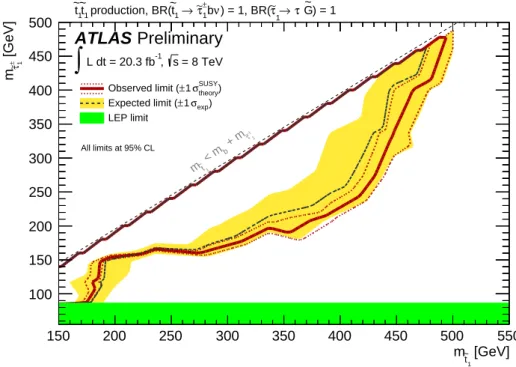
s = 8 TeV collected by the ATLAS detector. No excess above the Standard Model expectation is observed. Exclusion limits at 95% confidence level are placed as a function of the top squark andτslepton masses. Models where the mass difference between the top squark and theτslepton is below 35 GeV are excluded at 95% CL for top squark masses up to 480 GeV. Top squark masses below 170 GeV are excluded for allτslepton mass values.
c
Copyright 2014 CERN for the benefit of the ATLAS Collaboration.
Reproduction of this article or parts of it is allowed as specified in the CC-BY-3.0 license.
1 Introduction
Partners of the top quark are an ingredient of several models addressing the hierarchy problem [1–4] of the Standard Model (SM). A boson partner would stabilize the Higgs boson mass against quadratically divergent quantum corrections, provided its mass is close to the electroweak symmetry breaking energy scale, making it accessible at the LHC [5]. One of these models is supersymmetry (SUSY) [6–14]
which naturally resolves the hierarchy problem by introducing supersymmetric partners of the known bosons and fermions. In a generic R-parity conserving minimal supersymmetric extension of the SM (MSSM) [15–19] the scalar partners of right-handed and left-handed quarks, ˜qR and ˜qL, and charged leptons, ˜lRand ˜lL, can mix to form two squark and two slepton mass eigenstates. The lighter of the two top squark eigenstates is denoted as ˜t1and is referred to as the top squark in the following. Likewise, the lighter of the twoτslepton eigenstates is denoted ˜τ1and referred to as theτslepton in the following.
In gauge-mediated supersymmetry breaking (GMSB) models the spin 3/2 partner of the graviton, called the gravitino, is expected to be the lightest supersymmetric particle. Assuming that the mass scale of the messengers responsible for the supersymmetry breaking is of the order of 10 TeV, in order to have low fine tuning [20], the top squark is expected to be lighter than about 400 GeV [21]. If theτslepton is lighter and the supersymmetric partners of the gauge and Higgs boson are heavier than the top squark, the dominant decay mode of the ˜t1can be the three-body decay intobνττ˜1, followed by the ˜τ1decay into aτlepton and the gravitino. This is illustrated in Figure 1. No limits have been published so far from hadron collider searches for this decay mode, whilst the LEP experiments place a lower limit of 87 GeV on the mass of theτslepton [22–26].
Previous searches for top squark pair production performed by the ATLAS collaboration in the fully hadronic final states [27,28] and in final states with one electron or muon [29] are expected to have limited sensitivity to the decay mode with twoτleptons in the final state, because they have dedicated selections to reduce the background from pair production of top quarks with at least one of them decaying via a hadronicτ. The search with two electrons or muons, referred to also as`in the following, in the final state [30] is expected to have sensitivity to events where bothτleptons decay leptonically. Exclusion limits obtained by reinterpreting the results of Ref. [30] are reported, as well as a new search specifically targeting small ˜t1and ˜τ1masses.
˜t
˜t
˜ τ
˜ τ p
p
b ν
G˜ τ
b ν
G˜ τ
Figure 1: The diagram illustrates the production of a top squark pair, where each top squark undergoes a three-body decay intobνττ˜1, followed by the ˜τ1decay into aτlepton and the gravitino.
2 The ATLAS detector
The ATLAS detector [31] consists of inner tracking devices surrounded by a superconducting solenoid, electromagnetic and hadronic calorimeters and a muon spectrometer with a toroidal magnetic field. The
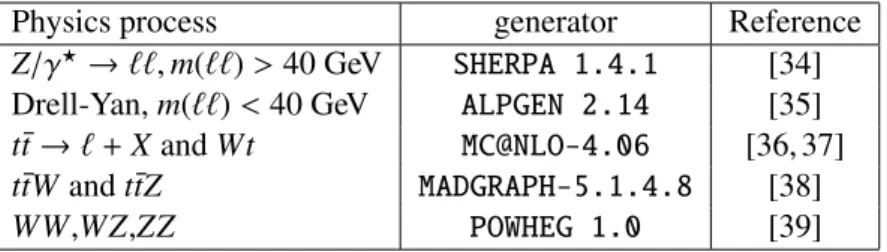
Table 1: The Monte Carlo samples used to simulate the most important SM background processes with prompt leptons in the final state. The ALPGEN and MC@NLO samples have been interfaced to HERWIG-6.5.20 [32] for the fragmentation and hadronization description, while MADGRAPH samples have been interfaced withPYTHIA-6.426[33] for the same purpose.
Physics process generator Reference
Z/γ?→``,m(``)>40 GeV SHERPA 1.4.1 [34]
Drell-Yan,m(``)<40 GeV ALPGEN 2.14 [35]
t¯t→`+XandWt MC@NLO-4.06 [36, 37]
t¯tWandt¯tZ MADGRAPH-5.1.4.8 [38]
WW,WZ,ZZ POWHEG 1.0 [39]
inner detector, in combination with the axial 2 T field from the solenoid, provides precision tracking of charged particles for|η| < 2.51. It consists of a silicon pixel detector, a silicon strip detector and a straw tube tracker that also provides transition radiation measurements for electron identification. The calorimeter system covers the pseudorapidity range|η| < 4.9. It is composed of sampling calorimeters with either liquid argon or scintillating tiles as the active media. The muon spectrometer has separate trigger and high-precision tracking chambers which provide muon trigger and measurement capabilities for|η|<2.4 and|η|<2.7, respectively.
3 Data and Monte Carlo samples
The search reported in Ref. [30] and the new selection reported here share the same dataset and trigger strategy. Proton-proton collisions at a centre-of-mass energy of 8 TeV are used. Events are required to pass either a single-electron, a single-muon, a double-electron, a double-muon, or an electron-muon trigger. The trigger efficiency exceeds 99% for the events passing the full selection described in Section 5. After beam, detector and data quality requirements, a total integrated luminosity of (20.3±0.6) fb−1 is used.
Several Monte Carlo (MC) simulated event samples are used to estimate the signal yields and to aid in the description of the SM background processes leading to two prompt leptons. For the larger SM contributions, the shape of distributions of kinematic variables is taken from simulation, while the nor- malization is determined by measurements in appropriate data control regions as described in Ref. [30].
For the smaller backgrounds with two prompt leptons and for the signal, both the normalization and shapes are taken from simulation. Contributions from events with misidentified leptons or leptons origi- nating from the decay ofb-hadrons orc-hadrons are estimated from data as described in Ref. [30].
The Monte Carlo samples which have been used for background processes are the same as those described in detail in Ref. [30]. A summary of the samples used to compute the central values of predicted background yields is reported in Table 1; additional samples are used in the evaluation of systematic uncertainties. The most accurate calculation of the total cross section for each process is used in the normalization of the samples in all cases, more details are reported in Ref. [30].
Signal samples with a top squark that always decays as ˜t1 → ντb˜τ1 → ντbτG˜ are generated with HERWIG++2.5.2[40]. The top squark and theτslepton mixings are such that the states involved in the
1ATLAS uses a right-handed coordinate system with its origin at the nominal interaction point (IP) in the centre of the detector and thez-axis coinciding with the axis of the beam pipe. Thex-axis points from the IP to the centre of the LHC ring, and they-axis points upwards. Cylindrical coordinates (r, φ) are used in the transverse plane,φbeing the azimuthal angle around the beam pipe. The pseudorapidity is defined in terms of the polar angleθasη=−ln tan(θ/2).
decay chain correspond to the partners of the corresponding right-handed SM fermions. The gravitino is assumed to be light enough that theτslepton lifetime is at least two orders of magnitude shorter than the τlepton lifetime. Signal cross sections are calculated to NLO in perturbative QCD, including the resummation of soft gluon emission at next-to-leading-logarithmic accuracy (NLO+NLL) [41–43], as described in Ref. [44]. Signal models have been generated for top squark mass values between 150 and 500 GeV, since models with smaller top squark mass values are expected to be excluded by previous searches [45, 46]. Theτslepton mass values range from the LEP limit at 87 GeV [22–26] to 490 GeV.
4 Physics object reconstruction
The same object definitions as Ref. [30] are used. Here only a brief summary of the identification criteria and kinematic selections is given for jets, leptons and transverse missing momentum.
Multiple vertex candidates from the proton–proton interaction are reconstructed using the tracks in the inner detector. The vertex with the highest scalar sum of the transverse momentum squared,Σp2T, of the associated tracks is defined as the primary vertex.
Jets are reconstructed from three-dimensional energy clusters in the calorimeter using the anti-ktjet algorithm [47, 48] with a radius parameter of 0.4. Only jet candidates with pT > 20 GeV,|η| < 2.5 are retained. The inner detector tracking information is used to reject jets produced by pile-up interactions and to identify jets originating fromb-quarks, referred to asb-jets in the following.
A neural-network-based algorithm is used to identifyb-jets. The inputs to this algorithm are the impact parameter of inner detector tracks, the parameters of reconstructed secondary vertices and the topology ofb- andc-hadron decays inside a jet [49]. The chosen operating point has an efficiency of 70%
for taggingb-jets in a MC sample oft¯tevents and rejection factors of 137 and 5 against jets originating from light quarks andc-quarks, respectively. To compensate for differences between the performance of the tagging algorithm in data and MC simulation, correction factors derived usingt¯tevents are applied to the jets in the simulation as described in Ref. [50].
Electron candidates are required to havepT >10 GeV,|η|<2.47 and to satisfy “tight” quality criteria [51] on the calorimetric and tracking measurements which discriminate electrons from jets. Non prompt and misidentified electrons are then suppressed by requiring the electrons to be isolated.
Muon candidates are reconstructed either from muon segments matched to inner detector tracks, or from combined tracks in the inner detector and muon spectrometer [52]. They are required to have pT > 10 GeV, |η| < 2.4. Muons from non collision sources, misidentified and non prompt muons are suppressed by requirements on the impact parameter from the reconstructed primary proton-proton interaction vertex, by the number of hits associated to various detectors, and by isolation requirements.
The measurement of the missing transverse momentum pmissT , whose magnitude is referred to as EmissT , is based on the transverse momenta of all jets and lepton candidates and all calorimeter clusters not associated to these objects [53].
5 Event selection
5.1 Event preselection requirements
The new selection shares the same preselection requirements as Ref. [30]. Events are required to have exactly two opposite-sign (OS) leptons (electrons or muons). At least one electron or muon must have a momentum larger than 25 GeV, in order to be in the trigger efficiency plateau regions, and the invariant mass of the two leptons is required to be larger than 20 GeV. If the event contains a third preselected electron or muon, the event is rejected. In order to reduce the number of background events contain- ing two leptons produced by the on-shell decay of theZ boson, the invariant mass of the same-flavour
lepton pairs is required to be outside the 71−111 GeV range. The angle ∆φ(pmissT ,p``Tb) between the pmissT vector and thep``Tb = pmissT +p`T1 +p`T2 vector2, introduced in Ref. [54], is required to be smaller than 1.5. The azimuthal angle difference between the pmissT vector and the direction of the closest jet,
∆φ(pmissT ,closest jet), is required to be larger than 1.0.
5.2 Largem``T2selection
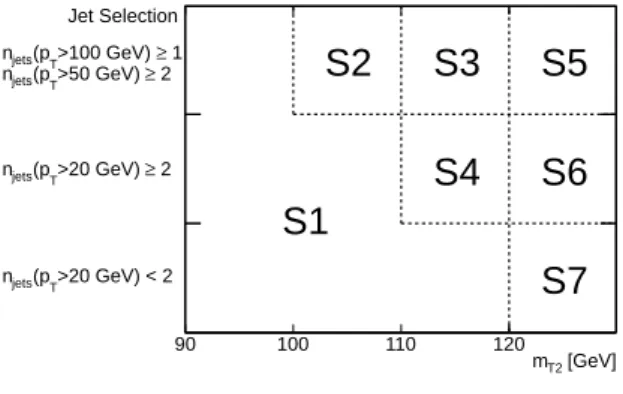
Seven signal regions (SRs) constructed by further selections on the number of jets and them``T2variable, illustrated in Figure 2, were defined in the search reported in Ref. [30]. Their statistical combination is used to place limits on the GMSB top squark model.
Them``T2variable is calculated as
mT2(pT,1,pT,2,pmissT )= min
qT,1+qT,2=pmissT
max[mT(pT,1,qT,1),mT(pT,2,qT,2) ] , (1) wheremT indicates the transverse mass,pT,1 andpT,2 are the transverse momentum vectors of the two leptons, andqT,1 andqT,2 are transverse vectors which satisfyqT,1+qT,2 = pmissT . The minimisation is performed over all the possible decompositions ofpmissT .
[GeV]
mT2
90 100 110 120
S1 S2
S4 S3
S7 S6 S5
Jet Selection
≥ 2
>20 GeV) (pT
njets
≥ 1
>100 GeV) (pT
njets
≥ 2
>50 GeV) (pT
njets
>20 GeV) < 2 (pT
njets
Figure 2: Scheme of the signal region definition in the (jet selections,m``T2) plane.
For theWW,Wt, andt¯tbackgrounds, where the leptons and the undetected neutrinos are produced by the decays ofW bosons, this variable is bounded from above by theW boson mass. For signal the two leptons and the undetected neutrinos and gravitinos are produced by the top squark decay, so this variable extends up to the top squark mass. In Figure 3 the fraction of signal which is selected by one of the SRs is shown as a function of the top squark andτslepton masses. The selection efficiency increases with increasing values of both masses.
5.3 SmallmT2j` selection
For small top squark andτslepton masses, the sensitivity of the largem``T2 selections from Ref. [30] is very low despite the high production cross section. In order to recover sensitivity to such a signal, a new dedicated signal selection has been designed.
After the preselection, at least two jets withpT > 20 GeV are required, at least one of them passing theb-tagging identification criteria. After this request the dominant SM background ist¯tproduction. The variable defined in Eq. 1 is then constructed using thepT,1=(p(`1)+p(j1))T andpT,2=(p(`2)+p(j2))T
2Note that the b inp``Tbdoes not bear any relation tob-jet. In Ref. [54] it was so named to indicate that it represents the transverse momentum of boosted objects.
where `1, `2 are the two leptons and j1,j2 are two jets, selected as described below and denotedmT2j`. If two or more jets in the event are tagged as b-jets, the two with the highest pT are considered. If only one jet passesb-tagging requirements, the non-tagged jet with the highestb-tagging neural-network output value is considered. In order to pair each lepton with the jet coming from the same decay leg, the invariant mass (m`j) is used. For background from top quark pair production, the kinematic end-point of m`j is about 155 GeV for the correct pairing. The signal models that are targeted have top squark mass values that range from 150 to 200 GeV: therefore the kinematic end-point ofm`jis similar to that of the top pair background. Hence, only the lepton-jet combinations with invariant mass below 180 GeV are considered. If only one combination satisfies this request, this is taken and used for the calculation of themT2j`. If both combinations satisfy this request, themT2j` is calculated for both combinations and the minimum is taken. If none of the combinations satisfies this request, the event is discarded.
The value ofmT2j` is bounded from above by the top mass for the top pair background and by the top squark mass for signal. ThemT2j` spectrum also peaks at smaller values, relative to the end-point, for the signal because more invisible particles are involved in the decay [55]. These features are illustrated in Figure 4, where the mT2j` distribution is reported for a signal with mt˜ = 153 GeV and mτ˜1 = 117 GeV, the top pair background and other SM backgrounds. An upper limit on mT2j` enhances the signal to background ratio for signals with a top squark mass smaller than or around the top quark mass. Sig- nal candidates are required to havemT2j` < 70 GeV, this value has been chosen by maximising the ex- pected sensitivity. This selection enhances the contribution of theZ+jets background and of events with misidentified or non-prompt leptons, butt¯tproduction remains the dominant background.
Additional selections have been adopted to increase the sensitivity. The ratioHT/meff is required to be less than 0.4, whereHTis the scalar sum of the transverse momenta of the two leading jets, andmeffis the scalar sum of the transverse momenta of the two leading jets, the transverse momenta of the leptons, and the missing transverse momentum. In addition to this, the ratio betweenEmissT and the scalar sum ofEmissT plus the transverse momenta of the two leptons is required to be greater than 0.45. These two requirements enhance the sensitivity because the signal is characterized by higher missing transverse momentum, softer jets and softer leptons than the SM background.
Finally the absolute value of∆xis required to be less than 0.04, with∆xdefined as:
∆x= 2·(p`z1 +p`z2)
√(s) , (2)
wherep`z1(`2)is thezcomponent of the momentum of the leading (sub-leading) lepton andsis the center- of-mass energy in the proton-proton system. This quantity has been suggested in Ref. [56] in the context of the search for new particles via spin measurements. It has been found to have a good discrimination power and the selection requirement has been chosen by maximizing the expected sensitivity to the targeted scenarios.
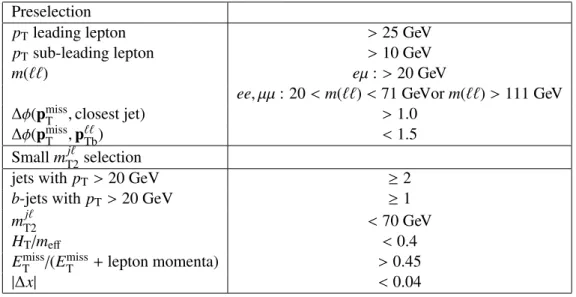
The summary of the selection requirements is reported in Table 2.
6 Background estimation
The background estimate for the search of top squark pair production in events with large m``T2 is de- scribed in Ref. [30]. In this section, the estimate of the background contribution for the new smallmT2j`
signal region is discussed.
The dominant SM background contributions are top pair andZ+jets production. Following the ap- proach described in Ref. [30], these background sources are evaluated by means of a likelihood fit with the observed events in two data control regions (CRs) as constraints and the normalisation terms for each background as free parameters. The two control regions are defined as:
[GeV]
t1
m~
150 200 250 300 350 400 450 500
[GeV] 1τ∼m
100 150 200 250 300 350 400 450 500
10-4
10-3
10-2
10-4
10-3
10-2
ATLAS Preliminary
selection
ll
Efficiency for the large mT2
) = 1 G~ τ
1→ τ∼
) = 1, BR(
ν
±b τ∼1 1→
~t production, BR(
t1
~ t1
~
= 8 TeV s
Figure 3: Efficiency of largem``T2 selection: fraction of signal events that are selected by at least one SR of Ref. [30] as a function of top squark andτslepton masses.
[GeV]
jl
mT2
0 50 100 150 200 250 300 350 400
Events / bin
10-1
1 10 102
103
104
105
= 8 TeV s
-1, L dt = 20.3 fb
∫
ATLAS Preliminary
SM Background others
Z+jets Single top Reducible
t t
)=(153,117) GeV τ∼1
1,
~t m(
Figure 4: Distribution ofmT2j` for the total SM background, the top pair background and a signal model with mt˜1 =153 GeV and mτ˜1 =117 GeV, after the preselection and the selection of the jets described in the text. The black arrow marks the selection used to define the new signal region.
Preselection
pTleading lepton >25 GeV
pTsub-leading lepton >10 GeV
m(``) eµ:>20 GeV
ee, µµ: 20<m(``)<71 GeVorm(``)>111 GeV
∆φ(pmissT ,closest jet) >1.0
∆φ(pmissT ,p``Tb) <1.5
SmallmT2j` selection
jets with pT>20 GeV ≥2
b-jets withpT>20 GeV ≥1
mT2j` <70 GeV
HT/meff <0.4
ETmiss/(EmissT +lepton momenta) >0.45
|∆x| <0.04
Table 2: Summary of the signal region selections for small top squark andτslepton masses.
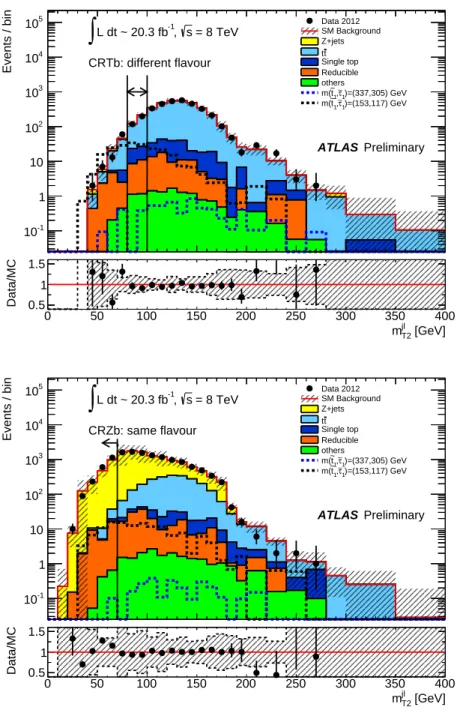
• CRTb, defined by different flavour (eµ) events with 80 GeV<mT2j` <100 GeV and passing all the SR selection requirements on other variables as described in Section 5.
• CRZb, defined by same flavour (ee or µµ) events which have mT2j` < 70 GeV and pass all the preselection requirements apart for the veto on theZmass window. This requirement is reversed and the two-lepton invariant mass is required to be between 71 GeV and 111 GeV. Events are then required to have at least 2 jets, one of them tagged as ab-jet andHT/meff <0.4.
Figure 5 shows the distribution of mT2j` for different flavour events passing all the selections of CRTb except that onmT2j` itself and the distribution ofmT2j` for same flavour events passing all the selections of CRZb except that onmT2j` itself.
Additional SM processes yielding two isolated leptons andEmissT (dibosons, Higgs,Wt,t¯tWandt¯tZ), and providing a sub-dominant contribution to the SR are determined from MC simulation. The non- prompt and misidentified lepton background is estimated from data using the same method described in Ref. [30].
The result of the fit as well as the expected background composition before the fit are reported in Table 3. For thet¯tandZ+jets backgrounds the fraction of events where at least one lepton comes fromτ decays is reported. For the top pair background, the expected contribution of events with aτin the signal region is very similar to that in the control region. For theZbackground the contribution is expected to be very different between the control region and the signal region. No events with aτenter in the control region, while the contribution in the signal region is about 50%.
The fit uses the same normalization factors forZ(ee),Z(µµ), andZ → ττ → `ν`ντ`ν`ντ. In order to verify that the MC correctly describes the ratio of event yields between these processes, and thus a common normalization factor can be used, an auxiliary fit is performed. A validation region (VR), composed ofeµevents passing the preselection and containing at least two jets, nob-tagged jet,m``T2 <
15 GeV, andm(``) < 80 GeV, is defined. TheZ(ττ)+jets events are 58% of the total expected events in this region, while the expected rate fromZ(``)+jets is negligible. TheZ+jets normalization for this auxiliary fit is derived with a control region using the same selections as VRZ, except that same flavour events with 71 GeV < m(``) < 111 GeV are required. The control and validation regions used in the auxiliary fit are defined in Table 4, where the observed number of events and the fitted background are reported. A good agreement is observed in the validation region between data and the predicted
[GeV]
jl
mT2
0 50 100 150 200 250 300 350 400
Events / bin
10-1
1 10 102
103
104
105
= 8 TeV s
-1, L dt ~ 20.3 fb
∫
ATLAS Preliminary CRTb: different flavour
Data 2012 SM Background Z+jets
t t Single top Reducible others
)=(337,305) GeV τ∼1
1,
~t m(
)=(153,117) GeV τ∼1
1,
~t m(
[GeV]
jl
mT2
0 50 100 150 200 250 300 350 400
Data/MC 0.5
1 1.5
[GeV]
jl
mT2
0 50 100 150 200 250 300 350 400
Events / bin
10-1
1 10 102
103
104
105
= 8 TeV s
-1, L dt ~ 20.3 fb
∫
ATLAS Preliminary CRZb: same flavour
Data 2012 SM Background Z+jets
t t Single top Reducible others
)=(337,305) GeV τ∼1
1,
~t m(
)=(153,117) GeV τ∼1
1,
~t m(
[GeV]
jl
mT2
0 50 100 150 200 250 300 350 400
Data/MC 0.5
1 1.5
Figure 5: Distribution of themT2j` variable for different flavour events passing all the selections of CTRb apart for the selection onmT2j` itself (top) and for events with two same flavour isolated leptons passing all the selections of CRZb apart for the selection on mT2j` itself (bottom). The components labelled
“Reducible” are the events with misidentified or non-prompt leptons and they are estimated from data as described in Ref. [30]; the other backgrounds are estimated from MC simulation, normalized to the theoretical cross section. The expected distributions for two signal models are also shown: the black dashed line corresponds to a model with m(˜t1)=153 GeV, m(˜τ1)=117 GeV; the blue dashed line to a model with m(˜t1)=337 GeV, m(˜τ1)=305 GeV. The term “others” includes dibosons, Higgs andttV contributions. Combined statistical, experimental and theoretical systematic uncertainties are included in the error bands. The black lines and the arrows mark the selection values used to define the control regions.
Table 3: Results of the background determination from fits to the two control regions. The total ex- pected background is computed using the normalizations from the fit and it is constrained to be equal to the observed number of events in the control regions. Nominal background expectations (normalized to the theoretical cross section) are given for comparison for those backgrounds (top pair and Z+jets production) which are normalized to data. Combined statistical, experimental and theoretical systematic uncertainties are included. Events with misidentified or non-prompt leptons are estimated with the data- driven technique described in Ref. [30]. The term “MC other backgrounds” includes dibosons, Higgs andttVcontributions. (*): In the control regions the fitted background events correspond to the observed events with their statistical uncertainty.
channel CRTb CRZb
Observed events 315 2061
Fitted bkg events (*) 315±18 2061±50
Fitted Top events 258±24 22±4
FittedZ(ee, µµ, ττ) events 7±6 2000±50
MC exp. SM events 340±70 1800±700
MC exp. Top events 280±60 24±8
τcontribution 29% 21%
MC exp.Z(ee, µµ, ττ) events 6+7−6 1700±700
τcontribution 95% <1%
MC exp. Wt events 31±10 3.5+−3.53.9
MC other backgrounds 2.3+−1.61.7 1.1+−1.11.7
data-driven expected misidentified/non-prompt leptons 17±7 31±16
Table 4: Definition of the regions used in the auxiliary fit, and fit results. The errors shown are the sta- tistical plus systematic uncertainties. (*): In the control regions the fitted background events correspond to the observed events with their statistical uncertainty.
channel CRTb CRZ VR
Flavour eµ eeandµµ eµ
m(``) >20 GeV 71 GeV<m(``)<111 GeV <80 GeV
jets withpT>20 GeV ≥2 ≥2 ≥2
b-jets withpT>20 GeV ≥1 0 0
m``T2 no requirement <15 GeV <15 GeV
mT2j` 80 GeV<mT2j` <100 GeV no requirement no requirement
HT/meff <0.4 no requirement no requirement
ETmiss/(ETmiss+lepton momenta) >0.45 no requirement no requirement
|∆x| <0.04 no requirement no requirement
Observed events 315 277557 5879
Fitted bkg events (*) 315±18 277557±500 6100±500
background, showing that the same normalization can indeed be used forZ(ee),Z(µµ), andZ →ττ→
`ν`ντ`ν`ντ as done for the SR fit.
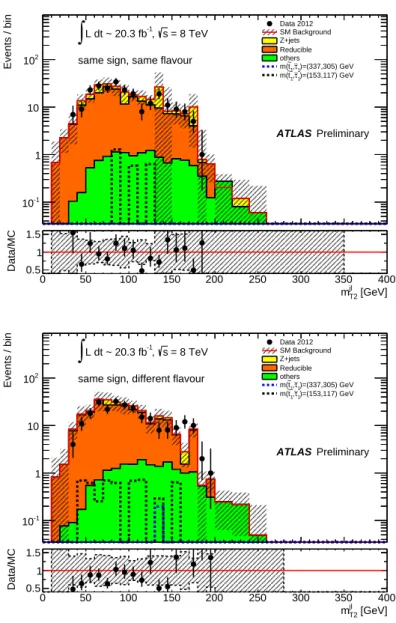
The description of the background coming from misidentified or non-prompt leptons has been tested as well, since its contribution in the new signal region is significant. A sample enriched with misidentified or non-prompt leptons has been selected by requiring the presence of two same sign leptons. Events have then been required to pass all the preselection requirements, to have at least two jets, one of them b-tagged, and mjl < 180 GeV. Figure 6 shows the distribution ofmT2j` for the different flavour and the same flavour channels separately. The predictions are in agreement with the data within the uncertainty.
7 Systematic Uncertainties
The estimate of the various sources of systematic uncertainties follows the same procedure as in Ref. [30].
For the experimental systematic uncertainties, non-negligible contributions are due to the jet en- ergy scale (JES) and the jet energy resolution (JER) uncertainties and the uncertainty on theb-tagging efficiency. Additional uncertainties arise from the contribution toEmissT from the energy scale and reso- lution of the calorimeter cells not associated to electrons, muons or jets, and also from low momentum (7 GeV< pT < 25 GeV) jets. The uncertainties in the lepton reconstruction efficiency and in the trigger modeling and on the modeling of pile-up have a negligible impact on the analysis. A±2.8% uncertainty on the luminosity determination was measured using techniques similar to those described in Ref. [57]
from a preliminary calibration of the luminosity scale derived from beam-separation scans performed in November 2012. It is included for all signal and background MC simulations.
The uncertainty on the misidentified or non-prompt lepton background estimate has been calculated as in Ref. [30] and it is the 1.5% of the total background uncertainty in the SR.
The leading theoretical uncertainties are due to the modeling of theZ+jets background, evaluated comparing the predictions ofSHERPAandALPGEN, and of the top pair background, evaluated comparing the predictions ofMC@NLOandPOWHEGfor the matrix element calculation, the predictions ofPYTHIAand Herwigfor the parton showering and hadronization, and the predictions of two ACERMCsamples with different tunings for the uncertainties related to the amount of initial and final state radiation (ISR and FSR).
Other significant sources of uncertainty are the limited number of events in the CRs and MC simula- tion samples.
A summary of the uncertainties on the total expected background for the new smallmT2j` signal region is given in Table 5. The row labelled “samples size” includes the effects of the limited number of data events in the CRs and the limited number of MC simulated events.
Experimental systematic uncertainties are also evaluated for the expected signal yields. They are about 30% for the targeted SUSY models, and are dominated by the JER uncertainty. The uncertainty on the signal cross section predictions is calculated as in Ref. [30] and the typical cross section uncertainty is±15% for the top squark signals considered in this search.
8 Results
Figure 7 shows the distributions of themT2j` variable after applying all the selection criteria except that on mT2j`. For illustration, the distributions for two signal models are also shown. The data agree with the SM background expectation within uncertainties.
Table 6 shows the expected number of events in the new smallmT2j` SR for each background source and the observed numbers of events. No excess of events is observed in data. Upper limits at 95% CL on the number of beyond the SM (BSM) events are derived using the CLs prescription [58] and neglecting
[GeV]
jl
mT2
0 50 100 150 200 250 300 350 400
Events / bin
10-1
1 10 102
= 8 TeV s
-1, L dt ~ 20.3 fb
∫
ATLAS Preliminary same sign, same flavour
Data 2012 SM Background Z+jets Reducible others
)=(337,305) GeV τ∼1
1,
~t m(
)=(153,117) GeV τ∼1
1,
~t m(
[GeV]
jl
mT2
0 50 100 150 200 250 300 350 400
Data/MC 0.5
1 1.5
[GeV]
jl
mT2
0 50 100 150 200 250 300 350 400
Events / bin
10-1
1 10 102
= 8 TeV s
-1, L dt ~ 20.3 fb
∫
ATLAS Preliminary same sign, different flavour
Data 2012 SM Background Z+jets Reducible others
)=(337,305) GeV τ∼1
1,
~t m(
)=(153,117) GeV τ∼1
1,
~t m(
[GeV]
jl
mT2
0 50 100 150 200 250 300 350 400
Data/MC 0.5
1 1.5
Figure 6: Distribution ofmT2j` for events with two same sign isolated leptons, passing all the preselection requirements, the request of the presence of at least 2 jets (one of themb-tagged) and mj`<180 GeV. The components labelled “Reducible” are the events with misidentified or non-prompt leptons and they are estimated from data as described in Ref. [30]; the other backgrounds are estimated from MC simulation.
The expected distributions for two signal models are also shown: the black dashed line corresponds to a model with m(˜t1)=153 GeV, m(˜τ1)=117 GeV; the blue dashed line to a model with m(˜t1)=337 GeV, m(˜τ1)=305 GeV. The term “others” includes dibosons, Higgs and ttV contributions. The plots report the distribution for the same flavour (top) and different flavour (bottom) channel respectively. Combined statistical, experimental and theoretical systematic uncertainties are included in the error bands.
[GeV]
jl
mT2
0 50 100 150 200 250 300 350 400
Events / bin
10-1
1 10 102
103
104
105
= 8 TeV s
-1, L dt ~ 20.3 fb
∫
ATLAS Preliminary SR: same flavour
Data 2012 SM Background Z+jets
t t Single top Reducible others
)=(337,305) GeV τ∼1
1,
~t m(
)=(153,117) GeV τ∼1
1,
~t m(
[GeV]
jl
mT2
0 50 100 150 200 250 300 350 400
Data/MC 0.5
1 1.5
[GeV]
jl
mT2
0 50 100 150 200 250 300 350 400
Events / bin
10-1
1 10 102
103
104
105
= 8 TeV s
-1, L dt ~ 20.3 fb
∫
ATLAS Preliminary SR: different flavour
Data 2012 SM Background Z+jets
t t Single top Reducible others
)=(337,305) GeV τ∼1
1,
~t m(
)=(153,117) GeV τ∼1
1,
~t m(
[GeV]
jl
mT2
0 50 100 150 200 250 300 350 400
Data/MC 0.5
1 1.5
Figure 7: Distributions ofmT2j` for events passing all the signal candidate selection requirements, except that onmT2j` for (top) same flavour and (bottom) different flavour events. The contributions from all SM backgrounds are shown; the bands represent the total uncertainty, including combined statistical, exper- imental and theoretical systematic uncertainties. The components labelled “Reducible” are the events with misidentified or non-prompt leptons and they are estimated from data as described in Ref. [30]; the other backgrounds are estimated from MC simulation with normalizations measured in control regions described in Section 6 fort¯tandZ+jets backgrounds. The expected distributions for two signal models are also shown: the black dashed line corresponds to a model with m(˜t1)=153 GeV, m(˜τ1)=117 GeV; the blue dashed line to a model with m(˜t1)=337 GeV, m(˜τ1)=305 GeV. The term “others” includes dibosons, Higgs andttVcontributions. The black lines and the arrows mark the selection value used to define the new signal region.
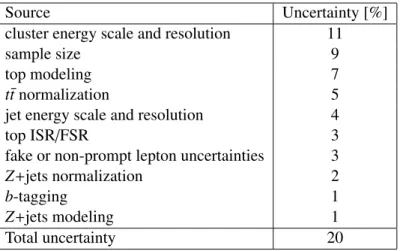
Table 5: Systematic uncertainties on the background estimate in the new small mT2j` signal region: the variations in the predicted background yield are quoted. The uncertainties ont¯tnormalization andZ+jets normalization include the uncertainties in the control regions, while the top modeling uncertainty in- cludes generator, parton shower and ISR/FSR uncertainties. It should be noted that the individual uncer- tainties can be correlated.
Source Uncertainty [%]
cluster energy scale and resolution 11
sample size 9
top modeling 7
t¯tnormalization 5
jet energy scale and resolution 4
top ISR/FSR 3
fake or non-prompt lepton uncertainties 3
Z+jets normalization 2
b-tagging 1
Z+jets modeling 1
Total uncertainty 20
Table 6: Number of events observed in 20.3 fb−1 of data at 8 TeV centre-of-mass energy, in the signal region, compared with background expectations obtained from the fits described in the text. The expecta- tions (normalised to theoretical cross-sections) are given for comparison for those backgrounds (top pair andZ+jets production) which are normalized to data. Combined statistical, experimental and theoretical systematic uncertainties are indicated. The term “MC other backgrounds” includes dibosons, Higgs and ttVcontributions.
channel SR
Observed events 59
Fitted bkg events 53±10
Fitted Top events 26±5
FittedZ(ee, µµ, ττ) events 14±7
MC exp. SM events 54±14
MC exp. Top events 29±8
τcontribution 32%
MC exp.Z(ee, µµ, ττ) events 12±7
τcontribution 52%
MC exp. Wt events 2.5±2.0
MC other backgrounds 0.47+−0.390.51
data-driven exp. misidentified/non-prompt leptons 10.0±3.5