ATLAS-CONF-2013-043 21/05/2013
ATLAS NOTE
ATLAS-CONF-2013-043
April 26, 2013
Minor Revision: May 21, 2013
Measurement of the forward-backward asymmetry of Z/γ∗ bosons decaying into electron or muon pairs with the ATLAS detector at
√s = 7TeV
The ATLAS Collaboration
Abstract
This note presents a study by the ATLAS experiment of lepton pairs fromZ/γ∗-boson decay. The results are based on the full set of data collected in 2011 in pp collisions at the LHC at √
s= 7 TeV, corresponding to an integrated luminosity of 4.8 fb−1. The forward- backward asymmetry (AFB) in theZ-boson rest-frame is measured and used to determine the effective weak mixing angle, sin2θWeff. The combination of the muon and electron channels yields a value of sin2θWeff =0.2297±0.0004(stat.)±0.0009(syst.).
Missing reference added and reference revised with respect to the version of April 26, 2013.
c
Copyright 2013 CERN for the benefit of the ATLAS Collaboration.
Reproduction of this article or parts of it is allowed as specified in the CC-BY-3.0 license.
1 Introduction
Due to theV−Anature of the electroweak interaction, the leptons produced in the annihilation process qq¯ → Z/γ∗ → l+l− present a forward-backward asymmetry (AFB) with respect to the quark direction in the rest frame of the dilepton system. The differential cross section for the lowest-order annihilation process can be written as:
dσ
d cosθ = 4πα2 3 ˆs
"
3
8A(1+cos2θ)+Bcosθ
#
(1) where √
ˆ
sis the center-of-mass energy of the incoming quarks, andθ is the angle between the lepton and the incoming quark in the rest frame of the dilepton system. The terms A andBare functions of
√ ˆ
s and of the quark and lepton couplings and charges. This analysis definesAFB using angles in the Collins-Soper (CS) frame [1], where the cosine of the decay angle cosθ∗CScan be written as a function of the lepton momenta in the laboratory frame:
cosθCS∗ = pz(`+`−)
|pz(`+`−)|
2(p+1p−2 − p−1p+2) m(`+`−)p
m(`+`−)2+pT(`+`−)2 (2) with
p±i = 1
√
2(Ei± pz,i)
whereEand pzare, respectively, the energy and longitudinal momentum of the lepton (i= 1) and anti- lepton (i=2). The variablespz(`+`−),m(`+`−), andpT(`+`−) denote the longitudinal momentum, invari- ant mass and transverse momentum of the dilepton system. The dilepton events having cosθ∗CS>0 are classified as forward (F), while those having cosθCS∗ <0 are classified as backward (B). The asymmetry AFBis then defined as:
AFB= σF−σB
σF+σB
(3) where σF andσB are the cross sections for the respective forward and backward configurations. The sign of cosθ∗CSis determined by the incoming quark, but there is no way in ppcollisions to determine to which beam it belonged. This ambiguity produces a significant dilution, i.e. a reduction, of the measured asymmetry AFB. Information on the longitudinal direction of the quark is obtained by calculating the longitudinal boost of the resulting lepton pair in the laboratory frame, and assuming that this is in the same direction as the incoming quark. This assumption yields the first term in Eq. 2. The probability of misidentifying the quark direction decreases with with increasing boost of the dilepton system. This also means that dileptons produced at larger rapidities are less affected by this dilution.
Several Standard Model parameters can be extracted from the measured AFB distribution. One of these is the electroweak mixing angle, sin2θW, which is defined at tree level as 1-m2W/m2Z. When higher- order loop corrections are taken into account the expression is modified to be the effective weak mixing angle, sin2θWeff. At collider experiments, although many energy scales (Q2) have been investigated, the value of sin2θWeff is most frequently quoted at theZ pole. The most precise measurements have come from the LEP and SLD experiments [2]. Their studies yield an average of sin2θWeff =0.23153±0.00016.
The two most accurate measurements are extracted from the forward-backward asymmetry in b-quark final states (A0,bFB) at LEP (sin2θWeff = 0.23221±0.00029) and from the leptonic left-right polarization asymmetry (Al) at SLD (sin2θWeff =0.23098±0.00026). These two values differ by∼3σ.
More recently, the CDF [3] and D0 [4] experiments at the Tevatron and the CMS [5, 6] experiment at the LHC have also measured the leptonic sin2θWeff. The CDF and D0 measurements were performed
using Z → ee decays from pp¯ collisions, and the CMS measurement was performed usingZ → µµ decays from ppcollisions. These results are presented in comparison with this analysis in Section 6.
2 The ATLAS detector
ATLAS [7] is a general-purpose detector installed at the LHC [8] at CERN. The detector subsystem closest to the interaction point, the Inner Detector (ID), provides precise position and momentum mea- surements of charged particles. It covers the pseudorapidity range1|η|<2.5 and provides full azimuthal coverage. It consists of three subdetectors arranged in a coaxial geometry around the beam axis: the silicon pixel detector, the silicon microstrip detector and the straw-tube transition-radiation tracker. A solenoid magnet generates a 2 T magnetic field in which the ID is immersed.
Electromagnetic calorimetry in the region|η| <3.2 is based on a high-granularity, lead/liquid-argon (LAr) sampling technology. Hadronic calorimetry uses a scintillating-tile/steel detector covering the re- gion|η|<1.7 and a Cu/LAr detector in the region 1.5<|η|<3.2. The most forward region of the detector (3.1< |η|< 4.9) is equipped with a dedicated forward calorimeter, measuring both electromagnetic and hadronic energies using Cu/LAr and W/LAr modules.
A large stand-alone Muon Spectrometer (MS) is the outermost part of the detector. It consists of three large air-core superconducting toroidal magnet systems: one barrel providing a field of about 0.5 T and two endcaps each providing a field of about 1 T. The deflection of the muon trajectories in the magnetic field is measured in three layers of precision drift tube chambers for|η|<2. In higherηregions (2.0 < |η| < 2.7), two layers of drift tube chambers are used in combination with one layer of cathode strip chambers in the innermost endcap wheels of the MS. Three layers of resistive plate chambers in the barrel (|η| < 1.05) and three layers of thin gap chambers in the endcaps (1.05 < |η| < 2.4) provide the muon trigger and also measure the muon trajectory in the non-bending plane of the spectrometer magnets.
A three-level trigger system is used to select events in real time. A hardware-based Level-1 trigger uses a subset of detector information to reduce the event rate to a design value of at most 75 kHz. The rate of accepted events is then reduced to about 300 Hz by two software-based trigger levels, Level-2 and the Event Filter.
3 Simulated samples
Monte Carlo samples used for signal and background events were generated and fully simulated in the common ATLAS offline software framework. The detector simulation was performed using the GEANT4 toolkit [9]. A set of corrections was applied to the simulated events to obtain a better description of the collision data concerning the following observables: average number of interactions per bunch crossing, z coordinate of the primary vertex, lepton energy/momentum scale and resolution, as well as trigger, identification and reconstruction efficiencies.
TheZ/γ∗signal samples were generated using PYTHIA6.4 [10] and reweighted to the MSTW2008LO parton distribution functions (PDFs) [11]. The cross section was calculated at next-to-next-to-leading or- der (NNLO) in QCD using PHOZPR [12] with MSTW2008 NNLO PDFs. The ratio of this cross section to the leading-order (LO) cross section was used to determine aK-factor, which was then applied to the generated signal. In addition, theZ/γ∗ pTdistribution was reweighted to the ATLAS PYTHIA tune from
1ATLAS uses a right-handed coordinate system with its origin at the nominal interaction point (IP) in the centre of the detector and thez-axis along the beam pipe. Thex-axis points from the IP to the centre of the LHC ring, and they-axis points upward. Cylindrical coordinates (r,φ) are used in the transverse plane,φbeing the azimuthal angle around the beam pipe. The pseudorapidity is defined in terms of the polar angleθasη=−ln tan(θ/2).
2010 [13, 14], which better matches the data. Higher-order corrections were taken into account using the HORACE [15] and MCFM [16] generators, as detailed in Section 5.
Backgrounds containing prompt isolated electron or muon pairs were estimated using Monte Carlo simulation. The background fromZ/γ∗ → ττdecays was also generated using PYTHIA6.4. Diboson (WW, WZ,andZZ) samples were generated with HERWIG [17]. Backgrounds fromt¯twere generated with MC@NLO [18], combined with HERWIG for showering and hadronization. The small contribution from multijet andW+jets backgrounds containing non-isolated leptons from heavy flavour decay and fake leptons from jets was estimated using data-driven techniques, as described in Section 4.3. Since the contribution fromW+jets was found to be a small fraction of the multijet background over the whole invariant mass range, the term multijet background will be used in the following to denote the sum of these contributions.
4 Event reconstruction and selection
4.1 Electron reconstruction
This analysis uses electrons in two distinct regions of the detector, the central region (|η|< 2.47) where there is tracking information available, and the forward region (2.5 < |η| < 4.9), where the electron reconstruction relies only on information from the calorimeter. Inclusion of electrons in the forward region is particularly important for this analysis as it allows the reconstruction of events where theZ/γ∗ candidate has larger rapidity, thus reducing the effect of dilution.
For both central and forward electrons, the reconstruction begins with energy deposits in the calorime- ters. Electron candidates in the central region must be matched to a reconstructed track from the ID. A transverse energy requirement,ET >25 GeV, was applied to both central and forward candidates. Elec- tron candidates in transition regions between the barrel and endcap calorimeters (1.37< |η|< 1.52) and between the endcap and forward calorimeters (3.16<|η|<3.35) were excluded from this analysis.
The central candidates must satisfy either “medium” or “tight” identification criteria, based on shower shape and track quality variables [19], and optimized for the 2011 data [20]. Forward electron candidates must satisfy similar “medium” quality criteria optimized specifically for forward electrons. Efficiency differences between these identification criteria in data and MC were studied and corrected using ded- icated (tag-and-probe) measurements [19]. The resulting corrections are typically close to unity, with modestET andηdependence.
Selected events must contain at least one pair of electrons satisfying the above requirements, con- sisting of either two “medium” candidates in the central region (central-central, referred to as CC) or one “tight” central electron candidate and one “medium” forward electron candidate (central-forward, referred to as CF). In the CC channel, the electrons are required to have opposite charges. This require- ment does not apply in the CF channel (since there is no track associated with forward electrons, they have no measured charge). The effect of charge misidentification was found to be negligible in both the CC and CF channels. In the CF channel, there is an additional requirement that the central electron be isolated, where the ET deposition in a cone of∆R(p
∆φ2+ ∆η2) < 0.2 around the electron candidate must be less than 5 GeV.
4.2 Muon reconstruction
The muon reconstruction and identification algorithms were used to produce two classes of muons [21]:
• combined muons: two independently reconstructed tracks (one in the ID and one in the MS) were matched and combined to obtain one global track.
• segment-tagged muons: a track from the ID was extrapolated to the MS, and matched to straight track segments in the precision muon chambers.
Specifically, muons must have pT > 20 GeV and lie within|η| < 2.4. The ID tracks associated to the muons must satisfy some quality requirements concerning the number of hits recorded by each subde- tector. To obtain a sample of prompt muons from collisions and minimize backgrounds, the tracks were required to have a longitudinal impact parameter with respect to the primary vertex (see Section 4.3) of less than 10 mm. Rejection against multijet backgrounds was improved by requiring the muons to be isolated. The isolation parameter used in this analysis was the relative momentum isolation, defined as the sum of the pT of all other tracks in a cone of ∆R < 0.2 around the muon track, divided by the muon pT:P
ptrackT /pµT <0.1. The kinematic quantities of the muons were measured by the ID, thereby minimizing the impact of residual misalignments between the ID and the MS. This choice also reduces the impact on the measurement of muon bremsstrahlung in the calorimeter. Charge misidentification for muons is expected to be very low, with negligible effect on this analysis. Charge misidentification for muons in the kinematic range ofZ→µµdecay is negligible.
4.3 Event selection and background estimation
This analysis uses data collected by the ATLAS detector in 2011, corresponding to an integrated luminos- ity of 4.8 fb−1for the electron channels and 4.7 fb−1for the muon channel. All events required optimal operating conditions of the ATLAS detector. Events which contain a noise burst, hardware problems or other sources of bad-quality clusters in the LAr calorimeter were rejected. Additionally, for an event to be selected, it must satisfy the following requirements:
• trigger: events in the electron channel must have passed the trigger corresponding to one electron with ET > 22 GeV. Events in the muon channel must have passed the muon trigger with a pT threshold of 18 GeV.
• primary vertex: events must have a reconstructed primary vertex with at least 3 tracks with pT > 400 MeV. For the muon channel there is an additional requirement that the longitudinal position of this vertex be within 200 mm of the nominal IP.
• event topology: either two oppositely charged leptons in the CC electron and muon channels or one central electron and one forward electron in the CF electron channel.
In the CC electron and muon channels, dilepton pairs with invariant masses up to 1000 GeV were used. In the CF channel, theAFBmeasurement was performed only for dilepton masses up to 250 GeV, because the background dominates at larger masses, leading to sizable systematic uncertainties on the signal.
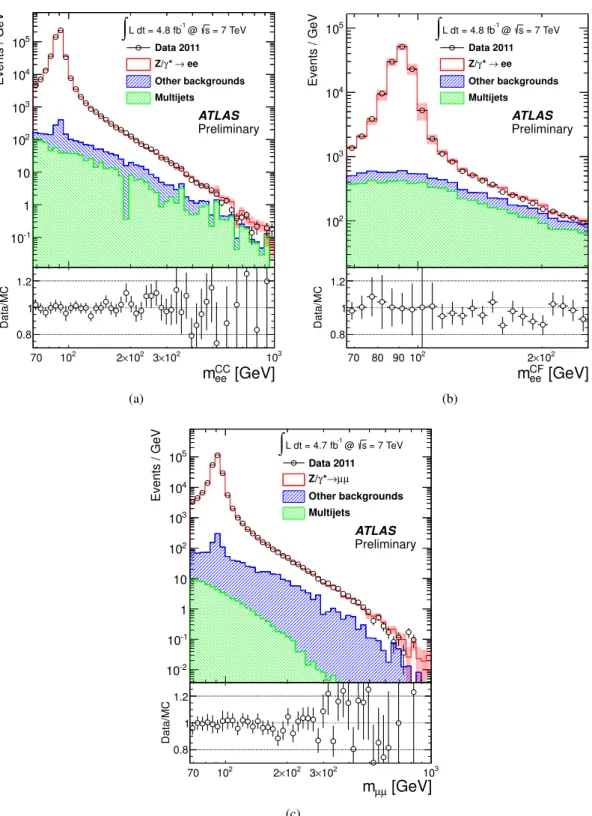
Figures 1 and 2 show the resulting invariant mass spectra and cosθ∗CSdistributions after event selec- tion for the three channels. Table 1 gives a detailed breakdown of the numbers of observed events in each channel in three invariant mass bins (low mass,Zpeak, high mass), together with the expected contribu- tions from signal and background. Agreement between data and MC is observed within the uncertainties over the whole invariant mass range and in the cosθCS∗ distributions. These uncertainties contain both the relevant statistical and systematic components and include the effects of: pileup, energy/momentum scale and resolution, imperfect knowledge of the trigger, charge misidentification, and imperfect alignment of the tracking detectors (referred to as misalignment). The associated systematic uncertainties were esti- mated following the standard prescriptions [19, 21, 22]. Uncertainties on the data-driven background are described in detail in the list of background contributions later in this section. The PDF uncertainties are described in Section 5. Figure 2(c) highlights the forward-backward asymmetry for the CF electron
channel, to better illustrate the smaller impact of dilution. The forward-backward asymmetry is large enough to be observed directly from the plot. Some discrepancies between data and MC are observed in the first and last bins in cosθCS∗ . However, their impact on the measurement of theAFBand sin2θWeff is small, since only the integral of the positive and negative side of these distributions is relevant. This is explained in more detail in Section 5.
Contributions from different background sources were estimated using either MC or data-driven techniques, as listed below:
• MC-based: for dibosons, Z/γ∗ → ττandt¯t, MC was used. The dominant background for the CC electron and muon channel across the whole invariant mass spectrum is the t¯tbackground.
Dibosons do contribute to the resonance at theZ pole; however, the cross-section relative to that of theZ/γ∗ signal is small. Same-flavour lepton pairs fromZ/γ∗ → ττdecays with subsequent decays of theτs to leptons, mostly populate the low end of the dilepton invariant mass spectrum.
The MC samples used in this analysis were described in greater detail in Section 3.
• data-driven: for the electron channels, the multijet background was estimated using a combination of data-driven techniques. These include the reverse identification method [23] for dilepton invari- ant masses below 125 GeV and thefake factor, ormatrix, method [24] for the rest of the invariant mass spectrum. This background was found to be three orders of magnitude less than the expected signal. In the muon channel, for all values of dilepton invariant mass, the multijet background was estimated from data by inverting the isolation cut. The resulting contamination was found to be four orders of magnitude below the expected signal. This background was subtracted from data together with the other backgrounds in the analysis. The uncertainties in the electron channels were estimated by taking the difference between the results from the two methods. In the muon channel, this uncertainty is negligible.
5 Measurement ofAFB
For each invariant mass bin, theAFBvalue was obtained from the corresponding cosθ∗CSdistribution by measuring the number of forward (cosθCS∗ ≥0) and backward events (cosθ∗CS<0), according to
AFB= Ncosθ∗
CS≥0−Ncosθ∗
CS<0
Ncosθ∗
CS≥0+Ncosθ∗
CS<0.
The expectedAFB spectrum was calculated using the PYTHIA samples described in Section 3 and taking into account next-to-leading (NLO) order corrections as follows:
• QED FSR: QED final state radiation was taken into account using PYTHIA [10] interfaced to PHOTOS [25]. PHOTOS was used in the exponentiated mode with multi-photon emission. This is the most significant correction to the LO measurement [26]. Measurements of small-angle QED final state radiation in low pileup conditions have been performed at ATLAS and good agreement with the simulation has been found [27].
• NLO QCD: these effects were taken into account, in a first step, by reweighting theZ/γ∗pTdistri- bution in the MC, as described in Section 3. Additional higher-order effects have been estimated using the MCFM Monte Carlo event generator [16]. Corrections from MCFM were taken as an additional systematic in the sin2θWeff measurement.
• NLO EWK: NLO electroweak corrections have been estimated using the HORACE Monte Carlo event generator [15], and were found to be negligible at the present level of precision. They were taken into account as an additional systematic uncertainty in the sin2θWeff measurement.
Events / GeV
10-1
1 10 102
103
104
105
= 7 TeV s
-1 @ L dt = 4.8 fb
∫
Data 2011
→ ee γ* Z/
Other backgrounds Multijets
ATLAS Preliminary
[GeV]
eeCC
m
70 102 2×10² 3×10² 103
Data/MC
0.8 1 1.2
(a)
Events / GeV
102
103
104
105 ∫L dt = 4.8 fb-1 @ s = 7 TeV Data 2011
→ ee γ* Z/
Other backgrounds Multijets
ATLAS Preliminary
[GeV]
eeCF
m
70 80 90102 2×10²
Data/MC
0.8 1 1.2
(b)
Events / GeV
10-2
10-1
1 10 102
103
104
105
= 7 TeV s
-1 @ L dt = 4.7 fb
∫
Data 2011 µ µ
→ γ* Z/
Other backgrounds Multijets
ATLAS Preliminary
[GeV]
µ
mµ
70 102 2×10² 3×10² 103
Data/MC
0.8 1 1.2
(c)
Figure 1: Dilepton invariant mass distributions obtained from the event selections described in the text, for the CC electron (a), CF electron (b) and muon channels (c). Data are shown in open circles and the total expectation is shown as a line with a band representing the total uncertainty (statistical and systematic). Also shown are the data-driven estimates for the multijet background and the MC-based estimates for all other backgrounds. The lower panel of the plot shows the data/MC ratio with the total uncertainty.
Events / 0.1
10 102
103
104
105
106
107
108
= 7 TeV s
-1 @ L dt = 4.8 fb
∫ Data 2011
→ ee γ* Z/
Other backgrounds Multijets
ATLAS Preliminary
CC
*CS
θ cos
-1 -0.5 0 0.5 1
Data/MC
0.9 0.95 1 1.05
(a)
Events / 0.1
10 102
103
104
105
106
107
108
= 7 TeV s
-1 @ L dt = 4.7 fb
∫ Data 2011 µ µ
→ γ* Z/
Other backgrounds Multijets
ATLAS Preliminary
*CS
θ cos
-1 -0.5 0 0.5 1
Data/MC
0.8 0.9 1
(b)
Events / 0.1
20 40 60 80 100
103
×
= 7 TeV s
-1 @ L dt = 4.7 fb
∫ Data 2011
→ee γ* Z/
Other backgrounds Multijets
ATLAS Preliminary
CF
*CS
θ cos
-1 -0.5 0 0.5 1
Data/MC
0.9 1 1.1
(c)
Events / 0.1
10 102
103
104
105
106
107 ∫L dt = 4.7 fb-1 @ s = 7 TeV Data 2011
→ee γ* Z/
Other backgrounds Multijets
ATLAS Preliminary
CF
*CS
θ cos
-1 -0.5 0 0.5 1
Data/MC
0.9 1 1.1
(d)
Figure 2: Distributions of cosθCS∗ obtained from the event selections described in the text, for the CC electron (a) and muon (b) channels in log scale. The CF electron channel is shown in both linear (c) and log (d) scale. Data are shown in open circles and the total expectation is shown as a line with a band representing the total uncertainty (statistical and systematic). Also shown are the data-driven estimates for the multijet background and the MC-based estimates for all other backgrounds. The lower panel of the plot shows the data/MC ratio with the total uncertainty.
CC electrons
Mass bin 66-70 GeV 70-250 GeV >250 GeV
Z/γ∗signal 7800±200 1191000±19000 1450±70 Other backgrounds 115±4 4140±70 210±10
Multijets 230±60 1800±500 20±100
Total expected 8100±300 1197000±19000 1680±120
Data 8281 1198767 1867
CF electrons
Mass bin 66-70 GeV 70-250 GeV
Z/γ∗signal 1570±110 321000±15000 –
Other backgrounds 300±50 7100±400 –
Multijets 800±100 18000±2000 –
Total expected 2630±150 346000±15000 –
Data 2537 344896 –
Muons
Mass bin 66-70 GeV 70-250 GeV >250 GeV
Z/γ∗signal 12500±400 1194000±26000 900±40
Other backgrounds 300±20 6100±160 200±15
Multijets 40±10 260±50 1±1
Total expected 12900±400 1200000±26000 1110±40
Data 12702 1185620 1136
Table 1: Observed and expected numbers of events, for each of the three channels (CC electrons, CF electrons and muons) and for three invariant mass bins are given with their total uncertainties for the two background categories (see Section 3): multijets, i.e. multijets and W+jets, and other backgrounds, i.e.
t¯t, dibosons, andZ/γ∗→ττ.
The raw asymmetry distributions obtained in the electron and muon channels, after background sub- traction, are shown in Fig. 3. Good agreement between data and Monte Carlo is observed, as illus- trated by the pulls at the bottom of each figure. As explained in Section 4.3, the CF electron spectrum is restricted to the invariant mass range where a non-negligible signal contribution is expected. Fig- ure 4 shows the same distributions in a narrower mass range around theZpole.
The measured raw asymmetry can be unfolded from detector-level to parton-level, to allow for more straightforward comparisons with theoretical predictions. The unfolding must correct for the following effects (collectively referred to as mass bin migration):
• detector effects: the finite resolution of the detector deforms the measured Z/γ∗ line shape (the asymmetry spectrum) with respect to what one would measure with an ideal apparatus covering the same kinematic range, including lepton reconstruction efficiencies and effects due to pileup.
• QED radiative corrections: the effect of radiative corrections [26], or final state radiation (FSR), is mainly to deform the shape of the dilepton invariant mass distribution. This deformation is par- ticularly pronounced below theZpeak. Specifically, for what concerns theAFB, QED corrections move events from theZpeak (i.e.AFBpositive and small) towards smaller values of invariant mass, significantly reducing the magnitude of the observed AFB in the region 66 GeV< m`` < mZ. In the high-mass region (m`` > mZ) the deformation due to radiative corrections is still present, but is reduced in magnitude. To properly account for these corrections, dileptons are unfolded to the pre-FSR state, referred to asBorn-level.
The results unfolded for detector effects and QED FSR can be corrected further to remove dilution effects which occur when the wrong choice is made for the direction of the incoming quark. The correc- tion for dilution relies heavily on MC, in particular on the precise knowledge of PDFs and on accurate modeling of higher-order effects. In this analysis, the unfolding for dilution and the extrapolation to the full phase space were done following the lowest-order model, as implemented in PYTHIA.
The raw measurement of AFB was corrected for all the effects described above by means of a response-matrix-based unfolding. The RooUnfold toolkit [28] was used to perform the unfolding us- ing an iterative Bayesian method [29]. All steps of unfolding have been validated using closure tests on simulated samples. Figure 5 shows theAFBspectra for all three channels unfolded toBorn-level, taking into account only the effects due to mass bin migration. The MC prediction is in good agreement with the measured distributions, as illustrated in the pulls at the bottom of each figure. The fully corrected spectra forBorn-level leptons are shown in Fig. 6. The model-dependent correction for dilution has the largest impact on theAFBdistribution. Good agreement is observed between the measured and predicted spectra.
The systematic uncertainties on the asymmetry measurement described above receive contributions from different sources:
• choice of the unfolding algorithm: estimated using a partially data-driven method. A set of weights has been determined to reweight thereconstructed simulated AFB spectrum to the spectrum ob- served in data. These weights were then applied to the generator-level spectrum. The response matrix used in the unfolding was applied to the resulting spectrum tofoldand subsequentlyunfold it. Particular care was taken to make the matrices used for the folding and the unfolding statisti- cally independent. The generator-level spectrum after the fold-unfold operation was compared to the original generator-level spectrum, and the difference was taken as an estimate of the uncertainty introduced by the unfolding.
• choice of the Monte Carlo generator and impact of higher order electroweak (EWK) and QCD effects: this has been assessed using the HORACE and MCFM event generators, respectively.
FBA
-0.6 -0.4 -0.2 0 0.2 0.4 0.6 0.8 1 1.2
Data PYTHIA
ATLASPreliminary
= 7 TeV s
-1 @ L dt = 4.8 fb
∫
[GeV]
CCee
m
70 102 2×10² 3×10² 103
σ/∆
-2 -1 0 1 2
(a)
FBA
-0.6 -0.4 -0.2 0 0.2 0.4 0.6 0.8 1 1.2
Data PYTHIA
ATLASPreliminary
= 7 TeV s
-1 @ L dt = 4.8 fb
∫
[GeV]
CFee
m
70 80 90 102 2×10²
σ/∆
-2 -1 0 1 2
(b)
FBA
-0.6 -0.4 -0.2 0 0.2 0.4 0.6 0.8 1 1.2
Data PYTHIA
ATLAS
= 7 TeV s
-1 @ L dt = 4.7 fb
∫
Preliminary
[GeV]
µ
mµ
70 102 2×10² 3×10² 103
σ/∆
-2 -1 0 1 2
(c)
Figure 3: Raw AFB distributions for the CC electron (a), CF electron (b) and muon (c) channels, after background subtraction. For the data, the boxed shaded region represents the total (statisti- cal+systematic) uncertainty and the error bars represent the statistical uncertainty. The boxed shaded regions for the MC represent only the statistical uncertainty. The ratio plots at the bottom of each figure display the distribution of pulls (∆/σ) for eachAFBdistribution, where∆is the difference between data and MC andσis the quadratic sum of the data and MC uncertainties.
FBA
-0.3 -0.2 -0.1 0 0.1 0.2 0.3
Data PYTHIA
ATLASPreliminary
= 7 TeV s
-1 @ L dt = 4.8 fb
∫
[GeV]
CC
mee
80 85 90 95 100 105 110
σ/∆
-2 -1 0 1 2
(a)
FBA
-0.3 -0.2 -0.1 0 0.1 0.2 0.3
Data PYTHIA
ATLASPreliminary
= 7 TeV s
-1 @ L dt = 4.8 fb
∫
[GeV]
CF
mee
80 85 90 95 100 105 110
σ/∆
-2 -1 0 1 2
(b)
FBA
-0.3 -0.2 -0.1 0 0.1 0.2 0.3
Data PYTHIA
ATLAS
= 7 TeV s
-1 @ L dt = 4.7 fb
∫
Preliminary
[GeV]
µ
mµ
80 85 90 95 100 105 110
σ/∆
-2 -1 0 1 2
(c)
Figure 4: Raw AFB distributions for the CC electron (a), CF electron (b) and muon (c) channels in a narrow region around the Z pole, after background subtraction. For the data, the boxed shaded region represents the total (statistical+systematic) uncertainty and the error bars represent the statistical uncer- tainty. The boxed shaded regions for the MC represent only the statistical uncertainty. The ratio plots at the bottom of each figure display the distribution of pulls (∆/σ, defined in Fig. 3).
FBA
-0.6 -0.4 -0.2 0 0.2 0.4 0.6 0.8 1 1.2
Data PYTHIA
ATLASPreliminary
= 7 TeV s
-1 @ L dt = 4.8 fb
∫
[GeV]
CC
mee
70 102 2×10² 3×10² 103
σ/∆
-2 -1 0 1 2
(a)
FBA
-0.6 -0.4 -0.2 0 0.2 0.4 0.6 0.8 1 1.2
Data PYTHIA
ATLASPreliminary
= 7 TeV s
-1 @ L dt = 4.8 fb
∫
[GeV]
CF
mee
70 80 90 102 2×10²
σ/∆
-2 -1 0 1 2
(b)
FBA
-0.6 -0.4 -0.2 0 0.2 0.4 0.6 0.8 1 1.2
Data PYTHIA
ATLAS
= 7 TeV s
-1 @ L dt = 4.7 fb
∫
Preliminary
[GeV]
µ
mµ
70 102 2×10² 3×10² 103
σ/∆
-2 -1 0 1 2
(c)
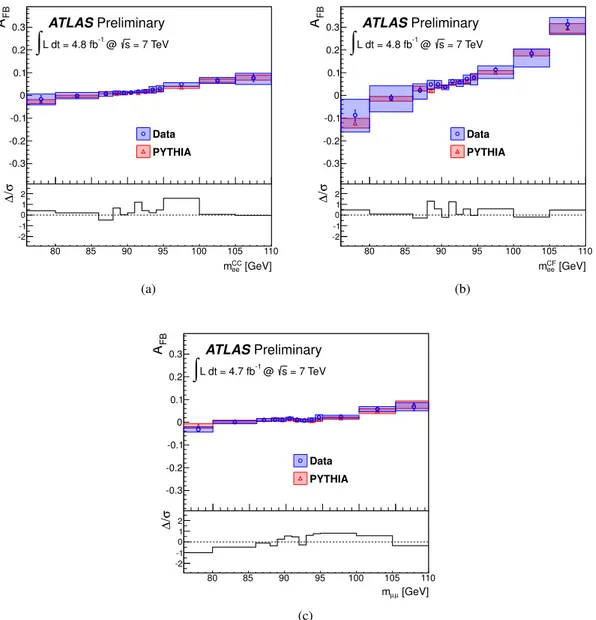
Figure 5: AFBunfolded to Born-level (see text), for the CC electron (a), CF electron (b) and muon (c) channels. For the data, the boxed shaded region represents the total (statistical+systematic) uncertainty and the error bars represent the statistical uncertainty. The boxed shaded regions for the MC represent only the statistical uncertainty. The ratio plots at the bottom of each figure display the distribution of pulls (∆/σ, defined in Fig. 3).
FBA
-0.6 -0.4 -0.2 0 0.2 0.4 0.6 0.8 1 1.2
Data PYTHIA
ATLASPreliminary
= 7 TeV s
-1 @ L dt = 4.8 fb
∫
[GeV]
CC
mee
70 102 2×10² 3×10² 103
σ/∆
-2 -1 0 1 2
(a)
FBA
-0.6 -0.4 -0.2 0 0.2 0.4 0.6 0.8 1 1.2
Data PYTHIA
ATLASPreliminary
= 7 TeV s
-1 @ L dt = 4.8 fb
∫
[GeV]
CF
mee
70 80 90 102 2×10²
σ/∆
-2 -1 0 1 2
(b)
FBA
-0.6 -0.4 -0.2 0 0.2 0.4 0.6 0.8 1 1.2
Data PYTHIA
ATLAS
= 7 TeV s
-1 @ L dt = 4.7 fb
∫
Preliminary
[GeV]
µ
mµ
70 102 2×10² 3×10² 103
σ/∆
-2 -1 0 1 2
(c)
Figure 6: The fully unfolded AFB distributions to Born-level (see text), for the CC electron (a), CF electron (b) and muon (c) channels. For the data, the boxed shaded region represents the total (statis- tical+systematic) uncertainty and the error bars represent the statistical uncertainty. The boxed shaded regions for the MC represent only the statistical uncertainty. The ratio plots at the bottom of each figure display the distribution of pulls (∆/σ, defined in Fig. 3).
These two effects have been combined and are referred to below as higher order (HO) corrections.
The contribution from QCD is larger than the one from EWK by about a factor of four.
• parameterization of the PDFs: a reweighting technique was used to perform a MC-based closure test with respect to different PDF sets. To estimate the uncertainty due to the PDFs, the simu- lated event sample was reweighted to each of the eigenvalues in the CT10 NLO PDF set. These were compared to the central value of the CT10 NLO PDF set and the standard prescription for asymmetric uncertainties was used to calculate the 90% CL uncertainty [30]. This was then cor- rected to 68% CL. Since the analysis used a LO generator,Z/γ∗production viaqginteractions was not considered in the PDF uncertainty. However, there is little difference between the gluon PDF uncertainty and the up-type and down-type quark PDF uncertainties at the scale, µ = 100 GeV.
Therefore, no additional systematic uncertainty was assigned.
• limited statistics of the available Monte Carlo events: the response matrices used in the unfolding were randomly fluctuated (while the input raw AFBwas not), assuming Poisson distributions for the numbers of forward and backwards events. The distribution from data was then unfolded using each of the resulting matrices. For each mass bin, the unfolded AFBvalues were then calculated.
The resulting distribution of values was fit to a Gaussian and the standard deviation was taken as the systematic uncertainty.
• effect of multijet background modeling: the associated uncertainties were discussed in detail in Sec- tion 4.3.
• other experimental systematic uncertainties: these include the effects discussed in detail in Sec- tion 4.3. Pileup affects the electron channel more significantly, because it causes more energy deposition in the calorimeters than in the MS. Misalignment mainly affects the muon channel because the muon reconstruction relies solely on the tracking detectors.
6 Measurement ofsin2θWeff
Measurements of the leptonic effective weak mixing angle, sin2θWeff, have been made using the raw AFBspectra. The value of sin2θWeff was extracted from each of the measured AFBspectra by comparing the raw asymmetry to Monte Carlo predictions produced with varying initial values of the weak mixing angle.
Within the region of interest (0.218 ≤ sin2θWeff ≤ 0.238) a number of MC datasets were generated using PYTHIA with varying values of sin2θWeff, while mZ was kept at the nominal value. From the generator-level information in the datasets, weights were calculated to transform the shape of the fully reconstructed rawAFBspectrum to a newAFBdistribution with a different value of sin2θWeff. The weights were calculated in bins of m`` and cosθCS∗ , and were used to create a series of templates. For each channel, theAFBspectra obtained from the reweighted datasets were compared to the one obtained from the measured data using a χ2 test over the mass range 70-250 GeV. The method has been validated using closure tests on simulated samples. The resulting distribution of χ2 was fit to a parabola. The minimum of the parabola yielded the fit result. Theχ2/ndf for each fit was 0.99 for CC electrons, 1.05 for CF electrons and 1.13 for muons, indicating the data is well described by the PYTHIA templates.
In addition, the fit result was found to be stable with respect to the invariant mass range over which the template comparisons were performed.
All systematic uncertainties on the measured AFB spectra have been propagated to the measure- ments of sin2θWeff, with the exception of the unfolding uncertainty, which was not relevant since the raw AFBspectra were used. For the background uncertainty, a different approach has been followed to obtain