ATLAS-CONF-2017-058 11July2017
ATLAS CONF Note
ATLAS-CONF-2017-058
5th July 2017
Search for heavy Z Z resonances in the `+`−`+`− and `+`−νν¯ final states using proton–proton collisions at √
s = 13 TeV with the ATLAS detector
The ATLAS Collaboration
A search for heavy resonances decaying into a pair of Z bosons leading to`+`−`+`− and
`+`−νν¯final states, where`stands for either an electron or a muon, is presented. The search uses proton–proton collision data at a centre-of-mass energy of 13 TeV corresponding to an integrated luminosity of 36.1 fb−1collected with the ATLAS detector during 2015 and 2016 at the Large Hadron Collider. The mass range of the hypothetical resonances considered is between 200 GeV and 2000 GeV depending on the final state, and the model considered. The results are interpreted as upper limits on the production cross section of a spin-0 or spin-2 resonance. The upper limits for the spin-0 resonance are translated to exclusion contours in the context of Type-I and Type-II two-Higgs-doublet models, while those for the spin-2 resonance are used to constrain the Randall–Sundrum model with an extra dimension giving rise to spin-2 graviton excitations.
© 2017 CERN for the benefit of the ATLAS Collaboration.
Reproduction of this article or parts of it is allowed as specified in the CC-BY-4.0 license.
1 Introduction
In 2012, the ATLAS and CMS collaborations at the LHC discovered a new particle [1,2], an important milestone in the understanding of the mechanism of electroweak (EW) symmetry breaking [3–5]. The experiments have confirmed that the spin, parity and couplings of the new particle are consistent with those predicted for the Standard Model (SM) Higgs boson [6–8] (denoted ashthroughout this paper), measured its mass to bemh =125.09±0.21(stat)±0.11(syst)GeV [9] and reported recently on a combination of measurements of its couplings to other SM particles [10].
One important question is whether the newly discovered particle is part of an extended scalar sector as postulated by various extensions to the Standard Model such as the two-Higgs-doublet model (2HDM) [11].
These models predict additional Higgs bosons, motivating searches in an extended range of mass.
This paper reports on two searches for a heavy resonance decaying into two SMZbosons, encompassing the final states Z Z →`+`−`+`− and Z Z →`+`−νν¯ where ` stands for either an electron or a muon andν stands for all three neutrino flavours. These final states are referred to as`+`−`+`− and`+`−νν¯ respectively.
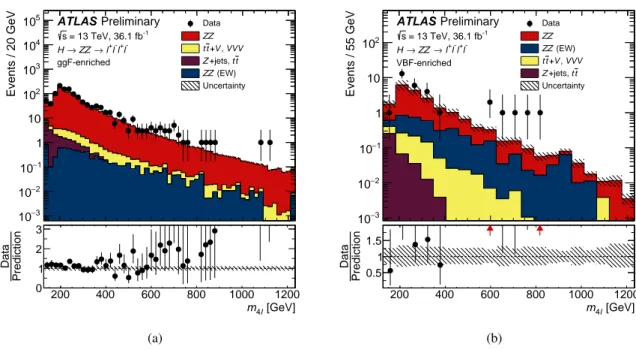
It is assumed that an additional Higgs boson would be produced predominantly via gluon fusion (ggF) and vector boson fusion (VBF) processes, but that the ratio of the two production mechanisms is unknown in the absence of a specific model. For this reason, the results are interpreted separately for ggF and VBF production modes, with events being classified into ggF- and VBF-enriched categories in both final states, as discussed in Sections5and6. With good mass resolution and high signal-to-background ratio, the`+`−`+`−final state is well-suited to search for a narrow resonance with massmH between 200 GeV and 1200 GeV. The`+`−νν¯ search covers the 300 GeV< mH <1400 GeV range and dominates at high masses due to its larger branching ratio.
These searches look for an excess in the four–lepton invariant mass,m4`, for the`+`−`+`−final state, and the transverse invariant mass,mT, for`+`−νν¯ final state, as the escaping neutrinos do not allow the full reconstruction of the final state. ThemTis defined as:
mT≡ vu t
r
m2Z+ p``
T
2 +
r m2Z+
Emiss
T
2
2
−
~
pT``+E~miss
T
2
(1) wheremZ is the mass of the Z boson, p``
T is the transverse momentum of the lepton pair, E~miss
T is the missing transverse momentum andEmiss
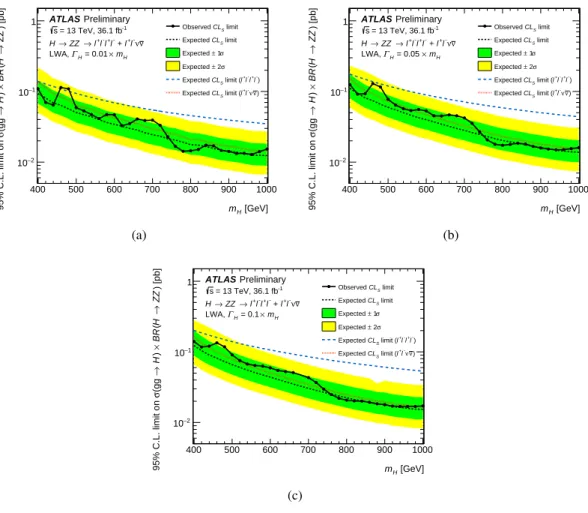
T is the missing transverse momentum magnitude. In the absence of such excess, limits on the production rate of different signal hypotheses are obtained from a simultaneous likelihood fit to the two mass distributions. The first hypothesis is the ggF and VBF production of a heavy Higgs boson (spin-0 resonance) under the Narrow Width Approximation (NWA). The upper limits on a heavy Higgs boson are then translated into exclusion contours in the context of the two-Higgs-doublet model. As several theoretical models favour non-negligible natural widths, Large Width Assumption (LWA) models, widths of 1%, 5% and 10% of the resonance mass are also studied. The interference between the heavy scalar and the SM Higgs boson as well as the heavy scalar and thegg→Z Zcontinuum background are taken into account in this study. Limits are also set on the Randall–Sundrum (RS) model [12, 13] with a warped extra dimension giving rise to a spin-2 graviton excitation GKK. The results of this paper extend previous results published by the ATLAS collaboration on the search for an additional heavy Higgs boson [14] performed with the LHC data collected at centre-of-mass energy of
√s= 8 TeV.
Similar results on the data collected at the LHC with
√s = 8 TeV have also been reported by the CMS
2 ATLAS detector
The ATLAS experiment is described in detail in Ref. [16]. ATLAS is a multi-purpose detector with a forward–backward symmetric cylindrical geometry and a solid angle1coverage of nearly 4π. The inner tracking detector (ID), covering the region|η| <2.5, consists of a silicon pixel detector, a silicon microstrip detector and a transition radiation tracker. The innermost layer of the pixel detector, the insertable B-layer (IBL) [17], was installed between Run 1 and Run 2 of the LHC. The inner detector is surrounded by a thin superconducting solenoid providing a 2 T magnetic field, and by a finely segmented lead/liquid- argon (LAr) electromagnetic calorimeter covering the region|η| <3.2. A steel/scintillator-tile hadronic calorimeter provides coverage in the central region|η|<1.7. The end-cap and forward regions, covering the pseudorapidity range 1.5 < |η| < 4.9, are instrumented with electromagnetic and hadronic LAr calorimeters, with steel, copper or tungsten as the absorber material. A muon spectrometer (MS) system incorporating large superconducting toroidal air-core magnets surrounds the calorimeters. Three layers of precision wire chambers provide muon tracking in the range|η| <2.7, while dedicated fast chambers are used for triggering in the region|η| <2.4. The trigger system, composed of two stages, was upgraded [18]
before Run 2. The Level-1 trigger system, implemented with custom hardware, uses information from calorimeters and muon chambers to reduce the event rate from about 40 MHz to a maximum of 100 kHz.
The second stage, called the High-Level Trigger (HLT), reduces the data acquisition rate to about 1 kHz on average. The HLT is software–based and runs reconstruction algorithms similar to those used in the offline reconstruction.
3 Data and Monte Carlo samples
The proton–proton (pp) collision data used in these searches were collected by the ATLAS detector at a centre-of-mass energy of 13 TeV with a 25 ns bunch spacing configuration during 2015 and 2016. The data are subjected to quality requirements: if any relevant detector component is not operating correctly during a period in which an event is recorded, the event is rejected. After these quality requirements, the total accumulated data sample corresponds to an integrated luminosity of 36.1 fb−1.
Simulated events are used to determine signal acceptance and some of the background contributions to these searches. The particle-level events produced by each event generator are processed through the ATLAS detector simulation [19] within the Geant 4 framework [20]. Additionalppinteractions in the same or nearby bunch crossings (pile-up) are simulated using inelasticppcollisions and overlaid on the simulated events. The Monte Carlo (MC) generator used for this is Pythia 8.212 [21] with either the A14 [22] set of tuned parameters and NNPDF23 [23] for the parton density functions (PDF) set, or the AZNLO [24] tuned parameters and CTEQL1 [25] PDF when the Powheg-Box [26,27] generator is used for the hard process. The simulated events are weighted to reproduce the observed distribution of the mean number of interactions per bunch crossing in the data (pile-up reweighting). The properties of the bottom and charm hadron decays are simulated by the EvtGen v1.2.0 program [28].
Heavy spin-0 resonance production is simulated using the Powheg-Box MC event generator with the Higgs mass parameter set to the heavy resonance mass. Gluon fusion and vector boson fusion production modes
1The ATLAS experiment uses a right-handed coordinate system with its origin at the nominal interaction point (IP) in the centre of the detector and thez-axis along the beam pipe. Thex-axis points from the IP to the centre of the LHC ring, and the y-axis points upward. Cylindrical coordinates(r, φ)are used in the transverse plane,φbeing the azimuthal angle around the z-axis. The pseudorapidity is defined in terms of the polar angleθasη=−ln tan(θ/2).
are calculated separately with matrix elements up to next-to-leading order (NLO) in QCD. Powheg- Box is interfaced to Pythia 8.212 for decaying the Higgs boson into the H → Z Z →`+`−`+`− or H→Z Z→`+`−νν¯ final states. The CT10 [29] PDF set is used for the hard process. Events from ggF and VBF production are generated separately in the 300< mH <1600 GeV mass range under the NWA, using a step of 100 (200) GeV up to (above) 1000 GeV in mass. For the`+`−`+`−final state, due to the sensitivity of the analysis at lower masses, events are also generated for mH = 200 GeV. In addition, events from ggF production with a width of 5%, 10% and 15% of the scalar massmH are generated with MadGraph5_aMC@NLO [30] for both final states. For the`+`−`+`−final state, them4` distribution is parametrised analytically as described in Section5.3, and the samples with a width of 15% ofmH are used to validate the parametrisation. For the`+`−νν¯ final state, a reweighing procedure as described in Section6.3is used on fully simulated events to obtain the reconstructedmT distribution at any value of mass and width tested. To have a better description of the jet multiplicity, MadGraph5_aMC@NLO is also used to generate events for the process pp → H+ ≥ 2jets at NLO QCD accuracy with the FxFx merging scheme [31]. The fraction of the ggF events that enter into the VBF-enriched category is estimated from the MadGraph5_aMC@NLO simulation.
Bulk Randall-Sundrum graviton events are generated with MadGraph5_aMC@NLO at leading order (LO) in QCD. The dimensionless coupling k/M¯Pl, where ¯MPl = MPl/√
8πis the reduced Planck scale andk is the curvature scale of the extra dimension, is set to 1.0. In this configuration, the width of the resonance is expected to be∼ 6% of its mass. Mass points between 600 GeV and 2 TeV with 200 GeV spacing are generated for the`+`−νν¯ final state. These samples are produced with a fast simulation that uses a parametrisation of the response of electromagnetic and hadronic calorimeters.
Theqq¯ →Z Zbackground for the`+`−νν¯ final state is simulated by the Powheg-Box v2 generator [32], interfaced to the Pythia 8.186 [33] parton shower model. The CT10nlo [29] PDF set is used for hard scattering processes. Next-to-next-to-leading-order (NNLO) QCD and NLO electroweak (EW) corrections are included [34–37] as a function of the invariant mass of the Z Z system mZ Z. For the
`+`−`+`− final state, this background is simulated with the Sherpa 2.2 [38–40] generator, with the NNPDF3.0 [41] NNLO PDF set for the hard scattering process. NLO accuracy is achieved in the matrix element calculation for 0-, and 1-jet final states and LO accuracy for 2- and 3-jet final states. The merging is performed with the Sherpa parton shower [42] using the MePs@NLO prescription [43]. NLO EW corrections are applied as a function ofmZ Z[36,44]. In addition, Sherpa 2.2 is used for the`+`−νν¯final state to scale the fraction of events in the VBF-enriched category obtained from Powheg-Box simulation, because the Sherpa generator calculates matrix elements up to one parton at NLO and up to three partons at LO. The EW production of the vector boson scattering with two jets down toO(α6W)is generated using Sherpa, where the processZ Z Z →4`qqis also taken into account.
Thegg → Z Zproduction is modelled by Sherpa 2.2 at LO in QCD for the`+`−`+`−final state and by gg2VV [45] for the `+`−νν¯ final state, both including the off-shellh contribution and the interference between the h and the Z Z background. The k-factor accounting for higher order QCD effects for the gg → Z Z continuum production is calculated for massless quark loops [46,47] in the heavy top-quark approximation [48], including the gg → H∗ → Z Z process [49]. Based on these studies, a constant k- factor of 1.7 is used, and a relative uncertainty of 60% on the normalisation is applied to both searches.
The W W and W Z diboson events are simulated by Powheg-Box, using the CT10nlo PDF set and Pythia 8.186 for parton showering.
Events containing Z bosons with associated jets are simulated using the Sherpa 2.2 generator. Matrix elements are calculated for up to two partons at NLO and four partons at LO using the Comix [39] and
OpenLoops [40] matrix element generators and merged with the Sherpa parton shower [42] using the ME+PS@NLO prescription [43]. The NNPDF3.0 NNLO PDF set is used in conjunction with dedicated parton shower tuning developed by the Sherpa authors. TheZ + jets events are normalised to the NNLO cross sections [50].
The tri-boson backgroundsZ Z Z,W Z Z, andW W Zwith four or more prompt leptons are modelled using Sherpa 2.1. For the fully leptonict¯t+ Z background, with four prompt leptons originating from the top-quark and Z-boson decays, MadGraph5_aMC@NLO is used. The t¯t background as well as the single top andW tproduction, is modelled using Powheg-Box v2 interfaced to Pythia 6 [51] for parton shower and hadronisation, to PHOTOS [52] for QED radiative corrections and to Tauola [53,54] for the simulation ofτlepton decays.
In order to study the interference treatment for the LWA case, samples containing thegg→Z Zcontinuum background (B) as well as its interference (I) with a hypothetical heavy scalar (S) have been used and are referred to as SBI samples hereafter. In the`+`−`+`− final state the MCFM [55] NLO generator, interfaced to Pythia 8.212 for parton showering and hadronisation is used, to produceSBIsamples where the width of the heavy scalar is set to 15% of its mass, for masses of 200, 300, 400, 500, 600, 800, 1000, 1200 and 1400 GeV. Background-only samples are also generated with the MCFM generator, and are used to extract the signal plus interference term (SI) by subtracting them from the aforementioned SBI samples. For the`+`−νν¯ final state, theSBI samples were generated with the gg2VV generator. The samples include signal events with a scalar mass of 400, 700, 900, 1200 and 1500 GeV.
4 Object reconstruction
Electrons are reconstructed using information from the ID and the electromagnetic calorimeter [56]. Elec- tron candidates are clusters of energy associated with ID tracks, where the final track-cluster matching is performed after the tracks have been fitted with a Gaussian-sum filter (GSF) to account for bremsstrahlung energy losses. Background rejection relies on the longitudinal and transverse shapes of the electromag- netic showers in the calorimeters, track-cluster matching and properties of tracks in the ID (e.g. hit requirement in the IBL). All of this information, except for the one related to track hits, is combined into a likelihood discriminant. The selection used combines the likelihood with the number of track hits and defines two working points (WP) which are used in the analyses presented here. The`+`−`+`−analysis uses a “loose” WP, with an efficiency ranging from 90% for transverse energypT = 20 GeV to 96% for pT > 60 GeV. A “medium” WP has been chosen for the `+`−νν¯ analysis with an efficiency increasing from 82% atpT =20 GeV to 93% forpT >60 GeV. The electron transverse energy is computed from the cluster energy and the track direction at the interaction point.
Muons are formed from tracks reconstructed in the ID and MS, and their identification is primarily based on the presence of the track or track segment (tag) in the MS [57]. If the ID and MS full track information is present, a combined muon track is formed by a global fit using the hit information from both the ID and MS detectors (combined muon), otherwise the momentum is measured using the ID, and the partial MS track serves as identification (segment-tagged muon). The segment-tagged muon is limited to the centre of the barrel region (|η| <0.1) which has reduced MS geometrical coverage. Furthermore in this central region, an ID track withpT > 15 GeV is identified as a muon if its calorimetric energy deposition is consistent with a minimum ionising particle (calorimeter-tagged muon). In the forward region (2.5 < |η| < 2.7) with limited or no ID coverage, the MS track is either used alone (standalone muon) or combined with silicon hits, if found in the forward ID (combined muon). The ID tracks associated with the muons are
required to have a minimum number of associated hits in each of the ID sub-detectors to ensure good track reconstruction. The standalone muon candidates are required to have hits in each of the three MS stations they traverse. A “loose” muon identification WP, which uses all muon types and has an efficiency of 98.5%, is adopted by the`+`−`+`−analysis. For the`+`−νν¯ analysis a “medium” WP is used, which only includes combined muons and has an efficiency of 97%.
Jets are reconstructed using the anti-ktalgorithm [58] with a radius parameter R = 0.4, and positive-energy clusters of calorimeter cells as input. The algorithm suppresses noise and pile-up by keeping only cells with a significant energy deposit and their neighbouring cells. Jets are calibrated using a dedicated scheme designed to adjust, on average, the energy measured in the calorimeter to that of the true jet energy [59].
The jets used in this analysis are required to satisfypT >20 GeV and|η| <4.5. To reduce the number of jet candidates originating from pile-up vertices, jets withpT < 60 GeV and|η| <2.4 are required to pass the jet vertex tagger selection [60].
Jets containingb-hadrons, referred to as b-jets, are identified by the long lifetime, high mass and decay multiplicity of b-hadrons, as well as the hard b-quark fragmentation function. The `+`−νν¯ analysis identifiesb-jets ofpT >20 GeV and|η| < 2.5 using an algorithm that achieves an identification efficiency of about 85% in simulatedtt¯events, with a rejection factor for light flavour jets of about 33 [61,62].
The missing transverse momentum E~miss
T , which accounts for the imbalance of visible momenta in the plane transverse to the beam axis, is computed as the negative vector sum of the transverse momenta of all identified physics objects (electrons, muons, jets) as well as a “soft term”, accounting for unclassified soft tracks and energy clusters in the calorimeters [63]. The presented analysis uses a track-based “soft term”, which is built combining the information provided by the ID and the calorimeter, in order to minimise the effect of pile-up which causes a degradation of theEmiss
T performance. The “soft term” is computed using the momenta of the tracks associated to the primary vertex, while the momenta of the hard objects are computed at the calorimeter level to allow the inclusion of neutral particles. Jet-muon overlap handling is enabled in theEmiss
T calculation. This corrects for fake jets due to pile-up close to muons and double counted jets from muon energy losses.
Selected events are required to have at least one vertex with two associated tracks withpT>400 MeV, and the primary vertex is chosen to be the vertex reconstructed with the largestP
p2
T. As different objects can be reconstructed from the same detector information, an overlap ambiguity resolution is applied. For an electron and a muon which share the same ID track, the muon is selected except for a calorimeter-tagged muon which does not have a MS track, or a segment tagged muon, in which case the electron is selected.
The reconstructed jets which overlap with electrons (muons) in a cone of size∆R ≡p
(∆η)2+(∆φ)2 <
0.2(0.1) are removed.
5 H→Z Z→`+`−`+`− event selection and background estimation
5.1 Event selection
Four-lepton events are selected and initially classified according to the lepton flavours: 4µ, 2e2µ, 4e calledchannelshereafter. They are selected with single-lepton, di-lepton and tri-lepton triggers, with the di-lepton and tri-lepton ones including electron(s)-muon(s) triggers. Single-electron triggers apply “me- dium” and “tight” likelihood identification, whereas multi-electron triggers apply “loose” and “medium”
identification. For the bulk of the data, recorded in 2016, the lowestp threshold for the single-electron
(muon) triggers used is set to 26 (26) GeV, for the di-electron (muon) triggers to 15 (10) GeV and for the tri-electron (muon) triggers to 12 (6) GeV. For the data collected in 2015, the instantaneous luminosity was lower so the trigger thresholds were lower; this increases the signal efficiency by less than 1%. Globally, the trigger efficiency for signal events passing the final selections is about 98%.
Four-lepton candidates are formed by selecting in each channel, a lepton-quadruplet made out of two same-flavour, opposite-sign lepton pairs, selected as described in Section4. Each electron (muon) must satisfypT >7 (5) GeV and be measured in the pseudorapidity range of|η|< 2.47 (|η| <2.7). The highest- pT lepton in the quadruplet must satisfy pT > 20 GeV, and the second (third) lepton in pT order must satisfypT>15 GeV (pT> 10 GeV). In case of muons, at most one calorimeter-tagged or segment-tagged muon or a muon in the forward region (2.5< |η| < 2.7) is allowed per quadruplet.
In case of ambiguity in the lepton-to-pair assignment, only one quadruplet per channel is selected by keeping the quadruplet with the lepton pairs closest (leading pair) and second closest (sub-leading pair) to the Z boson mass, with invariant masses referred to as m12 and m34 respectively. In the selected quadruplet, the m12 is required to be 50 < m12 < 106 GeV, while the m34 is required to be less than 115 GeV and greater than a threshold, that is 12 GeV form4` ≤ 140 GeV, rises linearly from 12 to 50 GeV withm4`in the interval of [140 GeV, 190 GeV] and is fixed to 50 GeV form4` >190 GeV.
Selected quadruplets are required to have their leptons separated by∆R> 0.1 from each other if they are of the same flavour and∆R >0.2 otherwise. For 4µand 4equadruplets, if an opposite-charge same-flavour lepton pair is found withm``below 5 GeV, the quadruplet is removed to suppress the contamination from J/ψ.
The Z + jets andt¯t background contributions are reduced by applying impact parameter requirements as well as track- and calorimeter-based isolation requirements on the leptons. The transverse impact parameter significance, defined as the impact parameter calculated with respect to the measured beam line position in the transverse plane divided by its uncertainty,|d0|/σd0, for all muons (electrons) is required to be lower than 3 (5). The normalised track isolation discriminant, defined as the sum of the transverse momenta of tracks, inside a cone of size∆R=0.3(0.2)around the muon (electron) candidate excluding the lepton track, divided by the leptonpT, is required to be smaller than 0.15. The larger muon cone size corresponds to that used by the muon trigger. Contributions from pile-up are suppressed by requiring tracks in the cone to originate from the primary vertex. To retain efficiency at higherpT, the track isolation cone size is reduced linearly by 10 GeV/pTfor pT above 33 (50) GeV for muons (electrons).
The relative calorimetric isolation is computed as the sum of the cluster transverse energies ET, in the electromagnetic and hadronic calorimeters, with a reconstructed barycentre inside a cone of size∆R=0.2 around the candidate lepton, divided by the leptonpT. The clusters used for the isolation are the same as those for reconstructing jets. The relative calorimetric isolation is required to be smaller than 0.3 (0.2) for muons (electrons). The measured calorimeter energy around the muon (inside a cone of size∆R= 0.1) and the cells within 0.125×0.175 inη×φaround the electron barycentre are excluded from the respective sums. The pile-up and underlying event contribution to the calorimeter isolation is subtracted event by event [64]. For both the track- and calorimeter-based isolation requirements any contribution arising from other leptons of the quadruplet is subtracted.
An additional requirement based on a vertex-reconstruction algorithm, which fits the four-lepton candidates under the assumption that they originate from a common vertex, is applied in order to reduce further the Z+jets andtt¯background contributions. A loose cut of χ2/ndof< 6 for 4µand<9 for the other channels is applied, which retains a signal efficiency larger than 99% in all channels.
The QED process of radiative photon production inZboson decays is well modelled by simulation. Some of the final-state radiation (FSR) photons can be identified in the calorimeter and incorporated into the
`+`−`+`−analysis. The strategy to include FSR photons into the reconstruction ofZ bosons is the same as in Run 1 [14]. It consists of a search for collinear (for muons) and non-collinear FSR photons (for both muons and electrons) with only one FSR photon allowed per event. After the FSR correction, the lepton four-momenta of both dilepton pairs are recomputed by means of aZ-mass-constrained kinematic fit. The fit uses a Breit-WignerZ line shape and a single Gaussian per lepton to model the momentum response function with the Gaussian width set to the expected resolution for each lepton. TheZ-mass constraint is applied to bothZcandidates, and improves them4`resolution by about 15%.
In order to be sensitive to the VBF production mode, events are classified into four categories: one for the VBF production mode and three for the ggF production mode based on the three channels. If an event has two or more jets with pT greater than 30 GeV, with the two leading jets being well separated inη,∆ηjj > 3.3, and having a large invariant massmjj,mjj > 400 GeV, this event is classified into the VBF-enriched category; otherwise the event is classified into one of the ggF-enriched categories. Such classification is used only in the search for a heavy scalar produced with the NWA.
The signal acceptance, defined as the ratio of the number of reconstructed events passing the analysis requirements to the number of simulated events in each category, is shown in Table1, for the ggF and VBF production modes as well as different resonance masses. The contribution from final states withτ leptons decaying to electrons or muons is found to be negligible.
Table 1: The signal acceptance for the`+`−`+`−analysis, for both the ggF and VBF production modes and resonance masses of 300 and 600 GeV. The acceptance is defined as the ratio of the number of reconstructed events after all selection requirements to the number of simulated events for each channel/category.
Mass Production mode ggF-enriched categories
VBF-enriched category 4µchannel 2e2µchannel 4echannel
300 GeV ggF 56% 48% 40% 1%
VBF 36% 30% 24% 21%
600 GeV ggF 64% 56% 48% 3%
VBF 36% 34% 32% 26%
5.2 Background estimation
The main background component in the H →Z Z→`+`−`+`− final state, accounting for 97% of the total expected background events, is the non-resonantZ Z production. This arises from quark-antiquark annihilation (86%), gluon-gluon induced production (10%) and a small contribution from EW vector boson scattering (1%). The latter is more important in the VBF-enriched category, where is accounts for 16% of the total expected background. These backgrounds are all modelled by MC simulation as described in Section3. Additional background comes from theZ+ jets andt¯tprocesses, which contribute at the percent level and decrease more rapidly than the non-resonantZ Zproduction as a function ofm4`. These backgrounds are estimated using data where possible, following slightly different approaches for final states with a di-muon (``+µµ) or a di-electron (``+ee) sub-leading pair [65].
The``+ µµnon-Z Zbackground is comprised of mostlyt¯t andZ + jets events, where in the latter case the muons arise mostly from heavy-flavour semileptonic decays and to a lesser extent fromπ/K in-flight decays. The contribution from single-top production is negligible. The normalisations for the Z + jets andtt¯backgrounds are determined using fits to the invariant mass of the leading lepton pair in dedicated data control regions. The control regions are formed by relaxing theχ2requirement on the vertex fit, and by inverting and relaxing isolation and/or impact-parameter requirements on the subleading muon pair.
An additional control region (eµµµ) is used to improve thet¯t background estimate. Transfer factors to extrapolate from the control regions to the signal region are obtained separately fortt¯andZ + jets using simulated events.
The main background in the ``+ ee process arises from the misidentification of light-flavour jets as electrons, photon conversions and the semi-leptonic decays of heavy-flavour hadrons. The``+eecontrol- region selection requires the electrons in the subleading lepton pair to have the same charge, and relaxes the identification and isolation requirements on the electron candidate, denotedX, with the lowest transverse momentum. The heavy-flavour background is completely determined from simulation, whereas the light- flavour and photon conversion background is obtained with the sPlot [66] method, based on a fit to the number of hits in the innermost ID layernIBL in the data control region. Transfer factors for the light- flavour jets and converted photons, obtained from simulated samples, are corrected using aZ+Xcontrol region and then used to extrapolate the extracted yields to the signal region. Both the yield extraction and the extrapolation are performed in bins of the transverse momentum of the electron candidate and the jet multiplicity.
TheW Z production is included in the data-driven estimates for the``+eefinal states, while it is added from simulation for the``+ µµfinal states. The contributions fromt¯tV (whereV stands for either aW or aZboson) and tri-boson processes are minor and taken from simulated samples.
5.3 Signal and background modelling
The parametrisation of the reconstructed four-lepton invariant massm4` distribution for signal and back- ground is based on the MC simulation and afterwards used to fit the data.
In the case of a narrow-width resonance, the width inm4`is determined by the detector resolution, which can be modelled by the sum of a Crystal Ball (CB) function [67,68] and a Gaussian (G):
Ps(m4`) = fC B× CB(m4`;µ, σC B, αC B,nC B)+(1− fC B)× G(m4`;µ, σG).
TheCBand the Gaussian function share the same peak value ofm4`(µ), but acquire different parameters for the resolution, σC B and σG. The αC B andnC B parameters control the shape and position of the non-Gaussian tail and the parameter fC Bensures the relative normalisation of the two probability density functions. To improve the stability of the parametrisation in the full mass range considered, the parameter nC B is set to constant. The bias on the extraction of signal yields introduced by using the analytical function is below 1.5%. The function parameters are determined separately for each final state using signal simulation, and fitted to first- and second-degree polynomials in scalar mass mH to interpolate between the generated mass points. The use of this parametrisation for the function parameters introduces an extra bias on the signal yield andmH extraction of about 1%. An example of this parametrisation is illustrated in Figure1, where the left plot shows the mass distribution for simulated samples at mH
=300,600,900 GeV and the right plot shows the RMS of them4`distribution in the range considered for this search.
[GeV]
l
m4
200 300 400 500 600 700 800 900 1000
Arbitrary Units
−3
10
−2
10
−1
10
Simulation Preliminary ATLAS
,fb-1
= 13 TeV s
µ-
µ+
e-
+ e+
e-
e+
µ-
µ+
Simulation
Parametrization
(a)
[GeV]
mH
200 400 600 800 1000 1200 1400
distribution [GeV]l4mRMS of
0 10 20 30 40 50 60 70
Simulation Preliminary ATLAS
,fb-1
= 13 TeV s
l-
l+
l-
l+
→
→ZZ H
µ-
µ+
µ-
µ+
µ-
µ+
e-
+ e+
e-
e+
µ-
µ+
e-
e+
e-
e+
(b)
Figure 1: (a)Parametrisation of the four-lepton invariant mass (m4`) spectrum for various resonance mass (mH) hypotheses in the NWA. Markers show the simulatedm4` distribution for three specific values of mH (300, 600, 900 GeV) and the dashed lines show the parametrisation used in the`+`−`+`−final state for these mass points as well as for intervening ones.(b)RMS of the four-lepton invariant mass distribution as a function ofmH.
In the case of LWA, the particle-level line-shape of m4` is derived from a theoretical calculation, as described in Ref. [69], and then is convolved with the detector resolution, using the same procedure as for the modelling of the narrow-width resonance.
Them4` distribution for the Z Zcontinuum background is taken from MC simulation, and parametrised by an empirical function for both the quark- and gluon-induced processes:
fqqZ Z/ggZ Z(m4`) =(f1(m4`)+ f2(m4`))×H(m0−m4`)×C0+ f3(m4`)×H(m4`−m0) (2) where:
f1(m4`) =exp(a1+a2·m4`), f2(m4`) =
(1 2+ 1
2erf m4`−b1 b2
! )
× 1
1+exp(m4`b−b1
3 ), f3(m4`)=exp(c1+c2·m4`+c3·m2
4`+c4·m2.7
4`), C0= f3(m0)
f1(m0)+ f2(m0).
(3)
The first part of the function f1 covers the low mass part of the spectrum where one of the Z bosons is off-shell, while f2 models the Z Z threshold around 2·mZ and f3 describes the high mass tail. The transition between low mass and high mass parts is performed by the Heaviside step functionH(x)around m0 = 240 GeV. The continuity of the function around them0is ensured by the normalisation factorC0 that is applied to the low mass part. Finally, ai, bi and ci are shape parameters which are obtained by fitting them4`distribution in simulation for each category. The uncertainties on these parameters from the fitting are found negligible. The MC statistical uncertainties on the high mass tail are taken into account by introducing 1% uncertainty onc4.
Them4` shapes are extracted from simulation for most background components (t¯tV,V V V,``+µµand heavy-flavour hadron component of the``+ee), except for the light-flavour jets and photon conversions in the case of``+eebackground, which is taken from the control region as described in section5.2.
5.3.1 Interference modelling
The gluon-initiated production of a heavy scalarH, the SMhand thegg → Z Zcontinuum background all share the same initial and final state, and thus lead to interference terms in the total amplitude.
Theoretical calculations described in Ref. [70] have shown that the effect of the interference could modify the integrated cross section by up toO(10%), and this effect is enhanced as the width of the heavy scalar increases. Therefore a search for a heavy scalar Higgs boson in the LWA case must properly account for two interference effects: the interference between the heavy scalar and the SM Higgs boson (denoted as H–h) and between the heavy scalar and thegg→Z Zcontinuum (denoted asH–B).
Assuming thatHandhhave similar properties, they have the same production and decay amplitudes and therefore the only difference in the signal and interference term in the production cross section comes from the propagator. Hence, the acceptance and resolution of the signal and interference terms are expected to be the same. TheH–hinterference is obtained by reweighting the particle-level line-shape of generated signal events using the following formula:
w(m4`)= 2·Ref
s−s1H · (s−s1
h)∗
g
1
|s−sH|2
(4) where s−s1H(h) is the propagator for a scalar (Horh). The particle-level line-shape is then convolved with the detector resolution function and the acceptance of the signal and the interference is assumed to be the same.
In order to extract theH–Binterference contribution, signal-only and background-only samples have been subtracted from the generated SBI samples. The extracted particle-level m4` distribution for the H–B interference term is then convolved with the detector resolution.
Figure 2shows the overlay of the signal, both interference effects and the total line-shape for different mass and width hypotheses assuming the SM-like couplings for the heavy Higgs boson. As it can be seen, the two interference effects tend to cancel out, and the total interference yield is for the most part positive, enhancing the signal.
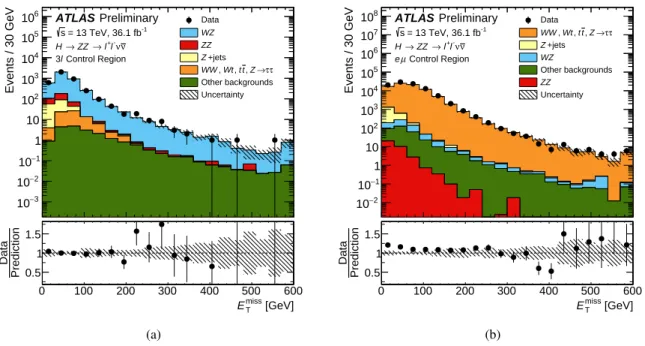
6 H→Z Z→`+`−νν¯ event selection and background estimation
6.1 Event selection
The analysis is designed to select Z Z→`+`−νν¯ events (with` = e, µ), where the missing neutrinos are identified by a largeEmiss
T , and to discriminate against the largeZ+ jets,W Zand top-quark backgrounds.
Events are required to pass either a single electron or muon trigger, where differentpTthresholds are used depending on the instantaneous luminosity of the LHC. For the 2015 data the electron and muon triggers havepTthresholds of 24 and 20 GeV respectively, while for 2016 the muon trigger threshold is increased