ATLAS-CONF-2016-001 01February2016
ATLAS NOTE
ATLAS-CONF-2016-001
1st February 2016
Calibration of ATLAS b-tagging algorithms in dense jet environments
The ATLAS Collaboration
Abstract
This note describes the calibration of various ATLAS b-tagging algorithms using recon- structed t t ¯ candidate events in the final state of one charged lepton, missing transverse mo- mentum, and at least four jets, in the ATLAS
√s
=8 TeV pp collision data sample. Ex- panding on previous b-tagging calibration studies, the b-tagging efficiencies are measured not only as a function of the transverse momentum or the pseudorapidity of the jets, but also as a function of quantities that are sensitive to close-by jet activity. The results measured in data are in good agreement with the predictions from simulation.
c Copyright 2016 CERN for the benefit of the ATLAS Collaboration.
Reproduction of this article or parts of it is allowed as specified in the CC-BY-3.0 license.
1 Introduction
The calibration of b-tagging algorithms using top quark pair events as standard candles is well estab- lished [1, 2] and the b-tagging efficiencies have been measured with a variety of different methods. The most precise measurements are obtained using a combinatorial likelihood approach applied to t t ¯ dilep- ton events [2] resulting in total uncertainties below 2% for jets with a transverse momentum of about 100 GeV. However, the focus of the Run II of the LHC is shifted towards event topologies contain- ing highly boosted objects leading to dense environments, possibly involving several close-by or even merged jets. Therefore, a measurement of the b-tagging efficiencies is required not only as a function of the jet transverse momentum p
T 1and pseudorapidity
η, but also as a function of quantities that aresensitive to a merging of several partons from the hard interaction into one single jet.
The performance of the various b-tagging algorithms used in ATLAS degrade strongly in dense en- vironments (e.g. in boosted t
→bW
→bq q ¯ decays) [3]. One of the main reasons for a reduction of the b-tagging performance is a shifting of the jet axis farther away from the flight direction of the corre- sponding b-hadron (quantified by
∆R(b−hadron, jet)). This jet axis shift is caused by additional activity in the calorimeter clusters next to those stemming from the b-jet. This note describes the calibration of the MV1 [4] and the MVb algorithms [3] as a function of variables sensitive to such effects. The latter tagger was developed recently to improve the identification of b-jets in the dense environments of boosted t
→bW
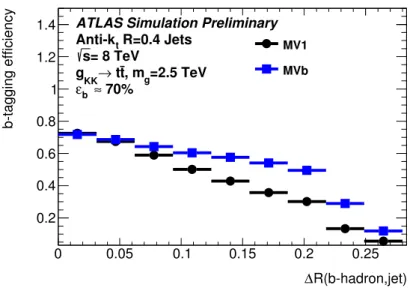
→bq q ¯ decays. The b-tagging efficiencies of the MV1 and MVb algorithms are shown in Figure 1 as a function of the
∆R(b−hadron, jet). Both efficiency curves are extracted from a jet sample obtained from events including the production of a hypothetical high mass resonance, referred to as Kaluza-Klein gluon
gKKthat decays via
gKK →t¯ t. The corresponding events are produced with a KK-gluon mass of 2.5 TeV [5, 6] using the MadGraph5 v1.3.33 generator [7]. The performance of the two taggers is very similar for a given working point if the alignment between the b-hadron and the jet is perfect. The performance of both taggers decreases for increasing values of the angular separation between the b-hadron and the jet. The loss of efficiency is much more significant for MV1 compared to MVb, which has a substantially higher b-tagging efficiency in this region.
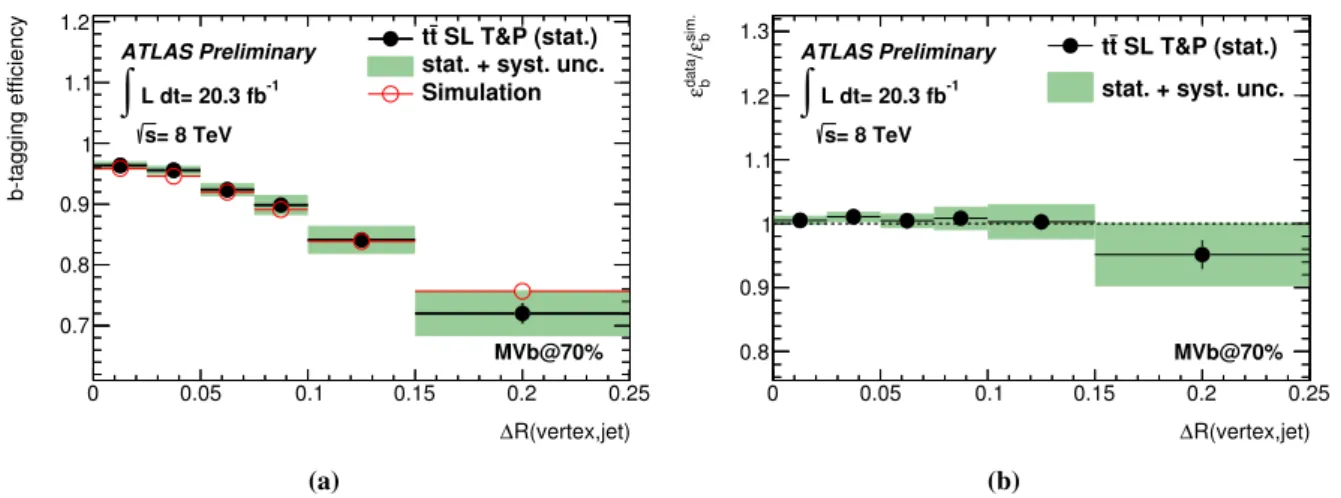
The purpose of this note is to probe whether the performance loss predicted by the simulation reflects that in the data. If a secondary vertex is reconstructed within a jet, the direction of the line joining the primary and secondary vertex candidates can be used as an approximation for the b-hadron flight direction, to define a similar quantity
∆R(vertex,jet), without relying on generator level information. A further quantity that is appropriate for b-tagging calibration in crowded jet environments is the angular separation between the jet under study (probe jet) and its nearest neigbouring jet
∆Rmin. This quantity has the advantage that it does not require any b-tagging based information (for example, the presence of a secondary vertex) in order to be calculated.
The calibration results are presented as data-to-simulation efficiency scale factors
κ = εdatab /εsim.bmeasured as a function of the p
T,
η, ∆R(vertex,jet), and
∆Rminof the selected probe jets. For this purpose a b-jet enriched sample is used that is obtained from selected t t ¯ candidate events with a final state containing exactly one single charged lepton (SL) and at least four jets. Although the dileptonic t t ¯ based calibration methods have previously proven to provide more precise calibration results, they are not suited for these studies due to the relatively low jet multiplicities contained in t t ¯ dilepton events.
Previous attempts to measure the b-tagging efficiencies and the corresponding data-to-simulation scale factors using semileptonic t t ¯ candidate events are documented in detail in Reference [1]. Two such
1ATLAS uses a right-handed coordinate system with its origin at the nominal interaction point in the centre of the detector and thez-axis along the beam pipe. Thex-axis points from the interaction point to the centre of the LHC ring, and they-axis points upward. The pseudorapidityηis defined asη=−ln[tan(θ/2)], where the polar angleθis measured with respect to the LHC beam-line. Cylindrical coordinates (r, φ) are used in the transverse plane,φbeing the azimuthal angle around the beam pipe. Transverse momentum and energy are defined aspT =psinθandET=Esinθ, respectively. The angular distance∆Ris defined as∆R= p
∆η2+ ∆φ2.
R(b-hadron,jet)
∆
0 0.05 0.1 0.15 0.2 0.25
b-tagging efficiency
0.2 0.4 0.6 0.8 1 1.2 1.4
=2.5 TeV , mg
t
→ t gKK
≈ 70%
εb
= 8 TeV s
R=0.4 Jets Anti-kt
ATLAS Simulation Preliminary MV1 MVb
Figure 1:
b-tagging efficiencies of the MV1 and MVb algorithms as a function of the
∆Rbetween the distance of the flight direction of the b-hadron and the b-jet axis. The plot is evaluated for a sample containing
gKK →t t ¯ events with a KK-gluon mass of 2.5 TeV. The algorithms are compared for a working point corresponding to a b-tagging efficiency of 70% in the SM t t ¯ sample. The MV1 algorithm provides a better light-flavour jet rejection than the MVb tagger for jet p
Tvalues below 60 GeV, while the performance of MVb is significantlly better for a p
Tabove 100 GeV [3].
approaches are the kinematic selection method and the kinematic fit method. They have smaller statistical uncertainties than the dilepton-based methods, but significantly larger systematic uncertainties. The new b-tagging calibration technique presented in this note is referred to in the following as the single lepton tag and probe method (SL T&P).
This note is organized as follows. Section 2 gives a brief overview of the various subdetector com- ponents of ATLAS, while Section 3 describes the Monte Carlo and data samples used in these studies.
Section 4 summarises the main aspects of the event and object selection and reconstruction techniques used to identify b-jets stemming from top-quark pair candidate decays. Details of the approach used to extract the b-tagging efficiency from data, and the relevant sources of systematic uncertainties are given in Sections 5 and 6, respectively. The calibration results of the MVb and the MV1 algorithms are presented in Section 7, while a conclusion is given in Section 8.
2 The ATLAS detector
The ATLAS detector [8] has a cylindrical forward-backward symmetric geometry and an almost 4π
coverage of the solid-angle. The Inner Detector is located at the centre of the detector, and measures the
trajectories of charged particles. The Inner Detector consists of multiple layers of silicon pixel and strip
detectors and a straw-tube transition radiation tracker. This subdetector is surrounded by a barrel shaped
solenoid magnet that provides a field strength of up to 2 T. Energies of electromagnetic and hadronic
particle showers are measured with the Liquid-Argon (LAr) and Tile calorimeters. The outermost part of
the detector is the Muon Spectrometer, which consists of precision and trigger chambers together with a
superconducting air-cored toroid magnet system.
3 Data and Monte Carlo samples
Events are selected from data collected with the ATLAS detector using pp collisions with
√s
=8 TeV collected at the LHC in 2012. The corresponding total integrated luminosity [9] is 20.3
±0.6 fb
−1.
Top-antitop pair events are simulated (according to the SM predictions) by the POWHEG r2129 [10] generator at next-to-leading order (NLO) accuracy of the matrix element using the CT10 parton distribution function (PDF) sets [11]. Parton showering and underlying events are modelled by PYTHIA v6.4.26 [12] with the Perugia 2011C tune [13]. Systematic uncertainties corresponding to the generation of the matrix element or the modelling of parton showering and fragmentation are studied by using samples of t¯ t events that are produced with alternative generators. For this purpose the MC@NLO v.4.03 [14] and POWHEG generators are interfaced to HERWIG v6.52 [15] and JIMMY [16] for the modelling of the hadronisation and the underlying event. The impact of initial and final state radiation (ISR/FSR) is estimated by using two different setups of the AcerMC v3.7 [17] generator, which is interfaced to PYTHIA. In these setups the parameters that control the ISR/FSR are varied in order to increase or decrease the additional jet activity [18] produced in association with t t ¯ events. The top quark mass is set to 172.5 GeV in all these samples, and the branching ratio of t
→Wb is set to 1. The t¯ t production cross- section corresponding to this particular top quark mass is calculated at next-to-next-to-leading-order (NNLO) accuracy in QCD including the resummation of next-to-next-to-leading-logarithms (NNLL) soft gluon bremsstrahlung, leading to 252.9
+13.3−14.5
pb for
√s
=8 TeV [19–23].
Events containing the associated production of a top-antitop pair and a vector boson are generated by MADGRAPH v5 [7] at leading-order using the PDF set CTEQ6L1 [24] and PYTHIA v6.4.26 for parton shower and fragmentation. The cross-section of this process is normalised to the NLO predictions [25,26]. Single top-quark production in the s- and t-channel or in association with a W boson is simulated like the t t ¯ events by using POWHEG and PYTHIA to generate matrix element and parton shower. The corresponding PDF set is CT10. Diboson (WW , WZ and ZZ) production is simulated at NLO accuracy with up to 3 additional partons using the PDF set CT10 and SHERPA v.1.4.1 [27] for the generation of the matrix element and parton shower. Events containing the production of a single vector boson (W or Z) are simulated in association with up to five additional partons using the multileg LO generator ALPGEN [28] and the CTEQ6L1 PDF set interfaced to PYTHIA for parton showering and fragmentation.
To avoid a double-counting of events having the same partonic configurations produced by both the matrix element and the parton shower evolution the MLM matching procedure [29] is used. Samples of W+jets production are generated separately for the sub processes W+light-flavour jets, Wc¯ c+jets, Wb b+jets and ¯ Wc+jets, while samples for the process Z+jets are generated for Z+light-flavour jets, Zc c+jets and ¯ Zb b+jets. As the ¯ W/Z+jets final states containing c- or b-jets can be produced in the same configuration for several of these subsamples, a heavy-flavour-overlap-removal procedure [30] is applied in order to avoid a double counting of the corresponding heavy-flavour contributions. The inclusive cross- sections of the W/Z
+jets samples are normalised to the NNLO predictions obtained from the FEWZ package [31].
All simulated events are generated at a centre-of-mass energy
√s of 8 TeV and passed through the full ATLAS detector simulation [32, 33]. The simulated events are overlaid with additional inelastic pp interactions that are simulated with PYTHIA8 [34] in order to match the pile-up conditions observed in the ATLAS data.
4 Selection of t t ¯ candidate events
The selection requirements of the physics objects and t t ¯ candidate events used in this study follow closely
those used in the ATLAS t t ¯ resonance search in order to maximise the selection acceptance for high p
Tobjetcs [35].
4.1 Object definition
Leptons are required to have a transverse momentum above 25 GeV and a pseudorapidity
|η| <2.5 (
|η|<2.47) for muon (electron) candidates. Tight identification cuts [36–38] are applied to both lepton types, including the requirement that the absolute value of the longitudinal track impact parameter
|z
0|, which is measured with respect to the primary vertex, must be smaller than 2 mm. This reduces the number of selected leptons arising from pile-up interactions. The contribution of non-prompt muons is further suppressed by applying a cut on the significance of the transverse track impact parameter, defined as the ratio of the transverse impact parameter to its uncertainty (
|d
0|/σd0 <3). Electrons with energy deposits in the transition region 1.37
< |η| <1.52 between the barrel and the endcap of the EM calorimeter are rejected. Additionally, the lepton candidates are required to be sufficiently isolated from hadronic activity to reduce the background from hadrons mimicing lepton signatures or from heavy- flavour decays (leading to non-prompt leptons) inside jets. In this study the mini-isolation I
ℓminiis used for both electrons and muons. This quantity is calculated as the sum of the transverse momentum of each charged particle track with a distance from the lepton candidate
∆R(ℓ,track) that is less then K
T/pℓT, where K
Tis an empirical scale parameter set to 10 GeV [39]. Lepton candidates are considered to be isolated if the ratio of I
miniℓto the lepton p
Tis below 0.05.
Jets are reconstructed by applying the anti-k
talgorithm as implemented in the FASTJet package [40]
to topological clusters made from adjoining calorimeter energy deposits, using a distance parameter of R
=0.4. The topological clusters are calibrated using the local cluster weighting method [41] in order to compensate for differences in the calorimeter response to hadronic and electromagnetic showers. In addition, the final jet properties (such as the transverse momentum) are corrected using energy and
ηdependent simulation-based calibration factors [41, 42] to compensate for the effects of pile-up, out-of- cluster leakage, and dead material. The jets used in this study are required to have a transverse momentum of at least 25 GeV and an absolute pseudorapidity below 2.5. Jets stemming from a pile-up vertex are rejected by using the jet-vertex fraction r
JVF[43]. This quantity is calculated as the ratio of the p
Tsum of the tracks associated with both the jet and the selected primary vertex to the p
Tsum of all tracks associated with the jet. It takes values within the range [0, 1], while a r
JVFvalue of
−1 is assigned to jets that have no associated tracks. Within this study, jets with
|r
JVF| <0.5 are removed if their transverse momentum is below 50 GeV and their absolute pseudorapidity is below 2.4.
Primary vertex candidates are reconstructed by applying an iterative vertex finding algorithm [44]
to tracks that are compatible with originating from the interaction region, where all tracks with p
T >400 MeV are considered. Primary vertex candidates are required to have at least five reconstructed tracks.
The candidate with the highest p
2Tsum of the associated tracks is chosen to be the primary vertex of the event.
4.1.1 Overlap removal
The angular separation
∆Rbetween a lepton candidate and a selected jet is required to be greater than 0.2 for electron candidates and greater than 0.04
+10 GeV/ p
µTfor muon candidates. Leptons that fail this requirement are removed from the event. Jets are removed if the
∆Rwith respect to the selected electron is less than 0.4 and if the p
Tof the jet is less than 25 GeV (after the p
Tof the electron candidate has been subtracted).
4.2 Flavour-tagging tools
The lifetime-based b-tagging algorithms used in ATLAS are based either on the track impact parameters
(IP2D or IP3D [45]) or on the properties of a displaced vertex reconstructed inside a jet. For the purpose
of secondary vertex reconstruction, the iterative vertex finder (i.e., the SV1 algorithm [46]) or the JetFitter
algorithm can be used. The iterative vertex finder reconstructs inclusive vertices containing the decay products of a b-hadron, including those of any subsequent c-hadron decays, based on a
χ2minimisation.
The JetFitter agorithm [47, 48] exploits the topology of the decay cascade introduced by a b-hadron decay to reconstruct separately the secondary and tertiary vertices. A multi-vertex fit is performed on the assumption that the primary event vertex and the vertices of the weak b- and c-hadron decays lie on a common line defined by the flight direction of the b-hadron. The technical implementation of this procedure is based on a Kalman filter, and its main advantage with respect to the iterative vertex finder is the ability to reconstruct vertices from single tracks intersecting the flight axis.
The MV1 algorithm [4] employs an artifical neural network based on the output of the IP3D, SV1 and JetFitter algorithms, while the MVb algorithm [3] is based on boosted decision trees and the input quantities of the simple tagging algorithms (i.e. the IP3D, SV1 and JetFitter taggers). Furthermore, this tool includes one jet shape related quantity, the jet width, which provides an additional separation between b- and light-flavoured jets due to the difference in the mass of the corresponding hadrons. More importantly, this quantity increases the performance of the b-tagger in dense jet environments as it adds topology based information to the multivariate analysis used to train the b-tagger.
4.2.1 Jet truth labelling
The definition of b-, c-,
τ- and light-flavour jets in simulated events is given via the so-called truth flavourlabelling. This procedure is based on an angular matching of generator level particles to reconstructed jets using their coordinates in the pseudorapidity-azimuthal plane. If a b-quark with p
T >5 GeV is found to be inside a cone of radius
∆R=0.3 around the axis of a jet, this jet is labelled as a b-jet. This matching procedure is repeated for c-quarks and then for
τ-leptons if no accociation to ab-quark is possible. A jet is labelled by default as light-flavoured if no association to one of these particles was successful.
4.3 Event preselection
Top quark pair candidate events decaying into a final state of exactly one charged lepton and jets are selected by requiring that the appropriate single-lepton trigger has fired. The lepton trigger decisions are based on a logical OR of two single-electron or two single-muon triggers, the first having transverse momentum thresholds of 24 GeV and requiring the lepton to be isolated from nearby hadronic activity and other lepton candidates, and the second not requiring isolation and having higher thresholds of 36 GeV for muons and 60 GeV for electrons. Motivated by the decay of a W boson into a high-energy charged lepton and neutrino, exactly one electron or one muon that passes the full object definition requirements (including isolation) has to be identified within the acceptance of the detector and its p
Thas to exceed 25 GeV. Additionally, the lepton candidate has to be matched to the triggered object.
The magnitude of the missing transverse momentum
2E
Tmiss, which is assumed to correspond to the neutrino transverse momentum, is required to be at least 20 GeV. This requirement is designed to reject events containing only non-prompt and fake leptons, for example multijet production. A further suppression of this background is obtained using the transverse mass of the W-boson candidate:
m
T,W = q2p
ℓTE
missT(1
−cos
φℓν)
where
φℓνcorresponds to the azimuthal angle between the lepton candidate and the E
Tmissvector. For both the electron and the muon channel, the sum of m
T,Wand E
missThas to be larger than 60 GeV. Candidate
2An object basedEmissT definition is used in this analysis. Calibrated calorimeter cells belonging to identified high-pT
objects (such as electrons, photons, jets and muons) are included in the calculation of the totalEmissT together with unassociated calorimeter cells, which are calibrated to the electromagnetic energy scale.
events are also required to contain at least four jets. Further cuts are applied to remove events that fail certain quality requirements. Events are removed if they contain noise bursts in the LAr calorimeter or any jet with p
T >20 GeV that is identified as noise in the calorimeter or as out-of-time activity with respect to the pp collision. Events are also rejected if they contain at least one electron whose reconstructed track is also associated with a muon.
4.4 Event reconstruction
The b-tagging efficiencies and the corresponding data-to-simulation calibration scale factors are mea- sured in an unbiased sample of b-jets that is selected without using any b-tagging related information.
The event topology of t t ¯ decays is exploited using the reconstructed top quark and W boson invariant masses as well as the expected event kinematics in order to identify b-jets stemming from the hadronic and leptonic top quark decays.
For this purpose a
χ2minimisation procedure is used to fully reconstruct top quark pair candidate events in data that have a final state of one charged lepton and at least four jets. The longitudinal com- ponent of the neutrino momentum, which is required to reconstruct the leptonic top quark decay, is calculated by applying an on-shell W boson mass constraint to the E
Tmiss+lepton system. This approachleads to a quadratic equation, which provides either two, one, or zero real solutions. If it does not have an existing real solution, the missing momentum vector is rotated until a real solution is found. If this procedure leads to ambiguities, the rotation which provides the minimal change in the E
missTis chosen. If two real solutions are obtained, both solution are tested in the reconstruction procedure.
The
χ2minimisation technique uses a constraint on the expected top quark and W-boson masses and on the event kinematics. All selected anti-k
tjets, the charged lepton, and both solutions for the longitu- dinal neutrino momentum (if two exist) are taken into account to find the permutation corresponding to the smallest
χ2total =
m
j j−M
Wh σMWh
2
| {z }
χ2Wh
+
m
j j j−m
j j−M
th−Wh σMth−Wh
2
| {z }
χ2th−Wh
+
m
jℓν−M
tℓ σMtℓ
2
| {z }
χ2t
ℓ
+
( p
T,j j j−P
T,th)
−(p
T,jℓν−P
T,tℓ)
σ∆PT!2
| {z }
χ2∆p
T
value. All parameters contained in this equation (i.e. masses, momenta, and their standard deviations) that are denoted by a capital letter are kept constant during the minimasation procedure. Their values are obtained from the simulation following the procedure described in Reference [35]. The first and second terms (χ
2Wh
and
χ2th−Wh
) correspond to the mass constraints on the W-boson and the top quark on the hadronic side of the event, where M
Whand
σMWhrepresent the average and RMS of the reconstructed invariant mass distribution of the jets resulting from the hadronic W-boson decay. Since the invariant masses of the two and three jet combinations m
j jand m
j j jare strongly correlated with each other, the W-boson mass is subtracted from the mass of the hadronically decaying top quark (which leads to M
th−Whand
σMth−Wh) in order to decouple the two terms. The two-jet combination is assigned to the hadronically decaying W boson, while the three-jet combination is assigned to the hadronically-decaying top quark.
The contribution
χ2tℓ
corresponds to the t
→bW
→bℓν decay in the event, and the fourth term in- cludes information on the expected event kinematics and constrains the p
Tdifference of the leptonically and hadronically decaying top quark candidates to the predictions of the simulation. The last two terms include the mass of the combined jet-lepton-neutrino system m
jℓν, the expected average mass of the lep- tonically decaying top quark M
tℓ, the expected average transverse momenta of the hadronic and leptonic top quarks P
T,thand P
T,tℓ, as well as the corresponding standard deviations
σMtℓ
and
σ∆PT. In order to
calculate the mass m
jℓνof the leptonic top quark candidate, a mass constraint on the W boson is used to
get the longitudinal component of the neutrino momentum, as described above.
For each event, only the assignment corresponding to the smallest
χ2totalvalue is considered in the following measurements. Additional requirements are introduced in order to decrease both the number of incorrectly-reconstructed t t ¯ decays and the background contamination. Selected candidate events are required to satisfy log
10(χ
2total)
<0.9. In addition, the jet assigned to stem from the leptonic top quark decay is required to be b-tagged, while the two jets assigned to the hadronic W boson decay are required not to be b-tagged. For this purpose the MV1 algorithm is used at an operation point that matches an overall efficiency of 70% in a simulated t t ¯ sample. This operation point is obtained by using a fixed cut on the MV1 output discriminant. The measurement of the b-tagging efficiencies of the various algorithms in data is finally performed on a jet sample that contains only the b-jet candidates on the hadronic side of the events. The hadronic side of the semileptonic t t ¯ events is chosen in this context as it provides a higher jet multiplicity (and thus a more dense environment) than the leptonic side of the events. The leptonic b- jet is also studied to provide a comparison of the measured b-tagging efficiencies and the corresponding scale factors. In this case, the b-jet candidate in the hadronic top quark decay is required to be b-tagged using the MV1 algorithm, while the two jets assigned to the W boson decay are still required not to be b-tagged.
4.4.1 Background estimation
While the electroweak production of single-top quarks, Z+jets, and diboson events are estimated based on the predictions of the simulation, the associated production of W-bosons and jets as well as the background from events with non-prompt or fake leptons are estimated using information gained from dedicated control regions in the data. The background contribution due to the non-prompt and fake lepton background is estimated using a matrix method. The corresponding formalism is extensively explained in Reference [49], while details on the extraction of the efficiencies for real and fake leptons can be found in Reference [35].
Simulated samples are used to predict the shape of all kinematic distributions in the W+jets back- ground. However, the total normalisation of these samples is corrected to the yields in a control region defined in the data. For this purpose scale factors are determined by exploiting the underlying charge asymmetry of the W+jets production. The relative fractions of W-bosons associated to light-flavour and heavy-flavour jets is fixed by using a template fit of the predicted b-tag multiplicity distribution to the observed data in the W+jets control region and extrapolating the resulting scale factors to the signal re- gion. The scale factors and further information on this approach (e.g. definition of the control regions) can also be found in Reference [35].
4.4.2 Corrections
The measurement of the unfolded top quark p
Tspectrum performed on the 2011
√s
=7 TeV data shows significant deviations with respect to the predictions of the POWHEG and PYTHIA generators [50].
Thus the distribution of the average p
Tof the top and anti-top quark obtained from the 8 TeV simulation is reweighted using data-to-simulation scale factors based on the
√s
=7 TeV measurements.
4.4.3 Event yields
The final event yields that are obtained after the event selection and reconstruction procedures (includ-
ing the cut on the reconstructed
χ2totalvalue, as well as the tag and anti-tag requirement) are applied to
the ATLAS data and the simulation are summarised in Table 1. In total 48207 (46579) events are ob-
served in the electron (muon) channel, while approximately 44500 (42900) events are predicted by the
Monte Carlo simulation and the data-driven background estimations. Within the total uncertainties on
the signal and background processes, the predictions of the simulation and the measured data are compat- ible. The dominant background contributions after the full event selection and reconstruction arise from the associated production of W bosons and jets, single top quarks and the non-prompt and fake lepton background, while the backgrounds from the Z+jets and diboson production are substantially smaller.
The background contamination in the selected event sample is 14% and 10% for the electron and muon channel, respectively.
Source N
e+jetsN
µ+jetst t ¯ 38400
±4800 38500
±5000
t t ¯
+V 101
±14 101
±15
W
+jets 2050
±380 2180
±310
Z
+jets 430
±220 200
±110
Diboson 58
±22 52
±20
Single top 1410
±320 1460
±340
Fake lepton background 2070
±520 365
±91 Total prediction 44500
±4900 42900
±5000
Observed 48207 46579
Table 1:
Numbers of events passing the full event selection and reconstruction procedure (including the cut on the log
10(χ
2total) as well as the tag and anti-tag requirement) dedicated to identify t t ¯ candidate events in final states containing exactly one charged lepton, missing transverse momentum and at least four jets. The event yields are shown separately for the predicted signal and background processes and the data. The uncertainties correspond to the total systematics relevant for this analysis. A detailed description of the sources considered is presented in Section 6.
Figure 2 shows data-to-simulation comparisons of the
χ2totaldistribution of the events passing the full selection and reconstruction procedure (including the tag and the anti-tag requirements but not the cut on the corresponding log
10(χ
2total) value) separately for the electron plus jets and muon plus jets channels.
The sum of the individual processes predicted by the simulation and estimated by the matrix method are compared to the data. In these distributions (and also in the following), the non-prompt and fake lepton backgrounds, diboson and single top-quark events as well as the associated production of a Z-boson and jets are summarised as one single component (referred to as “others”). The contribution that is denoted by t t ¯ contains both the top-quark pair production and the associated production of a top-quark pair and a vector boson.
In general, the observations in data tend to be above the predictions from the simulation by 8%, which is consistent with the findings presented in Reference [35]. But considering the total uncertainties on the selection acceptance for both the signal and background processes, the predictions from the simulation and the observations in data are compatible with each other over almost the full range of log
10(χ
2total) values. This offset in the data is not expected to impact the measurements presented in the following significantly, as the applied method depends not on the total normalisation but only on the modelling of the flavour composition of the selected jet sample.
Data-to-simulation comparisons for the relevant kinematic properties of the selected probe jets (i.e.
the b-jet candidate on the hadronic side of the reconstructed events) are displayed in Figure 3 for the
e+jets and
µ+jets channels separately. The transverse momenta, Figure 3, and the pseudorapidities, Fig-ure 3, of these jets are shown. These distributions are obtained after applying the full selection and
reconstruction requirements to the candidate events (including the tag and the anti-tag requirements and
also the cut on the corresponding log
10(χ
2total) value). For these quantities, the predictions from the sim-
ulation and the observations in data are compatible within the uncertainties. As no significant difference
is observed between the e+jets and
µ+jets channel, theb-tagging calibration results are presented in the
)
2 total
χ
10( log
Events/0.25
5000 10000 15000
20000 -1
L dt = 20.3 fb
∫
= 8 TeV s
ATLAS Preliminary
e+jets channel
data t t W+jets others
stat. + syst. unc.
2 )
total
χ
10( log -1.5 -1 -0.5 0 0.5 1 1.5 2 2.5 3 3.5
Data / pred.
0.8 1 1.2
(a)log10(χ2total) (e+jets channel)
)
2 total
χ
10( log
Events/0.25
5000 10000 15000 20000
L dt = 20.3 fb-1
∫
= 8 TeV s
ATLAS Preliminary
+jets channel µ
data t t W+jets others
stat. + syst. unc.
2 )
total
χ
10( log -1.5 -1 -0.5 0 0.5 1 1.5 2 2.5 3 3.5
Data / pred.
0.8 1 1.2
(b)log10(χ2total) (µ+jets channel)
Figure 2:
Distribution of the minimum
χ2totalobtained from the reconstruction of the top-quark pair candidates after the full event selection (including the tag and the anti-tag requirements but not the cut on the corresponding log
10(χ
2total) value) was applied. The simulated Monte Carlo samples are normalised according to their predicted cross-sections to an integrated luminosity of 20.3 fb
−1. Data-to-simulation ratios are shown at the bottom of each plot.
following section based on the combination of both channels.
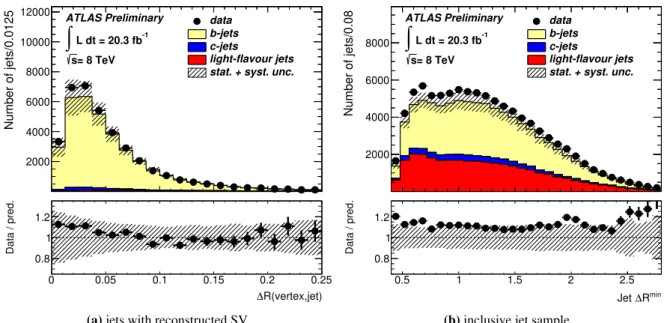
In addition, Figure 4 presents data-to-simulation comparisons for the angular separation between the line joining the primary and secondary vertex and the jet axis
∆R(vertex,jet) for secondary vertex candidates reconstructed by the iterative vertex finder (a) as well as the distribution of the
∆Rminbetween a probe jet and the other jets contained in the selected candidate events (b). In order to highlight the difference between b- and non b-jets, these distributions are subdivided into the various jet flavours, where the contribution due to the non-prompt lepton background is subtracted from the observations in the data. Jets originating from
τlepton decays are included in the distribution of the light-flavour jets.
In general, the distributions observed in the data and the predictions of the simulation are in reasonable agreement for all the presented quantities. The small excess observed in the data is covered by the total systematic uncertainties.
The distributions that are displayed in Figure 4 take into account only the subset of probe jets that contain a secondary vertex candidate reconstructed with the iterative vertex finder. According to the predictions of the simulation (taking all the relevant systematic uncertainties into account), 42.2
±2.8% of these jets have a secondary vertex reconstructed with the iterative vertex finder. In data, the corresponding fraction is 40.4
±0.2%.
5 Measurement of the b-tagging e ffi ciency in data
The measurement of the b-tagging effciency in data is performed by probing the b-jet candidate on the
hadronic side of the t t ¯ decay. As the corresponding jet sample contains a significant fraction of c- and
light-flavour jets, this contamination has to be taken into account. The same approach as in the kinematic
selection method [1] is used to calculate the b-tagging efficiency in data using the following equation:
[GeV]
Jet pT
Number of jets/25 GeV
1 10 102
103
104
105
106
107
108
L dt = 20.3 fb-1
∫
= 8 TeV s
ATLAS Preliminary
e+jets channel
data t t W+jets others
stat. + syst. unc.
[GeV]
Jet pT
50 100 150 200 250 300 350 400 450 500
Data / pred.
0.5 1 1.5
(a)Probe jetpT(e+jets channel)
[GeV]
Jet pT
Number of jets/25 GeV
1 10 102
103
104
105
106
107
108
L dt = 20.3 fb-1
∫
= 8 TeV s
ATLAS Preliminary
+jets channel µ
data t t W+jets others
stat. + syst. unc.
[GeV]
Jet pT
50 100 150 200 250 300 350 400 450 500
Data / pred.
0.5 1 1.5
(b)Probe jetpT(µ+jets channel)
η Jet
Number of jets/0.2
2000 4000 6000
L dt = 20.3 fb-1
∫
= 8 TeV s
ATLAS Preliminary
e+jets channel
data t t W+jets others
stat. + syst. unc.
η Jet -2.5 -2 -1.5 -1 -0.5 0 0.5 1 1.5 2 2.5
Data / pred.
0.8 1 1.2
(c)Probe jetη(e+jets channel)
η Jet
Number of jets/0.2
2000 4000 6000
L dt = 20.3 fb-1
∫
= 8 TeV s
ATLAS Preliminary
+jets channel µ
data t t W+jets others
stat. + syst. unc.
η Jet -2.5 -2 -1.5 -1 -0.5 0 0.5 1 1.5 2 2.5
Data / pred.
0.8 1 1.2
(d)Probe jetη(µ+jets channel)
Figure 3:
Distribution of the transverse momentum (a-b) and the pseudorapidities (c-d) of the selected probe jets displayed separately for the electron plus jets (left column) and muon plus jets (right column) channel. The simulated Monte Carlo samples are normalised according to their predicted cross-sections for an integrated luminosity of 20.3 fb
−1. Data-to-simulation ratios are shown at the bottom of each plot.
εb=
1 f
b−jets ·f
tag−εcf
c−jets−εlf
l−jets−εfakef
fake,
(1)
where f
b−jets, f
c−jetsand f
l−jetsdenote the fractions of b-, c- and light-flavour jets within the sample of
probe jets, while f
fakegives the fraction of jets stemming from the multijet background estimated from
data. The quantity f
tagdenotes the fraction of jets that are b-tagged with a predefined tagger and operation
point and is obtained from data, while the flavour fractions f
b−jets, f
c−jetsand f
l−jetsare taken from the
R(vertex,jet)
∆
Number of jets/0.0125
2000 4000 6000 8000 10000 12000
L dt = 20.3 fb-1
∫
= 8 TeV s
ATLAS Preliminary data b-jets c-jets
light-flavour jets stat. + syst. unc.
R(vertex,jet)
∆
0 0.05 0.1 0.15 0.2 0.25
Data / pred.
0.8 1 1.2
(a)jets with reconstructed SV
Rmin
∆ Jet
Number of jets/0.08
2000 4000 6000
8000
∫
L dt = 20.3 fb-1= 8 TeV s
ATLAS Preliminary data b-jets c-jets
light-flavour jets stat. + syst. unc.
Rmin
∆ Jet
0.5 1 1.5 2 2.5
Data / pred.
0.8 1 1.2
(b)inclusive jet sample
Figure 4:
Distribution of the
∆R(vertex,jet) (a) for secondary vertex candidates contained in the selected probe jets and resconstructed with the iterative vertex finder as well as the
∆Rmin(b), the minimum distance between the probe jet and its nearest neighbouring jet. The predictions from the simulation are subdivided into the three different jet flavour types. The simulated samples are normalised according to their predicted cross-sections for an integrated luminosity of 20.3 fb
−1. Data-to-simulation ratios are shown at the bottom of each plot.
simulation. The mistag efficiencies
εcand
εlfor c- and light-flavour jets respectively, are extracted from the simulation and corrected using the most recent data-to-simulation calibration scale factors measured with the D
∗and negative tag methods [4]. The tagging efficiency of the jets coming from QCD multijet events
εfakeis extracted from a control region in data (as described in Section 5.2).
5.1 Flavour composition of the selected jet sample
A precise knowledge of the flavour composition of the probe jet sample is essential for the measurement of the b-tagging efficiency through Equation 1. However, the precision to which these fractions are known depends strongly on the quality of the kinematic reconstruction of t t ¯ candidate events. Systematic effects on the reconstruction method will lead to systematic uncertainties on the flavour fractions and thus also on the measured b-tagging efficiencies.
The fraction of b- c- and light-flavour jets contained in this jet sample as well as the fraction of jets stemming from the non-prompt lepton background are shown together with their total systematic uncertainties in Figure 5 (a) as a function of the probe jet p
Tand in Figure 5 (b) as a function of the probe jet
η. For jets with a transverse momentum between 25 GeV and 30 GeV theb-jet fraction is about 35% and rises to values of approximately 70% for jets with a p
Tabove 200 GeV. Light-flavour jets give the second largest contribution to this sample. Their fraction varies between approximately 25%
and 40% in the range from 30 GeV to 300 GeV and about 55% for jets with a p
Tbelow 30 GeV. The contamination due to jets from the non-prompt lepton background is below 2% over the full p
Tregion, while the fraction of c-jets is on the order of 5% to 7%.
Both the c- and the light-flavour contribution to the probe jet sample originate mainly from incor-
rectly reconstructed top quark decays (i.e. candidate events in which the
χ2minimisation procedure has
assigned the wrong permutation of jets to the decay products of the top quark). Only 10% to 20% of the selected c- and light-flavour jets stem from vector bosons produced in association with jets or from single-top quark events.
If the b-jet candidate on the leptonic side of the event is used to obtain the probe jet sample (instead of the b-jet candidate on the hadronic side), the b-jet fraction is significantly increased. For jets with a p
Tbelow 30 GeV the b-jet fraction is of the order of 30%. The fraction of light-flavour jets is around 60% in this region, while the fraction of c-jets and jets from the non-prompt and fake lepton background are both approximately 5%. For a probe jet p
Texceeding 200 GeV, the b-jet fraction rises to 85%-90%
and the light-flavour fraction decreases to around 5%-10%. These flavour fractions are displayed as a function of the probe jet p
Tin Figure 5 (e).
5.2 Measurement of the b-tagging e ffi ciency for jets from the non-prompt lepton back- ground
The b-tagging efficiencies for jets from the non-prompt lepton background
εfakeare determined directly in a control region in data without using the templates obtained from the application of the matrix method in the signal region (due to their limited statistics). A disjoint jet sample (CR1) is obtained by inverting the selection requirements on the E
missT, m
T,W, and the log
10(χ
2total) obtained by the kinematic fit. The corresponding cut values are set to E
missT <20 GeV, E
Tmiss+m
T,W <60 GeV, and log
10(χ
2total)
>0.9. In addition, the only events taken into account are those that contain a reconstructed lepton candidate that is classified into the loose category but does not fulfill the tight lepton requirement (in order to minimise the contribution of events containing prompt leptons). All jets contained in this sample are used to determine
εfake(i.e. the fraction of b-tagged jets).
The measurement of
εfakeis repeated changing the selection requirements on the E
Tmiss, E
Tmiss+m
T,Wand log
10(χ
2total) to check to what extent the estimated
εfakedepends on the control region definition.
Thus, the sccond and third control regions (CR2 and CR3) are defined by E
missT >20 GeV and E
Tmiss+m
T,W <60 GeV and E
missT <20 GeV and E
missT +m
T,W >25 GeV, where the log
10(χ
2total) is required to be above 0.9 for both regions. The fourth control region (CR4) is defined by E
Tmiss <20 GeV and E
missT +m
T,W <60 GeV, while no cut on the log
10(χ
2total) value is applied.
The results obtained in the additional three control regions (CR2, CR3, and CR4) are used to estimate a systematic uncertainty on
εfake. For each bin, the value with the largest variation with respect to the results of the first control region defines the uncertainty in the corresponding phase space region. This un- certainty is then propagated to the measurement of the b-tagging efficiency in data and its corresponding data-to-simulation scale factor.
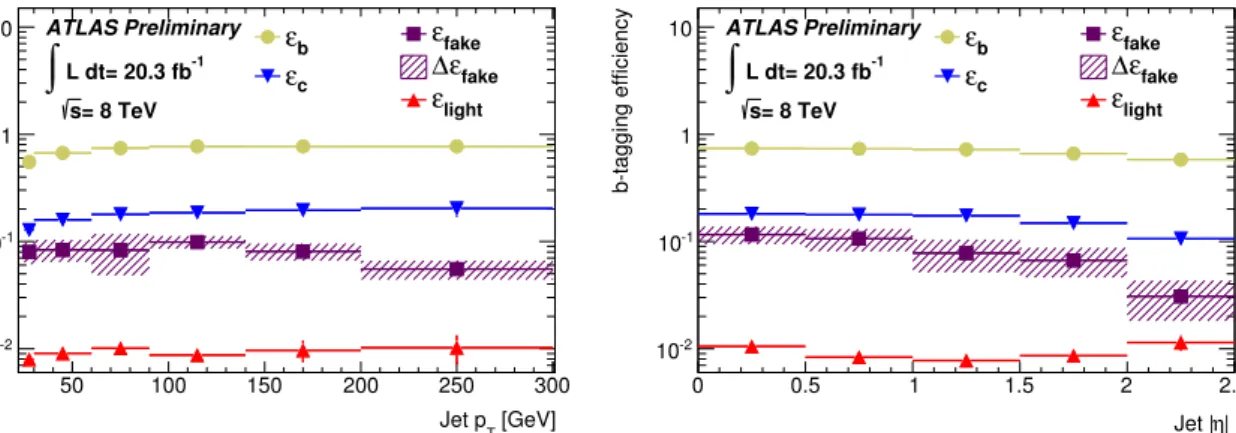
The b-tagging efficiencies of the MVb algorithm for jets from the non-prompt and fake lepton back- ground and their systematic uncertainties (i.e. the envelope of the
εfakedifferences per bin) are compared to the predicted b-tagging efficiencies for b-, c- and light-flavour jets as a function of the jet p
Tand
ηin Figures 6 (a) and (b) respectively, while their
∆Rmindependence is shown in Figure 6 (c). The overall b-tagging efficiency for jets from the non-prompt and fake lepton background is approximately 10%. The
εfakevalues decrease with increasing jet p
Tand
|η|values and are almost constant as a function of
∆Rmin. The relative systematic uncertainties assigned to
εfakerange between 20% and 42% as a function of the jet p
T, between 19% and 41% as a function of the jet
|η|, and between 19% and 53% as a function of the angular separation between the probe jet and its nearest neigbouring jet.
6 Systematic uncertainties
Systematic uncertainties on the measured b-tagging efficiencies and the corresponding scale factors are
evaluated individually, by replacing the nominal jet sample with a modified sample obtained after varying
[GeV]
Jet pT
50 100 150 200 250 300 350 400 450 500
Jet flavour fraction
0.2 0.4 0.6 0.8
1 fb
light
f fake
f fc L dt= 20.3 fb-1
∫
= 8 TeV s
ATLAS Preliminary
(a)
η| Jet |
0 0.5 1 1.5 2 2.5
Jet flavour fraction
0.2 0.4 0.6 0.8
1 fb
light
f fake
f fc L dt= 20.3 fb-1
∫
= 8 TeV s
ATLAS Preliminary
(b)
Rmin
∆ Jet
0.4 0.6 0.8 1 1.2 1.4 1.6 1.8 2
Jet flavour fraction
0.2 0.4 0.6 0.8
1 fb
light
f fake
f fc L dt= 20.3 fb-1
∫
= 8 TeV s
ATLAS Preliminary
(c)
R(vertex,jet)
∆
0 0.05 0.1 0.15 0.2 0.25
Jet flavour fraction
10-2
10-1
1
10 fb
light
f fake
f fc L dt= 20.3 fb-1
∫
= 8 TeV s
ATLAS Preliminary
(d)
[GeV]
Jet pT
50 100 150 200 250 300 350 400 450 500
Jet flavour fraction
0.2 0.4 0.6 0.8 1
1.2 fb
light
f fake
f fc L dt= 20.3 fb-1
∫
= 8 TeV s
ATLAS Preliminary
(e)
Figure 5:
Expected jet flavour composition of the selected b-jet sample. The relative flavour fractions
are presented in various bins of the jet p
T(a) and
|η|(b), the
∆Rto the nearest neighbouring jet (c) and
the
∆R(vertex,jet) for vertices reconstructed with the iterative vertex finder (d). The expected jet flavour-
fractions are also shown as a function of the jet p
Tin case that the b-jet candidate on the leptonic side of
the event is used (e). In addition, the total systematic uncertainties on the flavour fractions are presented
as shaded areas.
[GeV]
Jet pT
50 100 150 200 250 300
b-tagging efficiency
10-2
10-1
1 10
εb
εc
εfake
εfake
∆
light
ε
L dt= 20.3 fb-1
∫
= 8 TeV s
ATLAS Preliminary
(a)b-tagging efficiencies as a function of the jetpT
η| Jet |
0 0.5 1 1.5 2 2.5
b-tagging efficiency
10-2
10-1
1 10
εb
εc
εfake
εfake
∆
light
ε
L dt= 20.3 fb-1
∫
= 8 TeV s
ATLAS Preliminary
(b)b-tagging efficiencies as a function of the jet|η|
Rmin
∆ Jet
0.4 0.6 0.8 1 1.2 1.4 1.6 1.8 2
b-tagging efficiency
10-2
10-1
1 10
εb
εc
εfake
εfake
∆
light
ε
L dt= 20.3 fb-1
∫
= 8 TeV s
ATLAS Preliminary
(c)b-tagging efficiencies as a function of the∆Rmin
Figure 6: