ATLAS-CONF-2017-018 03April2017
ATLAS CONF Note
ATLAS-CONF-2017-018
Search for Heavy Resonances Decaying to a W or Z Boson and a Higgs Boson in the q q ¯ ( 0 ) b b ¯ Final State
in pp Collisions at √
s = 13 TeV with the ATLAS Detector
The ATLAS Collaboration
21st March 2017
A search for heavy resonances decaying to a W or Z boson and a Higgs boson in the q q ¯
(0)b b ¯ final state is described. The search uses 36.1 fb
−1of proton-proton collision data at √
s = 13 TeV collected by the ATLAS detector at the CERN Large Hadron Collider in 2015 and 2016. The data are in agreement with the Standard Model expectations, with the largest ex- cess found at a resonance mass of 3.0 TeV with a local (global) significance of 3.3 (2.2) σ.
The results are presented in terms of constraints on a simplified model with a Heavy Vector Triplet. Upper limits are set on the production cross-section times branching ratio for reson- ances decaying to a W (Z) boson and a Higgs boson in the mass range between 1.1 and 3.8 TeV. The limits range between 83 and 1.6 fb (77 and 1.1 fb) at 95% confidence level.
c
2017 CERN for the benefit of the ATLAS Collaboration.
Reproduction of this article or parts of it is allowed as specified in the CC-BY-4.0 license.
1 Introduction
The discovery of the Higgs boson [1, 2] confirms the validity of the Standard Model (SM) in the de- scription of particle interactions at energies up to a few hundred GeV. However, radiative corrections to the Higgs boson mass drive its value to the model’s validity limit, indicating either extreme fine-tuning or the presence of new physics at an energy scale not far above the Higgs boson mass. It is natural to expect such new physics to manifest itself through significant coupling to the Higgs boson, for example in decays of new particles to a Higgs boson and other SM particles. This paper presents a search for resonances produced in 36.1 fb
−1of proton-proton (pp) collision data at √
s = 13 TeV that decay to a W or Z boson and a Higgs boson. Such resonances are predicted in multiple models of physics beyond the SM, e.g. composite Higgs [3, 4] or Little Higgs [5] models.
This search is conducted in the channel where the W or Z and Higgs bosons decay to quarks. The high mass region, with resonance masses m
VH> 1 TeV (V = W , Z), where the V and H bosons are highly Lorentz boosted, is considered. The V and H boson candidates are each reconstructed in a single jet, using jet substructure techniques and b-tagging to suppress the dominant background from multijet events and enhance the sensitivity to the dominant H → b b ¯ decay mode. The reconstructed dijet mass distribution is used to search for a signal and, in its absence, to set bounds on the production cross-section times branching fraction for new bosons which decay to a W or Z boson and a Higgs boson.
The results are expressed as limits on a simplified model which incorporates a Heavy Vector Triplet (HVT) [6] of bosons and allows for the interpretation of the results in a large class of models. The new heavy vector bosons couple to the Higgs boson and SM gauge bosons with coupling strength c
Hg
Vand to the SM fermions with coupling strength (g
2/g
V)c
F, where g is the SM SU(2)
Lcoupling constant. The parameter g
Vrepresents the typical interaction strength of the new vector bosons, while the dimensionless coe ffi cients c
Hand c
Fparameterize departures of this typical strength for interactions with the Higgs and SM gauge bosons and with fermions, respectively, and are expected to be of order unity in most models.
Two benchmark models are used: in the first, referred to as Model A, the branching fractions of the new heavy vector boson to known fermions and gauge bosons are comparable, as in some extensions of the SM gauge group [7]. In Model B, fermionic couplings to the new heavy vector boson are suppressed, as for example in a composite Higgs model [8]. The regions of HVT parameter space studied correspond to the production of resonances with an intrinsic width that is narrow relative to the experimental resolution.
The latter is roughly 8% of the resonance mass. The sensitivity of the analysis to wider resonances is not tested.
Searches for V H resonances, V
0, have recently been performed by the ATLAS and CMS collaborations.
The ATLAS searches (using leptonic V decays) based on data collected at √
s = 8 TeV set a lower limit at the 95% confidence level (CL) on the W
0(Z
0) mass at 1.47 (1.36) TeV in HVT benchmark Model A with g
V= 1 [9]. Using the HVT benchmark Model A, the ATLAS search based on 3.2 fb
−1of data collected at √
s = 13 TeV set a 95% CL lower limit on the W
0(Z
0) mass at 1.75 (1.49) TeV [10]. For Model B the corresponding limits are 2.22 (1.58) TeV. Searches by the CMS Collaboration at √
s = 8 TeV in hadronic channels, based on HVT benchmark Model B with g
V= 3, exclude heavy resonance masses below 1.6 TeV (W
0→ W H), below 1.1 TeV and between 1.3 TeV and 1.5 TeV (Z
0→ ZH), and below 1.7 TeV (combined V
0→ V H) [11] at the 95% CL. Using the W
0→ W H → `νb b ¯ channel CMS excludes new heavy vector bosons with masses up to 1.5 TeV in the same context [12]. The CMS Collaboration also carried out a search for a narrow resonance decaying to ZH in the q qτ ¯
+τ
−final state, setting limits on the Z
0production cross-section [13]. Searches for heavy resonances in HVT models have also been carried out in the hadronic WW / WZ / ZZ channels by the ATLAS experiment at √
s = 13 TeV with
3.2 fb
−1of data [14]. For Model B, a new gauge boson with mass below 2.6 TeV is excluded at the 95% CL.
2 ATLAS Detector
The ATLAS detector [15] is a general-purpose particle detector used to investigate a broad range of physics processes. It includes inner tracking devices surrounded by a 2.3 m diameter superconducting solenoid, electromagnetic and hadronic calorimeters and a muon spectrometer with a toroidal magnetic field. The inner detector consists of a high-granularity silicon pixel detector, including the insertable B- layer [16] installed after Run 1 of the LHC, a silicon strip detector, and a straw-tube tracker. It is immersed in a 2 T axial magnetic field and provides precision tracking of charged particles with pseudorapidity |η| <
2.5
1. The calorimeter system consists of finely segmented sampling calorimeters using lead / liquid-argon for the detection of electromagnetic (EM) showers up to |η| < 3.2, and copper or tungsten / liquid-argon for hadronic showers for 1.5 < |η| < 4.9. In the central region ( |η| < 1.7), a steel/scintillator hadronic calorimeter is used. Outside the calorimeters, the muon system incorporates multiple layers of trigger and tracking chambers within a magnetic field produced by a system of superconducting toroids, enabling an independent precise measurement of muon track momenta for |η| < 2.7. A dedicated trigger system is used to select events [17]. The first-level trigger is implemented in hardware and uses the calorimeter and muon detectors to reduce the accepted rate to 100 kHz. This is followed by a software-based high-level trigger (HLT) that reduces the accepted event rate to 1 kHz on average.
3 Data and Simulation Samples
This analysis uses 36.1 fb
−1of LHC pp collisions at √
s = 13 TeV collected in 2015 and 2016. The data are collected during stable beam conditions with all relevant detector systems functional. Events are selected using a trigger that requires a single anti-k
tjet [18] with radius parameter R = 1.0 (large-R jet) with a transverse energy (E
T) threshold of 360 (420) GeV in 2015 (2016). The trigger requirement is
> 99% e ffi cient for events passing the o ffl ine selection of a large-R jet with transverse momentum ( p
T)
> 450 GeV.
Signal and backgrounds from t¯ t, W /Z + jets, and diboson production are modeled with Monte Carlo (MC) simulation. While multijet MC events are used as a cross-check, the primary multijet background estimation is performed using data as described in Section 6. The signal is modeled using benchmark Model A with g
V= 1. Results derived from this model can be directly applied to benchmark Model B by rescaling the relevant branching ratios. The signal is generated with M adgraph 5_aMC@NLO 2.2.2 [19]
interfaced to Pythia 8.186 [20] for parton shower and hadronization, with the NNPDF2.3 NLO parton distribution function (PDF) set [21] and the ATLAS A14 tune [22] for the underlying event. The Higgs boson mass is set to 125.5 GeV, and Higgs decays to both b b ¯ and c¯ c are included in the simulation.
The V
0→ V H → q q ¯
(0)(b b ¯ + c¯ c) signal cross-section in Model B ranges from 66 fb (121 fb) for neutral
1ATLAS uses a right-handed coordinate system with its origin at the nominal interaction point (IP) in the centre of the detector and thez-axis along the beam pipe. The x-axis points from the IP to the centre of the LHC ring, and they-axis points upward. Cylindrical coordinates (r, φ) are used in the transverse plane,φbeing the azimuthal angle around thez-axis. The pseudorapidity is defined in terms of the polar angleθasη=−ln tan(θ/2). The rapidity is also defined relative to the beam axis asy=12lnE+pz
E−pz
.
(charged) resonances with a mass of 1 TeV, down to 0.05 fb (0.11 fb) for neutral (charged) resonances with a mass of 3.8 TeV. Samples are generated in steps of 100 GeV for resonance masses up to 2 TeV, then steps of 200 GeV up to 4 TeV, and one at 3.5 TeV.
The t¯ t background samples are generated with Powheg-Box v2 [23] with the CT10 PDF set [24], inter- faced with P ythia 6.428 [25] and the Perugia 2012 tune for the parton shower [26] using the CTEQ6L1 PDF set [27]. The cross-section of the t¯ t process is normalized to the result of a NNLO + NNLL cal- culation in QCD, as calculated by Top++ 2.0 [28]. The Powheg hdamp parameter [29] is set to the top quark mass, taken to be m
t= 172.5 GeV. The W +jets and Z +jets background samples are generated with S herpa 2.1 [30] interfaced with the CT10 PDF set [24]. Matrix elements of up to four extra partons are calculated at leading order in QCD. Only the hadronic decays of the W and Z bosons are included. For studies with simulated multijet events, the MC samples are generated with P ythia 8.186 [20], with the NNPDF2.3 NLO PDF [21] and the ATLAS A14 tune [22]. The background from SM V H production is negligible and therefore not considered.
For all simulated events, except those produced using S herpa , E vt G en v1.2.0 [31] is used to model the properties of bottom and charm hadron decays. The detector response is simulated with G eant 4 [32, 33]
and the events are processed with the same reconstruction software as that used for data. All simulated samples include the effects due to multiple pp interactions per bunch-crossing (pile-up).
4 Event Reconstruction
Collision vertices are reconstructed requiring a minimum of two tracks each with transverse momentum p
T> 0.4 GeV. The primary vertex is chosen to be the vertex with the largest P
p
2T, where the sum extends over all tracks associated with the vertex.
The identification and reconstruction of hadronically decaying gauge boson and Higgs boson candidates is performed with the anti-k
tjet clustering algorithm with R parameter equal to 1.0. These large-R jets [34]
are reconstructed from locally calibrated topological clusters [35] of calorimeter energy deposits. To mitigate the e ff ects of pile-up and soft radiation, the large-R jets are trimmed [36]: the jet constituents are reclustered into subjets using the k
talgorithm [37] with R = 0.2, removing those with p
subjetT/p
jetT< 0.05, where p
subjetTis the transverse momentum of the subjet and p
jetTis the transverse momentum of the original large-R jet. In order to improve over the limited angular resolution of the calorimeter, the combined mass of a large-R jet is computed using a combination of calorimeter and tracking information [38]. The mass is defined as:
m
J≡ w
calo× m
caloJ+ w
track×
m
trackJp
caloTp
trackT,
where m
caloJis the calorimeter-only estimate of the jet mass, and m
trackJis the jet mass estimated via tracks with p
T> 0.4 GeV associated with the large-R jet using ghost association
2[39]. To correct for the missing neutral component in the track jet, m
trackJis scaled by the ratio of calorimeter to track p
Testimates. The
2In this method, the large-Rjet algorithm is rerun with both the four-momenta of tracks, modified to have infinitesimally small momentum (the “ghosts”), and all topological energy clusters in the event as potential constituents of jets. As a result, the presence of tracks does not alter the large-Rjets already found and their association with specific large-Rjets is determined by the jet algorithm.
weighting factors w
caloand w
trackare p
caloT-dependent functions of the calorimeter and track-based jet mass resolutions used to optimize the combined mass resolution.
Track jets clustered using the anti-k
talgorithm with R = 0.2 are used to aid the identification of b- hadron candidates from the Higgs boson decay [40]. Track jets are built from charged particle tracks with p
T> 0.4 GeV and |η| < 2.5 that pass a set of hit and impact parameter criteria to minimize the impact of tracks from pile-up interactions, and are required to have track jet p
T> 10 GeV, |η| < 2.5, and at least two tracks clustered in the track jet. Track jets are associated with large-R jets using ghost association. The identification of b-hadrons relies on a multivariate tagging algorithm [41] which combines information from several vertexing and impact parameter tagging algorithms applied to a set of tracks in a region of interest around each track jet axis. The b-tagging requirements result in an efficiency of 77% for track jets containing b-hadrons, and a misidentification rate of ∼ 2% (∼ 24%) for light-flavoured (charm) jets, as determined in a sample of simulated t¯ t events. For MC samples the tagging e ffi ciencies are corrected to match those measured in data [42].
Muons are reconstructed by combining tracks in the inner detector and the muon system, and are required to satisfy “Tight” muon identification criteria [43]. The four-momentum of the closest muon candidate with p
T> 4 GeV and |η| < 2.5 that is within ∆ R = p
∆ η
2+ ∆ φ
2< 0.2 of a track jet is added to the calorimeter jet four-momentum to partially account for the energy carried by muons from semileptonic b-hadron decays. This muon correction results in a ∼ 5% resolution improvement for Higgs jets (defined in Section 5) [44]. Electrons are reconstructed from inner detector and calorimeter information, and are required to satisfy the “Loose” likelihood selection [45].
Leptons (electrons and muons, `) are also used in a “veto” to ensure the orthogonality of the analysis selection with respect to other heavy V H resonance searches in non-fully hadronic final states. The considered leptons have p
T> 7 GeV, |η| < 2.5 (2.47) for muons (electrons), and their associated tracks must have |d
0/σ
d0| < 3 (5) and |z
0sin θ| < 0.5 mm, where d
0is transverse impact parameters with respect to the beam line, σ
d0is the uncertainty on d
0, and z
0is the distance between the longitudinal position of the track along the beam line at the point where d
0is measured and the longitudinal position of the primary vertex. Leptons are also required to pass an isolation criterion, whereby the ratio of the p
Tsum of all tracks with p
T> 1 GeV (excluding the lepton’s) within a cone around the lepton (with radius dependent on the lepton p
T) to the lepton momentum must be less than a p
T- and |η|-dependent threshold I
0. I
0is defined such that a constant e ffi ciency of 99% as a function of p
Tand |η| is obtained for leptons in events with identified Z → `` candidates.
The missing transverse momentum ( E ~
missT) is calculated as the negative vectorial sum of the transverse momenta of all the muons, electrons, calorimeter jets with R = 0.4, and any inner-detector tracks from the primary vertex not matched to any of these objects [46]. The magnitude of the E ~
Tmissis denoted by E
Tmiss.
5 Event Selection
Events selected for this analysis must contain at least two large-R jets with |η| < 2.0 and invariant mass
m
J> 50 GeV, and cannot have any lepton candidate passing the veto for leptons. The leading p
Tlarge-R
jet must have p
T> 450 GeV, and the subleading p
Tlarge-R jet must have p
T> 250 GeV. The two
leading p
Tlarge-R jets are assigned as the Higgs and vector boson candidates, and the invariant mass of
the individual jets is used to determine the boson type; the large-R jet with the larger invariant mass is
assigned as the Higgs boson candidate jet (H-jet), while the smaller invariant mass large-R jet is assigned as the vector boson candidate jet (V -jet). In signal MC simulation, this procedure results in 99% correct assignment after the full signal region selections described below. Furthermore, the absolute value of the rapidity di ff erence, | ∆ y
12|, between the two leading p
Tlarge-R jets must be less than 1.6, exploiting the more central production of the signal compared to the multijet background. To ensure orthogonality with the ZH resonance search in which the Z boson decays to neutrinos, events are rejected if they have E
Tmiss> 150 GeV and ∆ φ( E ~
missT, H-jet) > 120 degrees.
The H-jet is further required to satisfy mass and b-tagging criteria consistent with expectations from a Higgs boson decaying to b b ¯ [40]. The H-jet mass, m
J,H, must satisfy 75 GeV < m
J,H< 145 GeV, which is ∼ 90% efficient for Higgs boson jets. The number of ghost associated b-tagged track jets is then used to categorize events. H-jets with either one or at least two b-tagged track jets, amongst the two leading p
Tassociated track jets, are used in this analysis. H-jets with one associated b-tagged track jet are not required to have two associated track jets. The Higgs tagging efficiency for double- (single-) b-tagged H-jets is ∼ 40% (∼ 75%) for H-jets with p
T≈ 500 GeV and ∼ 25% (∼ 65%) for H-jets with p
T≈ 900 GeV [44].
The V-jet must satisfy mass and substructure criteria consistent with a W- or Z-jet using a 50% efficiency working point, similar to the “Medium” working point in Reference [47]. To be considered a W (Z) candidate, the V-jet must have a mass m
J,Vwithin a p
T-dependent mass window which varies between m
J,V∈ [67, 95] ([75, 107]) GeV for jets with p
T≈ 250 GeV, and m
J,V∈ [60, 100] ([70, 110]) GeV for jets with p
T≈ 2500 GeV. The jet must also satisfy a p
T-dependent D
β2=1[48, 49] selection which depends on whether the candidate boson is a W or a Z, as described in Reference [47]. D
β2=1exploits two- and three-point energy correlation functions to tag boosted objects with two-prong decay structures. The V-jet tagging efficiency is ∼ 50% and constant in V -jet p
T, with a misidentification rate for jets from multijet production of ∼ 2%.
Four signal regions (SR) are used in this analysis, which differ by the number of b-tagged track jets associated to the H-jet and by whether the V-jet passes a Z-tag or W-tag selection. The “1-tag” and “2- tag” SR require exactly one and at least two b-tagged track jets associated to the H-jet, respectively. The 2-tag signal regions provide the larger sensitivity for resonances with masses below ∼ 2.5 TeV. Above 2.5 TeV the 1-tag regions provide higher sensitivity because the Lorentz boost of the Higgs boson is large enough to merge the fragmentation products of both b-quarks into a single track jet. Events in which the V-jet passes a Z-tag are denoted as the ZH signal regions, while events in which the V-jet passes a W-tag are denoted as the W H signal regions. While the 1-tag and 2-tag signal regions are orthogonal regardless of the V-jet tag, the W H and ZH selections are not orthogonal within a given b-tag category. The overlap between the W H and ZH selections in the signal regions is approximately 60%.
The final event requirement is that the mass of the candidate resonance built from the sum of the V -jet and
H-jet candidate four vectors, m
JJ, must be larger than 1 TeV. This requirement ensures a full e ffi ciency
for the trigger and jet p
Trequirements for events passing the full selection. The full event selection can
be found in Table 1. The expected selection efficiency for both W H and ZH resonances with a mass of 2
(3) TeV in the HVT benchmark Model B is ∼ 30% (∼ 20%).
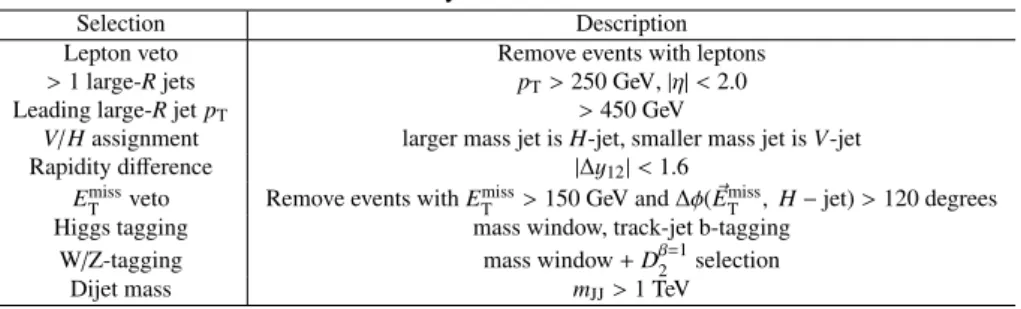
Table 1: Summary of event selection criteria.
Selection Description
Lepton veto Remove events with leptons
>1 large-Rjets pT>250 GeV,|η|<2.0
Leading large-RjetpT >450 GeV
V/Hassignment larger mass jet isH-jet, smaller mass jet isV-jet
Rapidity difference |∆y12|<1.6
Emiss
T veto Remove events withEmiss
T >150 GeV and∆φ(E~miss
T , H−jet)>120 degrees Higgs tagging mass window, track-jet b-tagging
W/Z-tagging mass window+Dβ=1
2 selection
Dijet mass mJJ>1 TeV
6 Background Estimation
After the selection of 1-tag and 2-tag events, ∼ 90% of the background in the signal regions originates from multijet events. The remaining ∼ 10% is predominantly t¯ t with a small contribution from V + jets ( . 1%). The multijet background is modeled directly from data, while other backgrounds are estimated from MC.
Multijet modeling starts from the same trigger and event selection as described above, but the H-jet is required to have zero associated b-tagged track jets. This 0-tag sample, which consists of ∼ 99% multijet events, is used to model the kinematics of the multijet background in the 1-tag and 2-tag SRs. To keep the 0-tag region kinematics close to the 1- and 2-tag regions, H-jets in 0-tag events must contain at least one (two) associated track jets when modeling the 1(2)-tag signal region.
The 0-tag sample is normalized to the 1-tag and 2-tag samples and corrected for kinematic di ff erences with respect to the signal regions. These kinematic differences arise from the b-tagging efficiency variations as a function of p
Tand |η| and because different multijet processes, in terms of quark, gluon, and heavy flavour content, contribute di ff erent fractions to the 0-, 1-, and 2-tag samples.
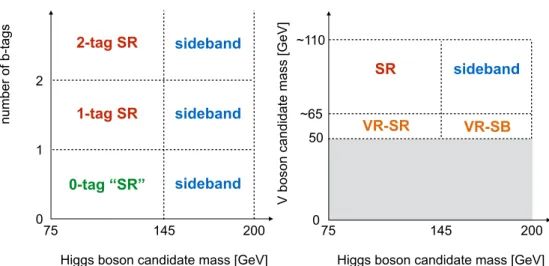
The 0-tag sample is normalized to the 1- and 2-tag samples, separately, using a signal-free high mass sideband of the H-jet defined by 145 GeV < m
J,H< 200 GeV. This sideband (SB), illustrated in Figure 1, is orthogonal to the signal region and has similar expected event yield to the signal region. The normal- ization of the multijet events is set by scaling the number of events in each region of the 0-tag sample by
µ
1(2)−tagMultijet= N
Multijet1(2)−tagN
Multijet0−tag= N
data1(2)−tag− N
t1(2)−tagt¯− N
V1(2)−tag+jetsN
data0−tag− N
t¯0−tagt− N
V0−tag+jets, (1)
where N
data0/1/2−tag, N
t¯0/1/2t −tagand N
V0/1/2+jets−tagare the number of events observed in data, and predicted from t¯ t and V + jets MC in the 0-, 1-, or 2-tag samples, respectively. As the selection of track jets for H-jets in 0-tag events differs when modeling the 1-tag and 2-tag regions (as stated above), N
Multijet0−tagdiffers between estimates of the µ
1Multijet−tagand µ
2Multijet−tag.
Kinematic corrections to the multijet background template are applied by reweighting events from the
0-tag sample. This is performed only for the 2-tag sample, as the modeling of the multijet background
in the 1-tag SB and validation regions (described below and as seen in Figure 1) without reweighting
is observed to be adequate. The weights are derived in the SB region, from third-order polynomial fits
to the ratio of the total background model to data in two distributions that are sensitive to kinematic
Higgs boson candidate mass [GeV]
1-tag SR
number of b-tags
sideband
sideband 1
0 2
0-tag “SR”
2-tag SR
sideband 145
75 200 75 145
SR
V boson candidate mass [GeV]
~65
50 VR-SB
Higgs boson candidate mass [GeV]
VR-SR
sideband
200
~110
0
Figure 1: Illustration of the sideband and validation regions, showing orthogonal slices through the space defined by the masses of the two boson candidates and the number ofb-tags.
and b-tagging e ffi ciency di ff erences between the 0-tag and 2-tag samples: the track jet p
Tratio, defined
as
plead T
plead
T +psublead
T
, and p
subleadT, both using the p
Tdistributions of the leading two p
Ttrack jets associated to the H-jet. The reweighting is performed using 1-D distributions but is iterated so that correlations between the two variables are taken into account. After each reweighting iteration, the value of µ
1(2)−tagMultijetis recomputed to ensure that the normalization is kept fixed. No explicit uncertainties are associated with this reweighting as these are determined from comparison with validation regions, as described below.
Due to the small number of events in the background prediction in the m
JJhigh mass tail, the backgrounds are modeled using fits between 1.2 and 4 TeV with power-law and exponential functions. The multijet background is modeled using the functional form
f
Multijet( x) = p
a(1 − x)
pb(1 + x)
pcx, (2)
while the t¯ t background is modeled using the functional forms
f
t¯1-tagt( x) = p
d(1 − x)
pex
pf, and (3)
f
t¯2-tagt( x) = p
ge
−phx(4)
for the 1-tag and 2-tag samples respectively. In these functional forms, x = m
JJ/ √
s, and p
athrough p
hare parameters determined by the fit. These functional forms are used as they can model changes in the power- law behavior of the respective backgrounds between high and low masses. The exponential function is used for the 2-tag t¯ t sample because it was found to model the tail of the distribution well and because a fit to the small statistics of the sample could not constrain a function with more parameters. Fits are performed separately for the 1-tag and 2-tag background estimates, and separately for each background.
The background model is validated in the two regions denoted as VR-SR and VR-SB in Figure 1, each
also with two sub-regions. In all of these, the V-jet is required to have mass 50 GeV < m
J,V< 70 GeV
but the D
β2=1selection is only applied in the subset regions. For the signal region-like validation regions
(VR-SR) the H-jet selection is unchanged, and for the sideband-like validation regions (VR-SB) the H-jet
is required to have mass 145 GeV < m
J,H< 200 GeV. Both validation regions are kinematically similar but orthogonal to the signal regions (and each other).
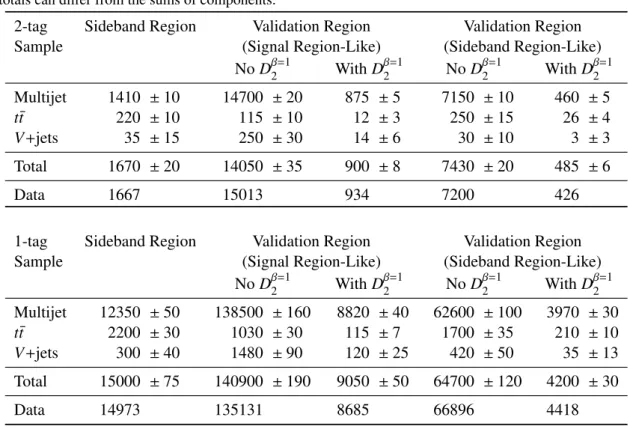
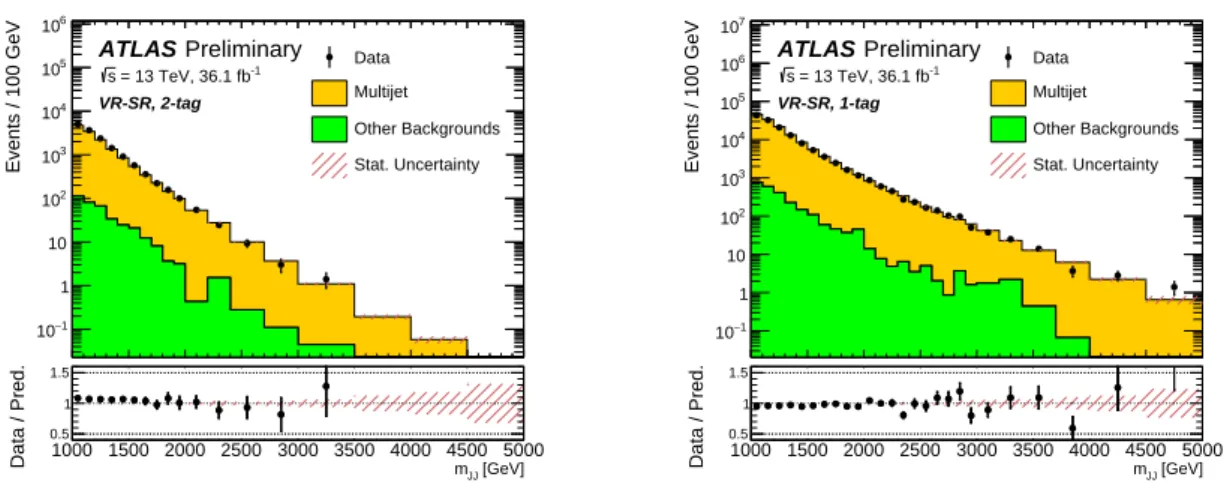
Table 2 compares the observed data yield in the validation regions with the corresponding background estimate. The modeling of the m
JJdistribution in the signal region-like validation region is shown in Figure 2 for the 1-tag and 2-tag samples. In both cases, the data are well described by the background model in both normalization and m
JJshape. Other kinematic variables are generally well described.
Table 2: The number of events in data and predicted background events in the sideband and validation regions. In the sideband, the data and background total agree by construction. The uncertainties are statistical only and scaled from the statistics in the 0-tag sample for multijet or MC statistics fortt¯andV+jets backgrounds. Due to rounding the totals can differ from the sums of components.
2-tag Sideband Region Validation Region Validation Region
Sample (Signal Region-Like) (Sideband Region-Like)
No D
β2=1With D
β2=1No D
β2=1With D
β2=1Multijet 1410 ± 10 14700 ± 20 875 ± 5 7150 ± 10 460 ± 5
t¯ t 220 ± 10 115 ± 10 12 ± 3 250 ± 15 26 ± 4
V +jets 35 ± 15 250 ± 30 14 ± 6 30 ± 10 3 ± 3
Total 1670 ± 20 14050 ± 35 900 ± 8 7430 ± 20 485 ± 6
Data 1667 15013 934 7200 426
1-tag Sideband Region Validation Region Validation Region
Sample (Signal Region-Like) (Sideband Region-Like)
No D
β2=1With D
β2=1No D
β2=1With D
β2=1Multijet 12350 ± 50 138500 ± 160 8820 ± 40 62600 ± 100 3970 ± 30
t¯ t 2200 ± 30 1030 ± 30 115 ± 7 1700 ± 35 210 ± 10
V + jets 300 ± 40 1480 ± 90 120 ± 25 420 ± 50 35 ± 13
Total 15000 ± 75 140900 ± 190 9050 ± 50 64700 ± 120 4200 ± 30
Data 14973 135131 8685 66896 4418
7 Systematic Uncertainties
The preliminary uncertainty on the combined 2015+2016 integrated luminosity is 3.2%. It is derived, following a methodology similar to that detailed in Reference [50], from a preliminary calibration of the luminosity scale using x − y beam-separation scans performed in August 2015 and May 2016.
Experimental systematic uncertainties a ff ect the signal as well as the t¯ t and V + jets backgrounds estimated
from MC simulation. The systematic uncertainties related to the scales of the large-R jet p
T, mass and
D
β2=1are of the order of 2%, 5% and 3%, respectively. They are derived [51] following the technique
described in Reference [34]. The impacts of the uncertainties on the resolutions of each of these large-R
jet observables are evaluated by smearing the jet observable according to the systematic uncertainties of
Events / 100 GeV
−1
10 1 10 102
103
104
105
106
Data Multijet Other Backgrounds Stat. Uncertainty = 13 TeV, 36.1 fb-1
s VR-SR, 2-tag
ATLAS Preliminary
[GeV]
mJJ
1000 1500 2000 2500 3000 3500 4000 4500 5000
Data / Pred.
0.5 1 1.5
Events / 100 GeV
−1
10 1 10 102
103
104
105
106
107
Data Multijet Other Backgrounds Stat. Uncertainty = 13 TeV, 36.1 fb-1
s VR-SR, 1-tag
ATLAS Preliminary
[GeV]
mJJ
1000 1500 2000 2500 3000 3500 4000 4500 5000
Data / Pred.
0.5 1 1.5
Figure 2: ThemJJ distribution in the signal region-like validation region in the (left) 2-tag (right) 1-tag samples, compared to the predicted background.
the resolution measurement [34, 47]. For the large-R jet p
Ta 2% absolute uncertainty is assigned, while for the mass and D
β2=1resolutions a relative 20% and 15% uncertainty is assigned, respectively. The uncertainty in the b-tagging efficiency for track jets is based on the uncertainty in the measured tagging e ffi ciency for b-jets in data following the methodology used in Reference [42]. This is measured as a function of b-jet p
Tand ranges between 2% and 8% for track jets with p
T< 250 GeV. For track jets with p
T> 250 GeV the uncertainty in the tagging efficiencies is extrapolated using MC simulation [42] and is approximately 9% for track jets with p
T> 400 GeV. A 30% normalization uncertainty is applied to the t¯ t background based on the ATLAS t¯ t di ff erential cross-section measurement [52]. Due to the small contribution of the V +jets background, no corresponding uncertainty is considered.
Systematic uncertainties in the normalization and shape of the data-based multijet background model are assessed from the validation regions. The background normalization predictions in the validation regions agree with the observed data to within ±5% in the 1-tag sample and ±13% in the 2-tag sample. These di ff erences are taken as the uncertainties in the predicted multijet yield. The shape uncertainty is derived by taking the ratio of the predicted background to the observed data after fitting both to a power law. This is done separately for the 1-tag and 2-tag samples. The larger of the observed shape differences in the VR-SR and VR-SB is taken as the shape uncertainty. Separate shape uncertainties are estimated for m
J Jabove and below 2 TeV in order to allow for independent shape variations in the bulk and tail of the m
J Jdistribution in the final statistical analysis.
An additional uncertainty in the shape of the multijet background prediction is assigned by fitting a variety of empirical functions designed to model power-law behavior to the 0-tag m
JJdistribution, as described in Reference [53]. The largest difference between the nominal prediction and the alternative fit functions is taken as a systematic uncertainty. Similarly, the fit range of the nominal power-law function is varied, and the largest difference between the nominal prediction and the alternative fit ranges is taken as a systematic uncertainty.
The impact of the main systematic uncertainties on event yields is summarized in Table 3.
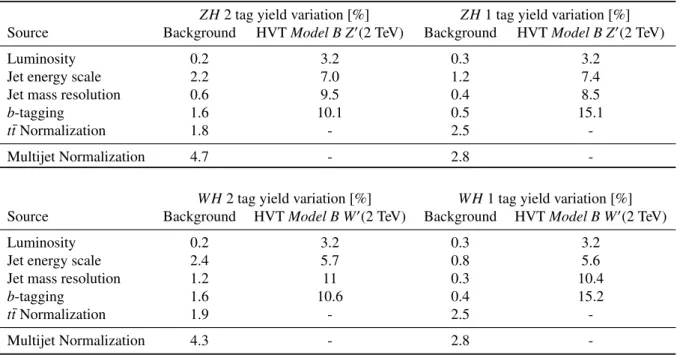
Table 3: Summary of the main post-fit systematic uncertainties (expressed as a percentage of the yield) in the background and signal event yields in the 1-tag and 2-tag signal regions. The values for the jet energy scale and b-tagging efficiency uncertainties represent the sum in quadrature of the values from the dominant components. The jet energy scale, jet mass resolution,b-tagging efficiency, luminosity and MC statistics uncertainties do not apply to the multijet contribution, which is determined from data. Uncertainties are provided for a resonance mass of 2 TeV in the context of the HVTModel B, for bothV0→W HandV0→ZHresonances.
ZH2 tag yield variation [%] ZH1 tag yield variation [%]
Source Background HVTModel B Z0(2 TeV) Background HVTModel B Z0(2 TeV)
Luminosity 0.2 3.2 0.3 3.2
Jet energy scale 2.2 7.0 1.2 7.4
Jet mass resolution 0.6 9.5 0.4 8.5
b-tagging 1.6 10.1 0.5 15.1
t¯tNormalization 1.8 - 2.5 -
Multijet Normalization 4.7 - 2.8 -
W H2 tag yield variation [%] W H1 tag yield variation [%]
Source Background HVTModel B W0(2 TeV) Background HVTModel B W0(2 TeV)
Luminosity 0.2 3.2 0.3 3.2
Jet energy scale 2.4 5.7 0.8 5.6
Jet mass resolution 1.2 11 0.3 10.4
b-tagging 1.6 10.6 0.4 15.2
tt¯Normalization 1.9 - 2.5 -
Multijet Normalization 4.3 - 2.8 -
8 Results
The results are interpreted using the statistical procedure described in Reference [1] and references therein. A test statistic based on the profile likelihood ratio [54] is used to test hypothesized values
of µ, the global signal strength factor, separately for each model considered. The statistical analysis
described below is performed using the m
JJdistribution of the data observed in the signal regions. The systematic uncertainties are modeled with Gaussian or log-normal constraint terms (nuisance parameters) in the definition of the likelihood function. The data distributions from the 1-tag and 2-tag signal regions are used in the fit simultaneously, treating systematic uncertainties on the luminosity, jet energy scale, jet energy resolution, jet mass resolution and b-tagging as fully correlated between the two signal regions.
Both the multijet normalization and shape uncertainties are treated as independent between the two signal regions. In addition, the multijet shape uncertainties for m
J Jabove and below 2 TeV are treated as inde- pendent. When performing the fit, the nuisance parameters are allowed to vary within their constraints to maximize the likelihood. As a result of the fit, the multijet shape uncertainties are significantly reduced.
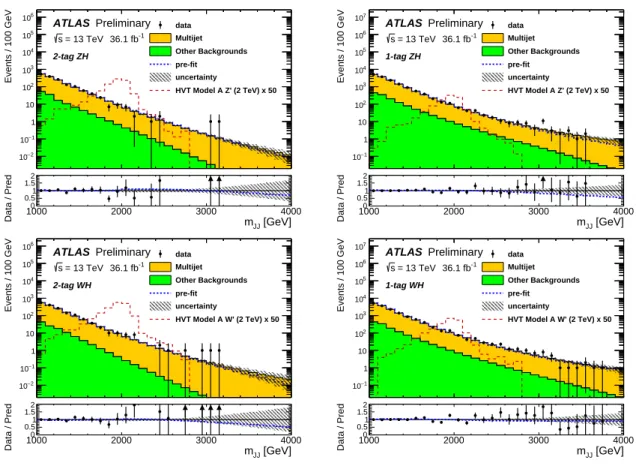
With the jet mass resolution, jet energy scale and multijet normalization, they have the largest impact on the search sensitivity. Fits in the W H and ZH signal regions are performed separately. The pre- and post-fit m
JJdistributions in the signal regions are shown in Figure 3.
The number of background events in the 1-tag and 2-tag ZH and W H signal regions after the fit, the
number of events observed in the data, and the predicted yield for a potential signal are reported in
Table 4. The total data and background yields in each region are constrained to agree by the fit. There is
Events / 100 GeV
−2 10
−1 10 1 10 102 103 104 105 106
data Multijet Other Backgrounds pre-fit uncertainty
HVT Model A Z' (2 TeV) x 50
ATLAS Preliminary 36.1 fb-1
= 13 TeV s 2-tag ZH
[GeV]
mJJ
1000 2000 3000 4000
Data / Pred
0 0.51 1.52
Events / 100 GeV
−1 10 1 10 102 103 104 105 106 107
data Multijet Other Backgrounds pre-fit uncertainty
HVT Model A Z' (2 TeV) x 50
ATLAS Preliminary 36.1 fb-1
= 13 TeV s 1-tag ZH
[GeV]
mJJ
1000 2000 3000 4000
Data / Pred
0 0.51 1.52
Events / 100 GeV
−2 10
−1 10 1 10 102 103 104 105 106
data Multijet Other Backgrounds pre-fit uncertainty
HVT Model A W' (2 TeV) x 50
ATLAS Preliminary 36.1 fb-1
= 13 TeV s 2-tag WH
[GeV]
mJJ
1000 2000 3000 4000
Data / Pred
0 0.51 1.5 2
Events / 100 GeV
−1 10 1 10 102 103 104 105 106 107
data Multijet Other Backgrounds pre-fit uncertainty
HVT Model A W' (2 TeV) x 50
ATLAS Preliminary 36.1 fb-1
= 13 TeV s 1-tag WH
[GeV]
mJJ
1000 2000 3000 4000
Data / Pred
0 0.51 1.5 2
Figure 3: ThemJJ distributions in theV H signal regions for data (points) and background estimate (histograms) after the likelihood fit for events in the (left) 2-tag and (right) 1-tag categories. The pre-fit background expectation is given by the blue dashed line. The expected signal distributions (multiplied by 50) for aV0boson with 2 TeV mass are also shown. In the data/prediction ratio plots, arrows indicate off-scale points.
a ∼ 60% overlap of data between the W H and ZH selections for both the 2-tag and 1-tag signal regions, and this fraction is approximately constant as a function of m
JJ.
8.1 Statistical Analysis
To determine if there are any statistically significant local excesses in the data, a test of the background- only hypothesis (µ = 0) is performed at each signal mass point. The significance of an excess is quantified using the local p
0value, the probability that the background could produce a fluctuation greater than or equal to the excess observed in data. A global p
0is also calculated for the most significant discrepancy, using background-only pseudo-experiments to derive a correction for the look-elsewhere e ff ect across the mass range tested [55]. The largest deviation from the background-only hypothesis is in the ZH signal region, occurring at m
JJ∼ 3.0 TeV with a local significance of 3.3 σ. The global significance of this excess is 2.2 σ.
The data are used to set upper limits on the cross-sections for the different benchmark signal processes.
Exclusion limits are computed using the CL
smethod [56], with a value of µ regarded as excluded at the
95% CL when CL
sis less than 5%.
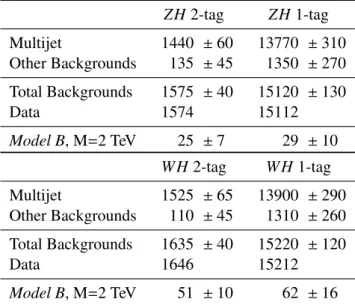
Table 4: The number of predicted background events in theV H1-tag and 2-tag signal regions after the fit, compared to the data. The "Other Backgrounds" entries include bothtt¯andV+jets. Uncertainties correspond to the total uncertainties in the predicted event yields, and are smaller for the total than for the individual contributions because the latter are anti-correlated. The yields form=2 TeVV0bosons decaying toV HinModel Bare also given. Due to rounding the totals can differ from the sums of components.
ZH 2-tag ZH 1-tag
Multijet 1440 ± 60 13770 ± 310
Other Backgrounds 135 ± 45 1350 ± 270 Total Backgrounds 1575 ± 40 15120 ± 130
Data 1574 15112
Model B, M=2 TeV 25 ± 7 29 ± 10 W H 2-tag W H 1-tag
Multijet 1525 ± 65 13900 ± 290
Other Backgrounds 110 ± 45 1310 ± 260 Total Backgrounds 1635 ± 40 15220 ± 120
Data 1646 15212
Model B, M=2 TeV 51 ± 10 62 ± 16
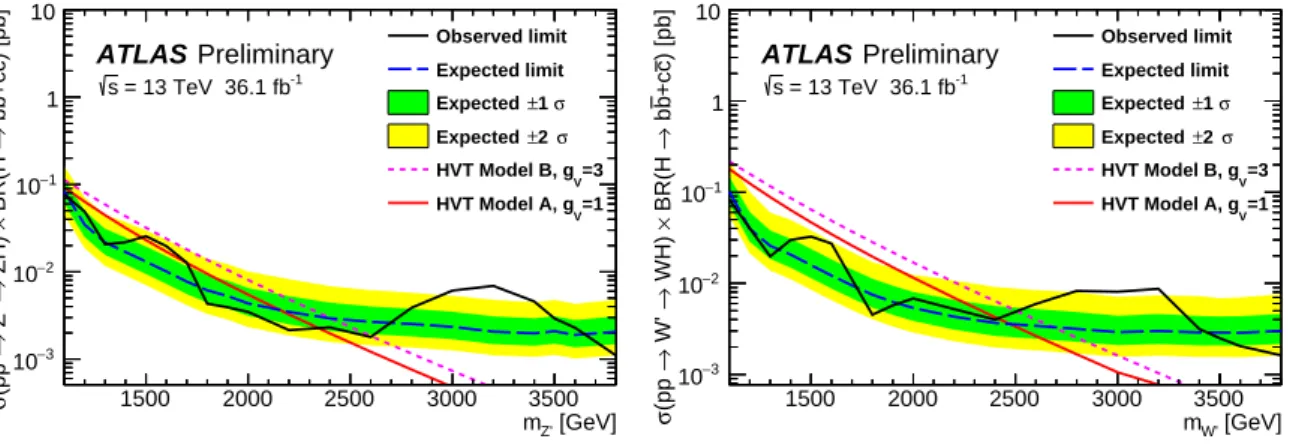
Figure 4 shows the 95% CL cross-section upper limits on HVT resonances for both Model A and Model B in the W H and ZH signal regions for masses between 1100 and 3800 GeV. Limits on σ( pp → V
0→ V H → q q ¯
(0)(b b ¯ + c¯ c))
3are set in the range of 83 fb to 1.6 fb and 77 fb to 1.1 fb in the W H and ZH signal regions, respectively. These cross-section limits are translated into excluded Model B signal mass ranges of 1100 – 2500 GeV for W H resonances and 1100 – 2600 GeV for ZH resonances. The corresponding excluded mass ranges for Model A are 1100 – 2400 GeV for W H resonances, and 1100 – 1480 GeV and 1700 – 2350 GeV for ZH resonances.
9 Summary
A search for resonances decaying to a W or Z boson and a Higgs boson has been carried out in the q q ¯
(0)b b ¯ channel with 36.1 fb
−1of pp collision data collected by ATLAS during the 2015 and 2016 runs of the LHC at √
s = 13 TeV. Both the vector boson and Higgs boson candidates are reconstructed using large radius jets, and jet mass and substructure observables are used tag W, Z and Higgs boson candidates and suppress the dominant multijet background. In addition, small radius b-tagged track jets ghost-associated to the large-R jets are exploited to select the Higgs boson candidate jet. The data are in agreement with the Standard Model expectations, with the largest excess observed at m
JJ∼ 3.0 TeV with a local significance of 3.3 σ. The global significance of this excess is 2.2 σ. Upper limits on the production cross-section times branching ratio to the q q ¯
(0)b b ¯ final state are set for resonance masses in the range between 1.1 and 3.8 TeV with values ranging from 83 fb to 1.6 fb and 77 fb to 1.1 fb (at 95% CL) for W H and ZH
3The signal samples contain Higgs boson decays tobb¯andc¯c, but due to the branching ratios andb-tagging requirements the sensitivity is dominated byH→bb.¯
[GeV]
mZ'
1500 2000 2500 3000 3500
) [pb]c+cb b→ BR(H × ZH) → Z' →(pp σ
−3
10
−2
10
−1
10 1 10
Preliminary ATLAS
= 13 TeV 36.1 fb-1
s
Observed limit Expected limit σ
±1 Expected
σ
±2 Expected
V=3 HVT Model B, g
V=1 HVT Model A, g
[GeV]
mW'
1500 2000 2500 3000 3500
) [pb]c+cb b→ BR(H × WH) → W' →(pp σ
−3
10
−2
10
−1
10 1 10
Preliminary ATLAS
= 13 TeV 36.1 fb-1
s
Observed limit Expected limit σ
±1 Expected
σ
±2 Expected
V=3 HVT Model B, g
V=1 HVT Model A, g
Figure 4: The observed and expected cross-section upper limits at the 95% confidence level forpp→V0→V H→ qq¯(0)(bb¯+c¯c) inModel AandModel Bin the (left)ZHand (right)W Hsignal regions. The red and magenta curves show the predicted cross-sections as a function of resonance mass for the models considered.
resonances, respectively. The corresponding excluded Heavy Vector Triplet Model B signal mass ranges
are 1.10 – 2.50 TeV for W H resonances, and 1.10 – 2.60 TeV for ZH resonances.
Appendix
Figure 5 shows the p-value as a function of resonance mass for both channels.
[GeV]
mZ'
1500 2000 2500 3000 3500
0Local p
−6
10
−5
10
−4
10
−3
10
−2
10
−1
10 1 10
σ 1
σ 2
σ 3
σ 4
Preliminary ATLAS
ZH Analysis = 13 TeV L = 36.1 fb-1
s
Observed
[GeV]
mW'
1500 2000 2500 3000 3500
0Local p
−6
10
−5
10
−4
10
−3
10
−2
10
−1
10 1 10
σ 1
σ 2
σ 3
σ 4
Preliminary ATLAS
WH Analysis = 13 TeV L = 36.1 fb-1
s
Observed
Figure 5: p-value as a function of resonance mass for the (left)ZHand (right)W Hchannels.
Figure 6 shows the signal acceptance × e ffi ciency as a function of resonance mass.
Resonance Mass [GeV]
1000 1500 2000 2500 3000 3500 4000 4500 5000
Efficiency × Acceptance
0 0.1 0.2 0.3 0.4 0.5 0.6
2-tag SR (WH) 1-tag SR (WH) 2-tag SR (ZH) 1-tag SR (ZH)
ATLAS Simulation Preliminary
= 13 TeV s
Figure 6: Signal acceptance×efficiency as a function of resonance mass.