A TLAS-CONF-2018-052 27 November 2018
ATLAS CONF Note
ATLAS-CONF-2018-052
26th November 2018
Search for boosted resonances decaying to two b-quarks and produced in association with a jet at √
s = 13 TeV with the ATLAS detector
The ATLAS Collaboration
A search for new resonances decaying into a pair of bottom quarks in the merged regime is reported using an integrated luminosity of 80.5 fb − 1 of proton-proton collisions at
√ s = 13 TeV recorded by the ATLAS detector at the Large Hadron Collider. For the resonance to be merged, an extra jet with high transverse momentum is required. The mass range from 70 to 230 GeV is inspected. For the Standard Model Higgs boson, the observed signal strength is µ H = 5 . 8 ± 3 . 1 (stat.) ± 1 . 9 (syst.) ± 1 . 7 (th.), consistent with the background-only hypothesis at 1 . 6 standard deviations. No evidence of a significant excess of events beyond the expected background is found and limits on leptophobic Z 0 bosons with democratic axial couplings to all quark generations are set in the probed mass range.
© 2018 CERN for the benefit of the ATLAS Collaboration.
1 Introduction
Analyses searching for dijet resonances have been thoroughly explored by the LHC experiments [1–3]. The main focus of these analyses are resonances at high masses, with the lowest mass boundary being dictated by the trigger and data-acquisition systems of the experiments. Searching for resonances below the TeV mass range is well motivated and alternative approaches employing more sophisticated trigger or analysis strategies has flourished within the ATLAS and CMS collaborations when analysing the pp collision data provided by the LHC [4–11].
An analysis searching for boosted resonances decaying to a pair of bottom quarks using an integrated luminosity of 80.5 fb − 1 of proton-proton collisions at
√ s = 13 TeV is presented. For the resonance to be boosted, an extra jet with high transverse momentum ( p T ) is required to be present in the event. The decay products of a hadronically-decaying resonance can be reconstructed in a single jet with a large radius parameter (large- R jet), vastly reducing the amount of background from Standard Model (SM) processes. The final state of interest therefore consists of a signal large- R jet plus an additional jet. The additional jet is also taken with a large-radius cone to simplify the analysis and the propagation of the related uncertainties.
Many physics models predict low-mass dijet resonances decaying to bottom quarks. Yukawa couplings being proportional to the mass of the decay particle favour decays to b -quarks if the resonance mass is lower than two-times the top-quark mass, as is true for the Higgs boson. Although the Higgs boson has been discovered in Refs. [12, 13] and its coupling with bottom quarks recently observed in Refs. [14, 15], an inclusive analysis also targeting the gluon-fusion production mode and the decay to b -quarks was conducted only recently in Ref. [16]. At high p T , the Higgs boson production starts being sensitive to the top-quark loop in the gluon-fusion production mode [17], including possible contributions from new resonances, and to the presence of anomalous couplings that give rise to an effective gluon-gluon-Higgs interaction. In the presence of new physics contributions, increases in the high- p T Higgs boson production are predicted to be as high as 50% [18]. A leptophobic Z 0 decaying to two quarks with a mass ranging between 100 and 200 GeV is also searched for.
2 The ATLAS detector
The ATLAS experiment [19] at the LHC is a multi-purpose particle detector with a forward-backward symmetric cylindrical geometry and a near 4 π coverage in solid angle1. It consists of an inner tracking detector surrounded by a thin superconducting solenoid providing a 2 T axial magnetic field, electromagnetic and hadronic calorimeters, and a muon spectrometer. The inner tracking detector covers the pseudorapidity range |η| < 2 . 5. It consists of, in ascending order of radius from the beam-line, silicon pixel, silicon microstrip (SCT), and transition radiation tracking detectors. The pixel detectors are crucial for b -jet identification. For the second LHC data-taking period at
√ s = 13 TeV a new inner pixel layer, the Insertable B-Layer (IBL) [20, 21], was added at a mean sensor radius of 3.2 cm from the beam-line. The calorimeter system covers the pseudorapidity range |η| < 4 . 9. Within the region |η | < 3 . 2, electromagnetic calorimetry is provided by barrel and endcap high-granularity lead/liquid-argon (LAr) electromagnetic calorimeters. An
1 ATLAS uses a right-handed coordinate system with its origin at the nominal interaction point (IP) in the centre of the detector and the z axis along the beam pipe. The x-axis points to the centre of the LHC ring, and the y axis points upwards. Cylindrical coordinates (r, φ ) are used in the transverse plane, φ being the azimuthal angle around the z-axis. The pseudorapidity η is defined in terms of the polar angle θ as η = − ln tan ( θ / 2 ) . Angular distance is measured in units of ∆R = p
∆η 2 + ∆φ 2 .
additional thin LAr presampler, covering |η| < 1 . 8, is used to correct for energy loss in material upstream of the calorimeters. Hadronic calorimetry is provided by a steel/scintillator-tile calorimeter, segmented into three barrel structures within |η| < 1 . 7, and two copper/LAr hadronic endcap calorimeters. The solid-angle coverage is completed with forward copper/LAr and tungsten/LAr calorimeter modules optimised for electromagnetic and hadronic measurements, respectively. The muon spectrometer is composed of separate trigger and high-precision tracking chambers, measuring the deflection of muons in a magnetic field generated by superconducting air-core toroids. The precision chamber system covers the region |η| < 2 . 7 with three layers of monitored drift tubes, complemented by cathode strip chambers in the forward region, where the particle flux is highest. The muon trigger system covers the range |η | < 2 . 4 with resistive plate chambers in the barrel, and thin-gap chambers in the endcap regions. A two-level trigger system, using custom hardware followed by a software-based level, is used to reduce the event rate to a maximum of around 1 kHz for offline storage [22].
3 Data and simulated event samples
The data were collected by the ATLAS detector in pp collisions at the LHC with a centre-of-mass energy of 13 TeV during the years 2015, 2016 and 2017. The data used correspond to an integrated luminosity of 80.5 fb − 1 . Events used for this search were recorded using a trigger requiring the presence of at least one reconstructed anti- k t jet with radius parameter R = 1.0 [23]. The trigger threshold ranged between p T > 360 GeV and 460 GeV across the years and was adapted following the different instantaneous luminosity profiles and the inclusion of pile-up suppressing techniques at the trigger level [24].
Monte Carlo (MC) samples of the expected backgrounds are used for developing the non-resonant background estimation procedure and for modelling the resonant backgrounds themselves, as detailed in Section 6.
Simulated QCD dijet events were generated using the Pythia 8.186 [25] generator with the NNPDF 2.3 at next-to-leading order (NLO) parton distribution function [26] and the A14 set of tuned parameters (tune) [27]. To maintain a constant statistical power over a large energy range, the weighted events were generated with a flat jet p T spectrum and split into several samples. The hadronically decaying W and Z events, with up to 4 additional partons, were generated using Sherpa 2.1.1 [28] with the CT10 [29] parton distribution function. Matrix elements were calculated at leading order (LO) and the cross sections were corrected to NLO using K -factors derived from corresponding samples with leptonic vector-boson decays generated at NLO. The procedure, described in Ref. [5], results in a K -factor of 1.28 for W + jets and 1.38 for Z + jets with relative uncertainties of 10% based on the analysis described in Ref. [30]. To evaluate the uncertainty due to the choice of MC generator, an alternative set of hadronically decaying W and Z samples were generated using Herwig++ 2.7 [31] with the CTEQ6L1 [32] parton distribution function.
The simulated t t ¯ events were generated at tree-level using Powheg-Box 2 [33–35] and the NNPDF 2.3
NLO parton distribution function. The hadronization was performed using Pythia 8.230 [36] with the A14
tune and the NNPDF 2.3 LO parton distribution function. To evaluate the uncertainty due to the choice of
MC generator, a second set of t t ¯ events was generated by Sherpa 2.2.1 using the NNPDF 3.0 NNLO parton
distribution functions [37]. A sample containing single-top events in the Wt channel was generated at
tree-level using Powheg-Box 2 with the NNPDF 3.0 parton distribution function. The process is showered
using Pythia 8.230 configured with the A14 tune and the NNPDF 2.3 LO parton distribution function.
The signal samples considered are the Standard Model Higgs boson decaying to two b -quarks and a leptophobic Z 0 with democratic axial coupling (g q ) to all quark generations. Several Higgs boson samples were simulated corresponding to the three main production mechanisms; gluon-gluon fusion ( ggF ), vector boson fusion ( V BF ) and Higgs-strahlung ( W/Z associated production). All contribute in a non-negligible manner to the signal region. The ggF and V BF Higgs boson events were generated at NLO with top-mass-effect corrections following the MiNLO procedure [38, 39] using Powheg-Box 2 [40, 41] with the NNPDF 3.0 NNLO parton distribution function. They were showered using Pythia 8.212 with the AZNLO [42] tune and the CTEQ6L1 parton distribution function. The Higgs boson events produced in association with a W or Z boson and initiated by quarks were generated using Pythia 8.212 with the AZNLO tune and the CTEQ6L1 parton distribution function. The cross-sections are then scaled to the LHCHXSWG recommendation [43], including extra factors to account for Z H production initiated by gluons, which were not generated in the utilized samples. All decay modes of the vector boson were enabled. The MiNLO procedure, with finite top-mass effects, is known to be a good approximation of the ggF Higgs production at NNLO with parton shower matching and at high transverse momentum, with an inclusive cross section of 29 +24% − 21% fb for matrix-element level Higgs bosons with p T > 400 GeV, which is consistent with fixed-order calculations at NNLO with top-mass effects corrections [39].
The events containing a leptophobic Z 0 decaying to two quarks and produced in association with a jet were generated using a Simplified Dark Matter (DM) model [44] implemented in MadGraph5_aMC@NLO [45]
with the NNPDF 3.0 LO parton distribution function. The showering was performed using Pythia 8.212 with the A14 tune and the NNPDF 2.3 LO parton distribution function. Signal samples were generated at several Z 0 masses spanning the search region. The values of m Z 0 are between 100 and 200 GeV in steps of 25 GeV. The simplified model defines an absolute axial coupling, g q , to an quark-antiquark pair that is taken to be the same for all generations. The signal events were simulated with g q = 0 . 25. The specific value does not have a significant effect on the kinematics of the reconstructed events because the natural width of the Z 0 is smaller than the large- R jet mass resolution. The cross-section at other values can be obtained by scaling as g q 2 . The calculation was implemented using the DM width calculator in Ref. [46].
The DM particle mass is set to 10 TeV to not alter the Z 0 branching ratios.
All simulated events were created using the full detector simulation in Geant 4 [47, 48] and the same event recontruction algorithms were used as for the data. The decay of b - and c -hadrons, with the exception of the events generated by Sherpa, is consistently performed using EvtGen [49]. To account for the presence of multiple interactions in the same and neighbouring bunch crossings (pile-up), all samples were overlayed with minimum bias events simulated using Pythia 8.1 with the A3 tune [50] and the NNPDF 2.3 LO parton distribution function. All simulated events are weighted to match the pile-up distribution observed in the data.
4 Event reconstruction
The analysis makes use of the reconstruction of large- R jets with b -tagging applied to the associated small- R jets. The associated small- R jets are track-jets with the radius dependent on their p T (variable-radius track-jets). Muons are used to define a t t ¯ control region as detailed in Section 6.
Collision vertices are reconstructed from at least two reconstructed tracks with transverse momentum p T > 0 . 5 GeV. The primary vertex is selected as the one with the highest Í
p 2
T , calculated considering all
associated tracks with p T > 0 . 5 GeV.
Large-radius jets are reconstructed from topological clusters of energy deposited in the calorimeters using the anti- k t algorithm with radius parameter of R = 1 . 0 and are trimmed [51] to improve the mass resolution and reduce dependence on pile-up. The input clusters are calibrated using the local calibration method [52].
The trimming is achieved by reclustering the constituents of the initial jet, using the k t algorithm [53, 54], into smaller R = 0 . 2 subjets and then by removing any subjet that has a p T less than 5% of the p T of the parent jet [55]. The jet energy and pseudorapidity is corrected using p T - and η -dependent calibrations derived from simulation [56]. The jet mass is calibrated by deriving p T - and η -dependent calibration factors and by combining calorimeter and tracking information as described in Ref. [57]. A smaller mass resolution and a better estimate of the median mass value is obtained than using only calorimeter energy clusters. Only trimmed large- R jets with p T > 250 GeV and |η| < 2 are considered in the final selection.
Track-jets are clustered using the variable-radius jet algorithm [58, 59] with ρ = 30 GeV, R min = 0 . 02 and R max = 0 . 4 on a subset of the reconstructed tracks. The R min and R max parameters, respectively, control the minimum and maximum cone size, preventing the jets from becoming too large at low p T and going beyond the detector resolution at high p T . The ρ parameter instead determines how fast the jet size decreases with the jet p T . The considered tracks are required to have p T > 0 . 5 GeV and |η| < 2 . 5, at least 7 hits in the SCT and pixel detector layers, no more than one hit shared by multiple tracks in the pixel detector, no more than one missing hit in the pixel detector and no more than two missing hits in the SCT detector. Fake tracks and tracks originating from pile-up vertices are suppressed by requiring the longitudinal impact parameter ( z 0 ) to be within | z 0 · sin θ | < 3 mm of the primary vertex. Only track-jets with p T > 10 GeV, |η| < 2 . 5, at least two track constituents and satisfying ∆R/ min R > 1, with min R the smallest radius of the track-jets and ∆R the distance among any pair of them, are considered. The last requirement discards collinear track-jets to prevent anomalous b -tagging response. The signal efficiency is not affected by imposing this requirement. The reconstructed track-jets are ghost-associated [60] to the large- R jets before trimming.
Track-jets containing b -hadrons are identified using the multivariate b-tagging algorithm MV2c10 [61], which makes use of observables with discriminating information provided by an impact parameter algorithm, an inclusive secondary vertex finding algorithm and a multi-vertex finding algorithm. The MV2c10 algorithm is applied to a set of charged-particle tracks that satisfy quality and impact-parameter criteria and are matched to reconstructed track-jets. Two b -tagging requirements are employed in the analysis for defining the signal and control regions that, respectively, correspond to efficiencies of 77% and 85% for b -jets with p T > 20 GeV when evaluated in a sample of simulated tt events. These two requirements are referred to as ‘tight’ and ‘loose’ working points in the following. Scale factors to account for efficiency differences observed in data and simulated events are applied.
Muons are reconstructed by combining tracks in the inner detector with tracks in the muon spectrometer and are required to have p T > 10 GeV, |η | < 2 . 5 and pass the ‘medium’ identification and the ‘loose’
isolation working points [62] to supress fake reconstucted muons.
5 Event selection
Events containing jets induced by calorimeter noise bursts, beam-induced background or cosmic rays
are removed using the same criteria as in Ref. [63]. At least one reconstructed vertex and at least two
large- R jets are then required. Events are further preselected by requiring the leading large- R jet to satisfy
p T > 480 GeV and the sub-leading one p T > 250 GeV. The requirement on the leading large- R jet ensures
full trigger efficiency across years.
0 50 100 150 200 250 jet mass [GeV]
R Signal candidate large- 0
0.2 0.4 0.6 0.8 1 1.2
Fraction
BB CC CL
BL LL BC
Pythia 8 QCD - SR = 13 TeV s Simulation,
Preliminary ATLAS
(a)
0 50 100 150 200 250
jet mass [GeV]
R
Signal candidate large-
−2
10
−1
10 1
Arbitrary Units
CR
QCDPythia 8 QCD SR
= 13 TeV s Simulation,
Preliminary
ATLASSearch Region
0 50 100 150 200 250
jet mass [GeV]
R Signal candidate large- 0.8
0.9 1.1 1 SR CR
QCD1.2
(b)
Figure 1: (a) Predicted flavour composition of the dijet background in the SR based on the truth-matched hadron content of the two leading- p T track-jets associated to the signal candidate large- R jet, with the B/C labels indicating the presence of a b / c -quark and L indicating the presence of a light quark or a gluon. (b) The expected shape of the dijet background in the SR and CR QCD normalised to the same event count between 70 GeV < m J < 230 GeV.
Next the large- R jet assumed to contain the decay products of the Z 0 or Higgs boson, referred to as the signal jet candidate in the following, is chosen as the highest- p T large- R jet among those passing the following requirements: large- R jet p T > 480 GeV, at least two associated track-jets and 2 m J /p T < 1 with m J being the invariant mass of the large- R jet. The last requirement ensures that boosted decays are selected.
The events are further classified based on the number of b -tagged jets in the two leading- p T track-jets associated to the signal jet candidate. Events with exactly 0 loose b -tagged track-jets form the control region for the non-resonant background estimation studies (CR QCD ). Events with exactly 2 tight b -tagged track-jets form the signal region (SR). The 77% b -tagging working point used in the SR was optimised for best signal significance. The mass range considered in the analysis is from 70 GeV to 230 GeV. The lower bound is selected to avoid turn-on effects while the upper bound excludes high masses not resulting in merged decays.
Figure 1 (left) shows how the dijet background in the SR is dominated by double b -quarks plus combinations of ( b - or c -) quarks. Events with no heavy ( b - or c -) quarks make up only 5%. Figure 1 (right) shows the simulated distribution of the signal candidate large- R jet mass of the dijet background in the SR and CR QCD and how the shapes are close to each other in the mass range of interest. The signal region has a higher turn-on curve ending roughly at 70 GeV which is not included in the analysis.
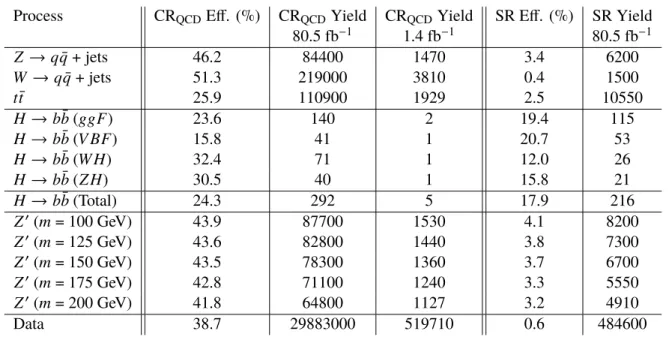
The efficiencies and yields in the CR QCD and SR for the considered resonant backgrounds and the Higgs
boson and Z 0 signals are shown in Table 1. The composition of the vector boson, t¯ t and H → b b ¯ resonant
components in the SR and CR QCD is shown in Table 2. The vector boson component is dominated by the
W boson in the CR QCD . However, as expected by imposing the b -tagging requirement, Z → b b ¯ is the
main contribution in the SR. The t t ¯ contribution is divided equally in the two regions with ∼ 60% coming
from hadronic decays, ∼ 40% from semi-leptonic events and only a small percentage from di-leptonic
decays of the top quarks. The H → b b ¯ component is mainly produced via ggF in all regions, contributing
53% of the Higgs boson signal in the SR. The alternative production mechanisms also contribute in a
non-negligible manner; VBF production contributes 25% and Higgs-strahlung the remaining 22%. This
Process CR QCD Eff. (%) CR QCD Yield CR QCD Yield SR Eff. (%) SR Yield
80.5 fb − 1 1.4 fb − 1 80.5 fb − 1
Z → q q ¯ + jets 46.2 84400 1470 3.4 6200
W → q q ¯ + jets 51.3 219000 3810 0.4 1500
t¯ t 25.9 110900 1929 2.5 10550
H → b b ¯ ( ggF ) 23.6 140 2 19.4 115
H → b b ¯ ( V BF ) 15.8 41 1 20.7 53
H → b b ¯ ( W H ) 32.4 71 1 12.0 26
H → b b ¯ ( Z H ) 30.5 40 1 15.8 21
H → b b ¯ (Total) 24.3 292 5 17.9 216
Z 0 ( m = 100 GeV) 43.9 87700 1530 4.1 8200
Z 0 ( m = 125 GeV) 43.6 82800 1440 3.8 7300
Z 0 ( m = 150 GeV) 43.5 78300 1360 3.7 6700
Z 0 ( m = 175 GeV) 42.8 71100 1240 3.3 5550
Z 0 ( m = 200 GeV) 41.8 64800 1127 3.2 4910
Data 38.7 29883000 519710 0.6 484600
Table 1: The efficiencies and yields in the CR QCD and SR for the non-QCD background, the Higgs boson and Z 0 boson signals and data. The yields in the CR QCD are given for the full luminosity 80.5 fb − 1 and for the luminosity employed, as explained in Section 6, for the background estimate of the non-resonant dijet process. The efficiencies are relative to leading large- R jet p T > 480 GeV requirement.
CR QCD SR V + jets Z + jets 0.28 0.80
W + jets 0.72 0.20 t t ¯
All hadronic 0.58 0.63 Semi-leptonic 0.38 0.34
Dileptonic 0.04 0.03
H → b b ¯
ggF 0.49 0.53
V BF 0.17 0.25
W H 0.21 0.12
Z H 0.12 0.10
Table 2: The fractional composition of the different resonant contributions in the defined regions. The fraction is evaluated using the given contribution type as the total.
indicates that a dedicated Higgs boson analysis with selection optimized for each of the production modes could improve the sensitivity of the search.
6 Background modelling
The dominant background contribution in the SR is the non-resonant dijet process. Its estimate through
MC is not reliable due to the statistical precision and the underlying accuracy of the event generation. A
data-driven estimate is therefore employed by fitting the mass distribution m J in the SR with a parametric
function and by validating the procedure using the data in the CR QCD . The shapes of the Z + jets and
W + jets contributions are taken from MC while their normalisation is fitted to data. The t¯ t contribution is
also estimated from MC with extra scale factors taken from a specific control region, denoted as CR tt in the following.
The background estimation procedure is tested on the CR QCD . It is found that the statistical precision in
∼ 1 fb − 1 of CR QCD data is comparable to the SR when using the luminosity of 80.5 fb − 1 . The CR QCD is therefore sliced into independent datasets used as probes for fitting the dijet background in the SR. The CR QCD slices are constructed by grouping adjacent data runs. A total of about 60 slices is formed, with an average of 1.4 fb − 1 of data per slice.
To find a parametric function that fits the dijet background well, the following family of polynomial exponential functions is considered:
f n
x
θ ®
= θ 0 exp Õ n
i =1
θ i x i
!
, (1)
where x = (m J − 150 GeV )/ 80 GeV and θ i are the parameters of the fit. The parameterization of the polynomial exponential function maps the independent variable to x ∈ [− 1 , 1 ] for the fit range of [ 70 , 230 ] GeV, which is empirically seen to provide improved numerical stability.
A slice is chosen randomly for performing studies to select the appropriate fit function. The Z + jets, W + jets and t¯ t contributions, scaled by their cross sections times the luminosity, are subtracted. The t¯ t contribution is corrected using the scale factor derived from the CR tt . A likelihood ratio test, in combination with Wilks’
theorem [64], and the F -test [65] are both used to determine the minimum number of model parameters to describe the shape of the distribution. With the former preferring a five-parameter model and latter favouring a four-parameter model, the five-parameter model is chosen to be conservative.
The fit is performed by adding the templates for the Z + jets, W + jets, t¯ t and single top contributions. The fit function is validated using the data slices previously described. Within the statistical precision given by the different data slices, the χ 2 /ndf from the individual fits follows the expected distribution of a good fit.
Boosted t t ¯ events represent a significant background contribution in the SR. The t¯ t yield in the SR is corrected with a data-driven normalization scale factor obtained by fitting the t t ¯ MC template in the CR tt . The CR tt is achieved by requiring a muon from the semi-leptonic decay from the top quark in the opposite hemisphere of the top selected as the signal jet candidate.
The t t ¯ events show the expected back-to-back topology of the muon and signal jet candidate, hence a
∆φ > 2 π/ 3 requirement between the muon and the signal jet candidate greatly reduces the contribution from muons coming from dijet and V + jets processes. Additional requirements on muon p T > 40 GeV and
∆R < 1 . 5 between the muon and the closest jet, plus a b -tagged jet at the loose working point are required to eliminate soft muons from dijet events. The resulting CR tt is 90% pure in t t ¯ events. The t¯ t MC template is fitted to the CR tt data in the large- R mass region between 100 and 200 GeV. A normalisation factor of 0.84 is extracted and used to constrain the t t ¯ contribution in the final fit to the SR.
7 Systematic uncertainties
Sources of systematic uncertainty that could potentially result in biases in the search are related to
experimental calibrations and to MC modeling of signal and background processes. These uncertainties
contribute both to the uncertainties in the overall yield (“normalisation”) and differential shape of the large- R jet mass observable (“shape”) that is used in the statistical procedure for the final search.
Systematic uncertainties associated with the QCD background are estimated with pseudoexperiments.
Poissonian toys are generated from the QCD component of the fit in the SR containing all components (QCD, V + jets, t¯ t and exotic signal or Higgs boson components) and no nuisance parameters. The toys are refitted with the nominal QCD function, and an alternative parametric function (formal Laurent series [66]).
These two sets of fits to toys, nominal and alternative, provide a measure of the statistical uncertainty on the QCD parametrization (the spread of fit parameters) and of the systematic uncertainty from the choice of fitting function (the difference between the two fitted shapes).
Uncertainties affecting all MC templates are related to the large- R jet energy and mass calibrations [67] and the calibration of the MV2c10 algorithm [61], which impacts different jet flavors with different magnitudes.
Large- R jet energy and mass calibration uncertainties affect both the shape and normalisation of the utilized MC templates, therefore, their impact on the analysis is assessed by varying the jet energy and mass within their uncertainties and propagating those variations through the analysis chain. The effect of the jet energy resolution uncertainty is also tested and found to be negligible. The impact of uncertainties on the calibration of MV2c10 have been found to be independent of the large- R jet mass for both the signal and background samples, and hence only affecting the signal normalisation.
Extra shape uncertainties are applied to the V + jets and t¯ t MC templates related to modeling uncertainties.
To assess these uncertainties, the large- R jet mass shapes from two different MC generators are compared in both cases. For the V + jets component, the nominal shape, generated using Sherpa 2.1.1, is compared to an alternative shape, generated using Herwig++ 2.7. Similarly, for the t t ¯ component, the comparison is performed between the nominal Powheg-Box 2 shape, and the Sherpa 2.2.1 alternative shape.
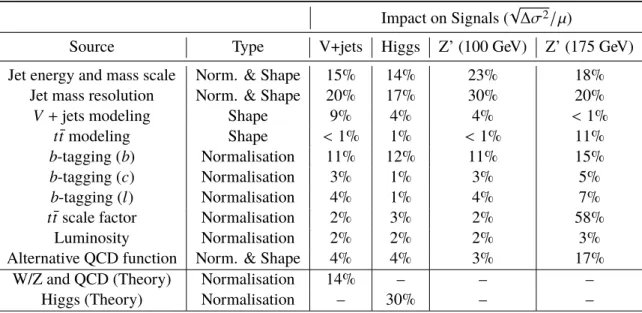
Impact on Signals (
√ ∆σ 2 /µ )
Source Type V+jets Higgs Z’ (100 GeV) Z’ (175 GeV)
Jet energy and mass scale Norm. & Shape 15% 14% 23% 18%
Jet mass resolution Norm. & Shape 20% 17% 30% 20%
V + jets modeling Shape 9% 4% 4% < 1%
t t ¯ modeling Shape < 1% 1% < 1% 11%
b -tagging ( b ) Normalisation 11% 12% 11% 15%
b -tagging ( c ) Normalisation 3% 1% 3% 5%
b -tagging ( l ) Normalisation 4% 1% 4% 7%
t¯ t scale factor Normalisation 2% 3% 2% 58%
Luminosity Normalisation 2% 2% 2% 3%
Alternative QCD function Norm. & Shape 4% 4% 3% 17%
W/Z and QCD (Theory) Normalisation 14% – – –
Higgs (Theory) Normalisation – 30% – –
Table 3: Summary of the impact of the main systematic uncertainties on the uncertainty σ on the measurement of the signal strength µ for the V + jets, Higgs boson and Z 0 signals.
As previously mentioned, the t t ¯ normalisation in the signal region is constrained with the scale factor
obtained in the t¯ t enriched control region. The t t ¯ scale factor has been measured with an uncertainty
of 13%, which is treated as a systematic uncertainty on the t t ¯ normalisation.
The uncertainty in the integrated luminosity is 2.1%. It is derived following a methodology similar to that detailed in Ref. [68] and it is applied to all processes modelled using MC simulations.
In order to compare the observed number of events from the V + jets and Higgs components of the signal region fit, we apply theory uncertainties to their normalisations. Theory uncertainties on the V + jets processes come from the impact of higher order electroweak and QCD corrections to their differential cross sections [69]. Among the Higgs boson production theory uncertainties, the gluon-gluon fusion uncertainty is dominant. It is taken as 30%, consistent with the cross section uncertainty as calculated with the MiNLO procedure and including top-mass effects for Higgs bosons with p T > 400 GeV. The same uncertainty is also applied to the other production mechanisms at high p T . This results in a total uncertainty on the Higgs cross-section of 30%.
The effects of the main systematic uncertainties on the measurement of the signal strength µ , defined as the scale factor multiplying the cross section times branching fraction predicted by the signal hypothesis, for the V + jets, Higgs boson and Z 0 signals are displayed in Table 3. The impact of a systematic uncertainty is defined as the difference in quadrature between the uncertainty σ in µ computed when all other uncertainties are considered and when are fixed to their pre-fit values. The total systematic uncertainty is then defined as the difference in quadrature between the total uncertainty in µ and the total statistical uncertainty, denoted as
√ ∆σ 2 in the table.
8 Results
To search for and quantify the significance of V + jets production and to set limits on the Higgs boson and Z 0 boson models, a Bayesian method is used to calculate a posterior likelihood as a function of number of signal events for the signal hypotheses under consideration [70]. Systematic uncertainties enter the likelihood as nuisance parameters. In this method, the Bayes’ theorem is utilised to build the final conditional probability of the parameters of interest given the observed data by integrating over the nuisance parameters (“marginalisation”) with a Markov Chain Monte Carlo procedure. The posterior probability distribution is used to gauge the fitted signal statistical significance or to set 95% credibility-level upper limits on the cross-section times acceptance times efficiency.
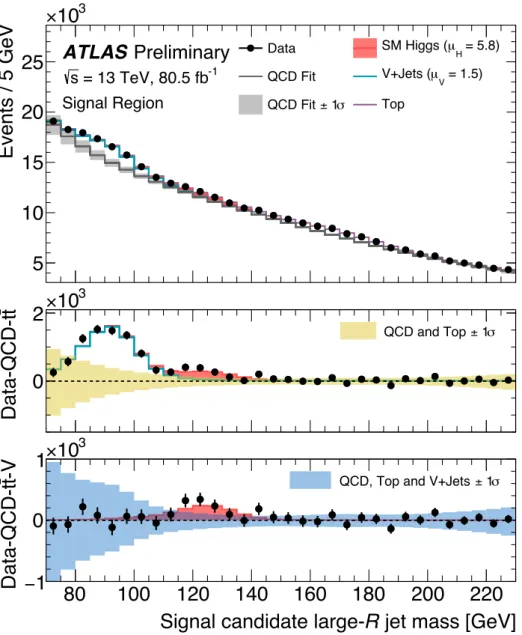
The first result obtained is the combined SM fit of the V + jets, H + jets and t¯ t plus QCD components.
With this fit, the signal strengths of the V + jets and H + jets processes, which are not constrained to positive values, are obtained simultaneously. The normalisation of the t t ¯ component is constrained with the scale factor obtained in the dedicated CR tt . The comparison to data after the marginalisation of the nuisance parameters is shown in Figure 2. The observed signal strength for the V + jets process is µ V = 1 . 5 ± 0 . 22 (stat.) +0 − 0 . . 29 25 (syst.) ± 0 . 18 (th.), corresponding to a significance of 5 standard deviations.
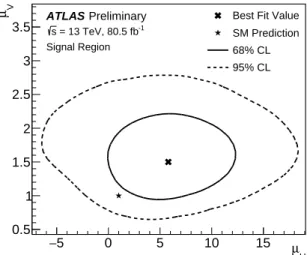
For the H + jets process, the observed signal strength is µ H = 5 . 8 ± 3 . 1 (stat.) ± 1 . 9 (syst.) ± 1 . 7 (th.), consistent with the background-only hypothesis at 1 . 6 σ . The combined likelihood of µ V and µ H is shown in Figure 3.
The BumpHunter search procedure [71, 72], assuming the V + jets and t t ¯ templates, is then performed for
looking for possible extra exotic signals in the large- R jet mass distribution. The effect of the Higgs boson
with a SM strength is smaller than the expected uncertainty on the Z’ limit and is therefore neglected. The
first step to this procedure is to perform a fit with the full set of systematic uncertainties and obtain the
best fit values for the nuisance parameters that are utilized in the analysis. Given these postfit shapes, the
BumpHunter algorithm looks for significant deviations from the background model. The largest deviation
5 10 15 20 25
10 3
×
Events / 5 GeV
80 100 120 140 160 180 200 220
jet mass [GeV]
R Signal candidate large- 0
2 10 3
t Data-QCD-t ×
1 σ QCD and Top ±
Preliminary ATLAS
= 13 TeV, 80.5 fb -1
s
Signal Region
Data = 5.8)
µ
HSM Higgs (
QCD Fit = 1.5)
µ
VV+Jets ( 1 σ
QCD Fit ± Top
5 10 15 20 25
10 3
×
Events / 5 GeV
80 100 120 140 160 180 200 220
jet mass [GeV]
R Signal candidate large-
− 1 0
1 10 3
×
-Vt Data-QCD-t
1 σ QCD, Top and V+Jets ±
Internal ATLAS
= 13 TeV, 80.5 fb -1
s
Signal Region
Data = 5.8)
µ
HSM Higgs (
QCD Fit = 1.5)
µ
VV+Jets ( 1 σ
QCD Fit ± Top
Figure 2: Postfit plot of the SM Higgs boson, V + jets, t t ¯ and QCD fit comparison to data. The middle panel shows
the postfit and data distributions with the QCD and t t ¯ components subtracted. The lower panel shows the same
distributions when also the V + jets component is subtracted.
− 5 0 5 10 15 µ H
0.5 1 1.5 2 2.5 3 3.5
V µ Best Fit Value
SM Prediction 68% CL 95% CL ATLAS Preliminary
= 13 TeV, 80.5 fb
-1s
Signal Region
Figure 3: Combined probability distribution of µ H and µ V from the signal region fit.
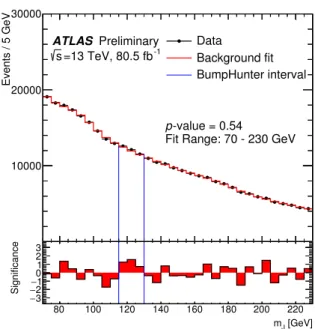
from the background found by the BumpHunter algorithm, as depicted in Figure 4, is found for a large- R mass value around 125 GeV, although with a small statistical significance. The corresponding global p -value is found to be 0.54.
This analysis also sets 95% confidence level limits on signals from dark matter mediators that decay democratically to quarks, with masses between 100 and 200 GeV. These limits are shown in Figure 5, in terms of cross section times branching ratio, acceptance and efficiency (left), and in terms of the g q
parameter that controls the coupling of the DM mediator to quarks and thus determines the cross-section (right).
9 Conclusion
A search for boosted resonances decaying to two b -quarks and produced in association with an extra jet with high transverse momentum is performed. The analysis uses an integrated luminosity of 80.5 fb − 1 of proton-proton collisions with a center-of-mass energy of
√ s = 13 TeV recorded by the ATLAS detector at
the Large Hadron Collider. The search probes the mass range between 70 and 230 GeV. The observed
signal strenght for the V + jets process is µ V = 1 . 5 ± 0 . 22 (stat.) +0 − 0 . . 29 25 (syst.) ± 0 . 18 (th.), corresponding to
a significance of 5 standard deviations. For the SM Higgs boson process, the observed signal strength is
µ H = 5 . 8 ± 3 . 1 (stat.) ± 1 . 9 (syst.) ± 1 . 7 (th.), consistent with the background-only hypothesis at 1 . 6 σ .
No evidence of a significant excess of events above the expected SM processes is found and limits on
leptophobic Z 0 with democratic axial couplings to all quark generations ( g q ) are set in the probed mass
range.
10000 20000 30000
Events / 5 GeV
80 100 120 140 160 180 200 220
[GeV]
m
J− 3
− 2
− 1 0 1 2 3
Significance
ATLAS Preliminary
=13 TeV, 80.5 fb
-1s
Data
Background fit BumpHunter interval
Fit Range: 70 - 230 GeV -value = 0.54
p
Figure 4: The reconstructed mass distribution m J with the event reconstruction and selection as described in the text.
The solid red line depicts the background prediction, consisting of the non-resonant dijet, V + jets and t t ¯ processes.
The vertical blue lines indicate the most discrepant interval identified by the BumpHunter algorithm. Without including systematic uncertainties, the probability that fluctuations of the background model would produce an excess at least as significant as the one observed in the data anywhere in the distribution, the BumpHunter probability, is 0.54. The low panel shows the bin-by-bin significances of the differences between the data and the fit, considering only statistical fluctuations.
100 120 140 160 180 200
[GeV]
m Z’
3
10 − 2
10 − 1
10 −
BR [pb] × A × ∈ × σ
ATLAS Preliminary
= 0.25) Z’ (g
qObserved 95% CL upper limit Expected 95% CL upper limit 68% and 95% bands
=13 TeV, 80.5 fb
-1s
(a)
100 120 140 160 180 200
[GeV]
m Z'
0.05 0.1 0.15
0.2 0.25 0.3 0.35 0.4
q g
ATLAS Preliminary
Observed 95% CL upper limit Expected 95% CL upper limit 68% and 95% bands
=13 TeV, 80.5 fb
-1s
(b)
Figure 5: The 95% credibility-level upper limits obtained from the invariant mass distribution on (a) the cross-section
times acceptance times branching ratio times efficiency for the Z 0 model described in the text and on (b) the g q
parameter that controls the decay width of the DM mediator into SM particles.
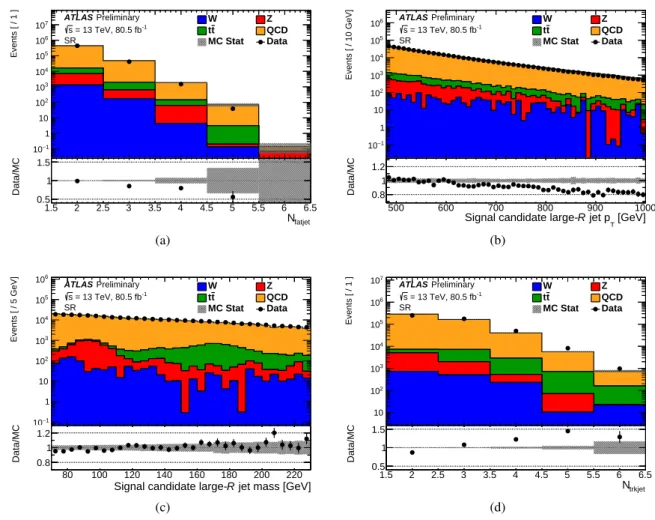
A Data/MC comparisons in the signal region
Comparisons between some key distributions in the data and simulated background samples in the SR, for illustration only as the non-resonant dijet MC is not used for background estimation in the analysis, are shown in Figure 6. The considered backgrounds are the non-resonant dijet, Z + jets, W + jets and t¯ t processes. Good modelling of the dijet background is not is expected. The normalization is corrected by fitting, in the range 70 GeV < m J < 230 GeV, the signal candidate large- R jet mass distribution with an overall normalisation scale factor which is found to be 0 . 903 for SR. This factor is applied in the distributions in Figure 6. Uncertainties in the ratio plots are only statistical.
1.5 2 2.5 3 3.5 4 4.5 5 5.5 6 6.5
fatjet
N
−1
10 1 10 10
210
310
410
510
610
7Events [ / 1 ]
W Z
t
t QCD
MC Stat Data SR
= 13 TeV, 80.5 fb
-1s
Preliminary
ATLAS1.5 2 2.5 3 3.5 4 4.5 5 5.5 6 6.5
fatjet
N 0.5
1 1.5
Data/MC
(a)
500 600 700 800 900 1000
[GeV]
jet p
TR
Signal candidate large-
−1
10 1 10 10
210
310
410
510
6Events [ / 10 GeV]
W Z
t
t QCD
MC Stat Data SR
= 13 TeV, 80.5 fb
-1s
Preliminary
ATLAS500 600 700 800 900 1000
[GeV]
jet p
TR Signal candidate large- 0.8
1 1.2
Data/MC
(b)
80 100 120 140 160 180 200 220
jet mass [GeV]
R
Signal candidate large-
−1
10 1 10 10
210
310
410
510
6Events [ / 5 GeV]
W Z
t
t QCD
MC Stat Data SR
= 13 TeV, 80.5 fb
-1s
Preliminary
ATLAS80 100 120 140 160 180 200 220
jet mass [GeV]
R Signal candidate large- 0.8
1 1.2
Data/MC
(c)
1.5 2 2.5 3 3.5 4 4.5 5 5.5 6 6.5
trkjet
N 10
10
210
310
410
510
610
7Events [ / 1 ]
W Z
t
t QCD
MC Stat Data SR
= 13 TeV, 80.5 fb
-1s
Preliminary
ATLAS1.5 2 2.5 3 3.5 4 4.5 5 5.5 6 6.5
trkjet