ATLAS-CONF-2012-135 28/09/2012
ATLAS-CONF-2012-135
September 28, 2012
Search for a Higgs boson produced in association with a top-quark pair and decaying to b b ¯ in pp collisions at √
s = 7 TeV using the ATLAS detector
The ATLAS Collaboration
Abstract
A search for a Higgs boson produced in association with a pair of top quarks (t
tH) and¯ decaying into a pair of bottom quarks (H
→bb) is presented. The analysis uses 4.7 fb¯
−1of
ppcollision data at
√s =
7 TeV collected in 2011 with the ATLAS detector at the CERN Large Hadron Collider. The search is focused on the semileptonic decay mode of the
tt¯ system which, together with the
H → bb¯ decay, typically results in a final state signature characterised by one high transverse momentum isolated electron or muon, high transverse missing momentum and six jets, of which four jets originate from
bquarks. Events are classified in nine different topologies depending on their jet and
b-tagged jet multiplicitiesin order to improve the sensitivity of the search. No significant excess of events above the background expectation is observed and 95% confidence-level upper limits on the produc- tion cross section times branching ratio,
σ(ttH)¯
× BR(H → bb), are derived for a Higgs¯ boson with a mass between 110 and 140 GeV. For a Higgs boson with a mass of 125 GeV, an observed (expected) 95% confidence-level upper limit of 13.1 (10.5) times the Standard Model cross section is obtained.
c Copyright 2012 CERN for the benefit of the ATLAS Collaboration.
Reproduction of this article or parts of it is allowed as specified in the CC-BY-3.0 license.
1 Introduction
Unraveling the mechanism for electroweak symmetry breaking and the generation of mass for elementary particles is one of the highest priorities of the Large Hadron Collider (LHC) and the ATLAS detector.
In the Standard Model (SM) [1–3] of particle physics, this is accomplished via the postulated Higgs mechanism [4–7], resulting in an elementary scalar particle, the Higgs boson, the search for which has been pursued for the last forty years.
In the analysis of almost 5 fb
−1of integrated luminosity in pp collisions at
√s
=7 TeV and almost 6 fb
−1of integrated luminosity at
√s
=8 TeV, searches for the SM Higgs boson by the ATLAS Collabora- tion [8] have excluded at the 95% confidence level (CL) a SM Higgs boson with mass (m
H) in the ranges 111–122 GeV and 131–559 GeV. The corresponding m
Hrange excluded by the CMS Collaboration is 110–121.5 GeV [9] and 127–600 GeV [10], also at the 95% CL. The very narrow mass range of
∼122–
127 GeV is not excluded because of the presence of a significant excess of events in the data observed by both the ATLAS and CMS Collaborations.
The ATLAS Collaboration has reported an excess of events consistent with a SM Higgs boson with mass m
H =126.0
±0.4 (stat.)
±0.4 (syst.) GeV with a local significance of 5.9 standard deviations (s.d.) [8]. The CMS Collaboration has also reported an excess of events at a similar mass, m
H=125.3
±0.4 (stat.)
±0.5 (syst.) GeV, with a local significance of 5.0 s.d. [9]. These excesses are formed by smaller excesses observed in searches focused on di-bosonic decay modes of the Higgs boson, primarily H
→γγ,H
→ZZ
(∗), and H
→WW , while no significant excesses were found yet in searches targeting fermionic decay modes (H
→b b ¯ and H
→ τ+τ−). Therefore, it is imperative to continue to pursue searches in other production and decay modes over a wide mass range trying to establish if a signal is also present, and if so, whether the estimated mass is consistent with m
H =126 GeV. In the latter case, as well as in the case of no signal found, these searches would provide valuable information on the properties of the recently discovered boson. Even more exciting would be the possibility of a signal emerging in these other searches at a mass different than m
H =126 GeV, which would automatically suggest a much richer spectrum of physics, beyond the SM.
For a low-mass SM Higgs boson up to around m
H=135 GeV, the dominant decay mode is H
→b b. ¯ The leading production mechanism is gluon-gluon fusion (gg
→H), which is the main mode exploited in the recent observations. However, the overwhelming multijet background precludes the possibility of a search for an isolated Higgs boson in the
gg →H
→b b ¯ channel. The production of a Higgs boson in association with a weak gauge boson (W H, ZH) or a top quark pair (t¯ tH) reduces backgrounds significantly, enabling the exploitation of the H
→b b ¯ decay mode. Searches for W H and ZH production with H
→b b ¯ have been carried out at the Tevatron [11, 12] and the LHC [13, 14]. The combination of Tevatron searches for W H and ZH production with H
→b b ¯ has recently reported an excess in the mass range of 120–135 GeV with a maximum local significance of 3.3 standard deviations at 135 GeV [15].
In this note we present a search for t tH ¯ (H
→b b) production in ¯ pp collisions at
√s
=7 TeV using data corresponding to an integrated luminosity of 4.7 fb
−1collected by the ATLAS experiment. This search is simultaneously sensitive to the Yukawa coupling between the top quark and the Higgs boson and the H
→b b ¯ branching ratio, and the only assumption made is that the Higgs boson is a narrow scalar particle. Once sufficient sensitivity is achieved, this process can provide unique information to discriminate among possible new physics contributions to top quark and Higgs boson interactions [16].
While the search is performed in 5 GeV steps for a hypothetical Higgs boson mass between 110 GeV and 140 GeV, the recent findings of a Higgs-like boson at 126 GeV are implicitly also tested since the sensitivity of the analysis at m
H =125 GeV is nearly the same as at 126 GeV and the b b ¯ invariant mass resolution larger than this difference. Similar searches have been reported by the CDF [17] and CMS [18]
collaborations.
This search is focused on the semileptonic decay mode of the t t ¯ system, where the W boson from
one top quark decays to a charged lepton and its associated neutrino, and the W boson from the other top quark decays to a quark-antiquark pair. The events are identified by a high transverse momentum ( p
T) electron or muon, a characteristic that is crucial to triggering, high missing transverse momentum (E
missT) from the undetected neutrino, and a high jet multiplicity. They are also distinguished by a large number of b-quark-initiated jets, which helps to further distinguish them from the backgrounds. The main background to the search comes from t¯ t events where there are at least two extra jets produced in association with the top quarks. The amount of this background depends on the b-jet identification effi- ciency and misidentification rate of light jets provided by the b-tagging algorithm used, and the number of reconstructed b jets required in the analysis. A fraction of the t¯ t+jets background consists of t¯ tb b, ¯ which constitutes an irreducible background.
Events with one high-p
Tisolated electron or muon, high E
missTand at least four reconstructed jets are selected, and they are categorised into nine different topologies depending on their jet and b-tagged jet multiplicities. Two different discriminants are employed depending on the category. Categories with at least six reconstructed jets and with three or more b-tagged jets present the highest signal-to- background ratio and have the highest sensitivity to a Higgs boson signal. In these cases a kinematic fit via a maximum likelihood approach is performed to select the best assignment of four of the six jets to the two top quarks in the final state, by adjusting their energies and transverse momenta to reconstruct the correct masses for the various resonances present in the t¯ t hypothesis. The invariant mass of the two jets not included in the t t ¯ reconstruction (m
bb¯) is analysed in the search for a Higgs boson resonance.
Categories with fewer than six jets or fewer than three b-tagged jets are dominated by background and the discriminant used is H
Thad, the scalar sum of the jet transverse momenta, p
jetT, a variable primarily sensitive to uncertainties associated with jet reconstruction and measurement, as well as with the modelling of the t t+jets background. A simultaneous fit to the background-dominated topologies and those with signal is ¯ performed to obtain an improved background prediction with reduced uncertainties, resulting in a better search sensitivity.
This note is organised as follows. After a brief overview of the ATLAS detector in Section 2, the main physics objects used in this search, as well as the dataset and event preselection requirements made are discussed in Sections 3 and 4, respectively. Section 5 summarises the simulated samples used for signal and backgrounds, while Section 6 is devoted to the background predictions based on data-driven techniques. The various topologies defined for this analysis are presented in Section 7. The kinematic reconstruction applied in a subset of the analysed topologies is covered in Section 8. A detailed discussion of the systematic uncertainties considered in this search is given in Sections 9. The statistical analysis is presented in Section 10, including a discussion of the likelihood fit performed to the data and the derived upper limits on signal production. Finally, a summary of the result is given in Section 11.
2 ATLAS Detector
The ATLAS detector [19] consists of four main subsystems: an inner tracking system surrounded by a superconducting solenoid, electromagnetic and hadronic calorimeters, and a muon spectrometer. The inner detector provides tracking information from pixel and silicon microstrip detectors in the pseudora- pidity
1range
|η| <2.5 and from a transition radiation tracker covering
|η| <2.0, all immersed in a 2 T magnetic field provided by a superconducting solenoid. The electromagnetic (EM) sampling calorimeter
1ATLAS uses a right-handed coordinate system with its origin at the nominal interaction point (IP) in the centre of the detector and thez-axis coinciding with the axis of the beam pipe. Thex-axis points from the IP to the centre of the LHC ring, and they-axis points upward. Cylindrical coordinates (r,φ) are used in the transverse plane,φbeing the azimuthal angle around the beam pipe. The pseudorapidity is defined in terms of the polar angleθasη=−ln tan(θ/2). For the purpose of the fiducial selection, this is calculated relative to the geometric centre of the detector; otherwise, it is relative to the reconstructed primary vertex of each event.
uses lead and liquid-argon (LAr) and is divided into a barrel region (
|η| <1.475) and an end-cap region (1.375
<|η|<3.2). Hadron calorimetry is based on two different detector technologies, with scintillator tiles or LAr as active media, and with either steel, copper, or tungsten as the absorber material. The calorimeters cover
|η|<4.9. The muon spectrometer measures the deflection of muon tracks in the high- precision tracking chambers for
|η| <2.7 located in a toroidal field of approximately 0.5 T and 1 T for the muon detectors in the central and end-cap regions of ATLAS respectively. The muon spectrometer is also instrumented with separate trigger chambers covering
|η|<2.4.
3 Object Reconstruction
The main physics objects considered in this search are electrons, muons, jets, b-jets and missing trans- verse momentum. A brief summary of the main reconstruction and identification criteria applied for each of the physics objects is given below.
Electron candidates are reconstructed from energy deposits (clusters) in the EM calorimeter that are associated to reconstructed tracks in the inner detector. They are required to have a transverse energy, E
T, greater than 25 GeV (where E
T =E
cluster/cosh
ηtrack) and
|ηcluster| <2.47 (where
|ηcluster|is the pseudorapidity of the calorimeter cluster associated with the electron candidate). Candidates in the calorimetry transition region 1.37
< |ηcluster| <1.52 are excluded. To reduce the background from non-prompt electrons, e.g. from decays of hadrons (including heavy flavour) produced in jets, electron candidates are also required to be isolated. A 90% isolation efficiency cut on the energy sum of cells around the direction of each candidate is made for a cone of radius
∆R = p(∆φ)
2+(∆η)
2 =0.2. This energy sum excludes cells associated with the electron cluster and is corrected for leakage from the electron cluster itself. A further 90% isolation efficiency cut is made on the transverse momentum sum around the electron in a cone of radius
∆R=0.3. The longitudinal impact parameter of the electron track with respect to the primary vertex, z
0, is required to be less than 2 mm. Further details can be found in Ref. [20].
Muon candidates are reconstructed from track segments in the various layers of the muon spec- trometer, and matched with tracks found in the inner detector. The final candidates are refitted using the complete track information from both detector systems, and required to satisfy p
T >20 GeV and
|η| <
2.5. Additionally, muons are required to be separated by
∆R >0.4 from any selected jet (see below). Muons are required to have a calorimeter isolation transverse energy within a cone of
∆R<0.2 to be below 4 GeV after excluding the muon energy deposits in the calorimeter. Additionally, the scalar sum of the track transverse momenta in a cone of
∆R <0.3 is required to be less than 2.5 GeV. Muons crossing the inner detector are required to have a hit pattern consistent with a well-reconstructed track.
Analogously to the electrons, the muon track longitudinal impact parameter with respect to the primary vertex, z
0, is required to be less than 2 mm.
Jets are reconstructed with the anti-k
talgorithm [21–23] with a radius parameter R
=0.4 from the topological clusters [19] built from energy deposits in the calorimeters. After energy calibration [24] jets must have p
T >25 GeV and
|η|<2.5. To avoid selecting jets from secondary pp interactions, a selection on the so-called ”jet vertex fraction” (JVF) variable above 0.75 is applied, representing a requirement that at least 75% of the sum of the p
Tof tracks with p
T >1 GeV associated with a jet comes from tracks compatible with originating from the identified hard-scatter primary vertex. During jet reconstruction, no distinction is made between identified electrons and jet energy deposits. Therefore, if any of the jets lie within
∆R <0.2 of a selected electron, the single closest jet is discarded in order to avoid double- counting of electrons as jets. After jets are defined and removed to avoid double-counting, electrons which are within
∆R<0.4 of a selected jet are removed.
Jets are identified as originating from the hadronisation of a b quark (b tagging) via an algorithm [25]
using multivariate techniques to combine information from the impact parameters of displaced tracks
as well as topological properties of secondary and tertiary decay vertices reconstructed within the jet.
The working point used for this study corresponds to 70% efficiency to tag a b-quark jet, with a light- jet rejection factor of
∼130 and a charm rejection factor of 5, as determined for b-tagged jets with
p
T>15 GeV in simulated t t ¯ events.
The E
Tmissis used to estimate the transverse momentum of an assumed neutrino originating from the decay of one of the W bosons in the t¯ tH final state. E
Tmissis itself reconstructed by first matching each energy cluster with either a reconstructed lepton or jet, or failing this, the cluster is left unassociated. The clusters are then calibrated for energy losses in un-instrumented regions and for different responses of the calorimeters to electromagnetic and hadronic shower components. This calibration scheme is similar to that described in Ref. [26]. E
missTis calculated from a vector sum of the calibrated cluster momenta, together with a term associated with muon momenta.
4 Event Preselection
This search is based on the full dataset collected by the ATLAS experiment during 2011 in pp collisions at
√s
=7 TeV. Only events collected using a single electron or muon trigger under stable beam condi- tions and for which all detector subsystems were fully operational are considered. The exact details of the trigger used varied with the data-taking period under consideration. The p
Tthresholds are 18 GeV for muons and 20 or 22 GeV for electrons. In later stages, the 22 GeV electron trigger was supplemented with a higher-p
Ttrigger with a threshold of 45 GeV to improve the efficiency at high instantaneous lu- minosity. The triggers use similar but looser selection criteria than the final reconstruction requirements and reach a plateau at 25 GeV (electrons) and 20 GeV (muons).
After the event has been accepted by the trigger, it is required to have at least one reconstructed vertex with at least five associated tracks, consistent with the beam collision region in the x
−yplane.
If more than one vertex is found, the primary vertex is taken to be the one which has the largest sum of the squared momenta of its associated tracks. Events are discarded if any jet with p
T >20 GeV is independently identified as out-of-time activity from a previous pp collision or as calorimeter noise [27].
Events are required to have exactly one reconstructed electron or muon and at least four jets satis- fying the quality and kinematic criteria discussed in Sect. 3. For both electron and muon channels, the selected lepton is required to match (∆R
<0.15) the lepton reconstructed by the high-level trigger. The background from multijet production is suppressed by a requirement on E
missTas well as on the trans- verse mass of the lepton and E
missT, defined as m
T =q
2 p
ℓTE
missT(1
−cos
∆φ), wherep
ℓTis the transverse momentum (energy) of the muon (electron) and
∆φis the azimuthal angle separation between the lepton and the direction of the missing transverse momentum. For the electron channel the requirements are E
missT >30 GeV and m
T >30 GeV, while for the muon channel the requirements are E
missT >20 GeV and E
missT +m
T>60 GeV.
Preselected events are then categorised depending on the jet and b-tagged jet multiplicities as dis- cussed in Sect. 7.
5 Background and Signal Modeling
After event preselection the main background is t¯ t+jets production, with the production of a W boson in
association with jets (W+jets) and multijet events contributing to a lesser extent. Small contributions arise
from single top quark, Z+jets, diboson (WW, WZ, ZZ) production, and associated production of a vector
boson and a t¯ t pair. Multijet events contribute to the selected sample mostly via the misidentification
of a jet or a photon as an electron or the presence of a non-prompt lepton, e.g. from a semileptonic
b- or c-hadron decay, and the corresponding yield is estimated via data-driven methods [28]. For the
W+jets background, the shape is obtained from the simulation but the normalisation is determined from the data, using the asymmetry between W
++jets andW
−+jets production inpp collisions and separating the events into Wb b+jets, ¯ Wc¯ c+jets, Wc+jets and W+light jets. Details on the estimation of the multijet and W+jets backgrounds are given in Sect. 6. All the smaller backgrounds, as well as the signal, are estimated from the simulation and normalised to their theoretical cross sections.
Simulated samples of t¯ tH (H
→b b) signal are generated with the leading-order (LO) generator ¯ P
6.425 [29] and the MRST LO** set of parton distribution functions (PDF) [30] for a range of Higgs boson masses, m
H =110, 115, 120, 125, 130, 140 GeV. These samples are generated assuming a top quark mass of 172.5 GeV and are normalised to the next-to-leading order (NLO) theoretical cross section. The cross sections and H
→b b ¯ branching ratio predictions used can be found in Ref. [31–36].
Samples of t t+jets and ¯ W
/Z+jets events are generated using the A 2.13 [37] LO generator and the CTEQ6L1 PDF set [38]. Parton shower and fragmentation is modeled with H
v6.520 [39]. To avoid double-counting of partonic configurations generated by both the matrix-element calculation and the parton-shower evolution, a parton-jet matching scheme (”MLM matching”) [40] is employed. The t¯ t+jets samples are generated separately for t¯ t+light jets with up to five additional light partons (u, d, s quarks or gluons), t tb ¯ b, and ¯ t tc¯ ¯ c. The overlap between t tQ ¯ Q ¯ (Q
=b, c) events generated from the matrix element calculation and those generated from parton-shower evolution in the t t+light jet sam- ¯ ples is avoided via an algorithm based on the angular separation between the extra heavy quarks: if
∆R(Q,
Q) ¯
>0.4, the matrix-element prediction is used, otherwise the parton-shower prediction is used.
These t t+jets samples are generated assuming a top quark mass of 172.5 GeV and are normalised to ¯ the approximate next-to-NLO (NNLO) theoretical cross section [41] using the MSTW2008 NNLO PDF set [42]. The W+jets samples are generated with up to five additional partons and separately for W+light jets, Wb b+jets, ¯ Wc¯ c+jets, and Wc+jets, and their fractions are normalised to measurements in W+1 jet and W+2 jets data control samples [43]. A similar heavy-quark overlap removal prescription as used for t t+jets is applied. The ¯ Z+jets background is normalised to the inclusive NNLO theoretical cross section [44].
Samples of single top quark backgrounds corresponding to the s-channel and Wt production mecha- nisms are generated with MC@NLO v4.01 [45–47] using the CT10 PDF set [48]. In the case of t-channel single top quark production, the A
MC v3.8 LO generator [49] with the MRST LO** PDF set is used instead. Samples of t tV ¯ (V
=W
,Z) are generated with the M
5 LO generator [50] and the CTEQ6L1 PDF set. Parton shower and fragmentation is modeled with H
v6.520 [39] in the case of MC@NLO, with P
6.421 in the case of A
MC, and with P
6.425 in the case of M
. These samples are generated assuming a top quark mass of 172.5 GeV. The single top samples are nor- malised to the approximate NNLO theoretical cross sections [51, 52] using the MSTW2008 NNLO PDF set, while the t tV ¯ samples are normalised to the LO cross section prediction from M
. Finally, the diboson backgrounds are modeled using H
with the MRST LO** PDF set, and are normalised to their NLO theoretical cross sections [53].
All event generators using H
are also interfaced to J
v4.31 [54] to simulate the underlying event. All samples utilise P
2.15 [55] to simulate photon radiation and T
1.20 [56] to sim- ulate
τdecays. Finally, all MC samples include multiple pp interactions and are processed through a simulation [57] of the detector geometry and response using G
4 [58], and the same reconstruction software as the data. Simulated events are corrected so that the object identification efficiencies, energy scales and energy resolutions match those determined in data control samples.
6 Data-Driven Background Estimates
The multijet background and the W+jets backgrounds are determined with data. The methods for these
determinations are described in the following sections.
6.1 Multijet Background
Multijet events can enter the selected data sample through several production and mis-reconstruction mechanisms. In the electron channel, the multijet background consists of both non-prompt electrons and ”fake” electrons where the latter include both electrons from photon conversion and mis-identified jets with a high fraction of their energy deposited in the EM calorimeter. In the muon channel, the background contributed by multijet events is predominantly due to final states with a non-prompt muon, such as from a semileptonic B or D meson decay. Since the simulation can not a-priori be expected to model the multijet background with a sufficient level of accuracy, data-driven techniques are developed to determine both its normalisation and shape for the distributions of interest.
The multijet background normalisation and shape are estimated directly from data by using the “Ma- trix Method” (MM) technique [28]. The MM exploits differences in lepton identification-related proper- ties between prompt isolated leptons from W and Z decays (referred to as “real leptons” below) and those where the leptons are either non-isolated or result from the mis-identification of photons or jets. For this purpose, two samples are defined after requiring the final kinematic selection criteria, differing only in the lepton identification criteria: a “tight” sample and a “loose” sample, the former being a subset of the latter. The tight selection employs the final lepton identification criteria used in the analysis. The method assumes that the number of selected events in each sample (N
looseand N
tight) can be expressed as a linear combination of the numbers of events with real and fake leptons, in such a way that the following system of equations can be defined:
N
loose =N
realloose+N
fakeloose,N
tight = ǫrealN
realloose+ǫfakeN
fakeloose,(1) where
ǫreal(ǫ
fake) represents the probability for a real (fake) lepton that satisfies the loose criteria, to also satisfy the tight ones, and are measured in data control samples.
While the MM also provides a prediction for the shape of the distributions, such a template suffers from very large statistical uncertainties whenever the data statistics is low, as is the case in events with
≥
3 b-tagged jets. In addition, such template would be correlated with the actual data distribution, com- plicating the statistical treatment. In order to overcome these difficulties, for each channel in the signal region the shape of the H
Thadand m
bb¯distributions is obtained from a selection with
≥2 b-tagged jets.
This is found to give a good description of the shape in the selections at higher b-tagged jet multiplicities to within the available statistics. These shapes are normalised to the yields predicted by the MM in each of the topologies. For the rest of the topologies, characterised by much larger data statistics, the MM is used to predict both the normalisation and shape for the multijet background.
6.2 W+jets Background
The estimate of the W+jets background is based on data for the overall normalisation and on the sim- ulation for the shape. In proton-proton collisions W+jets production is charge asymmetric. The total number of W+jets events in data, N
W =N
W++N
W−, can be estimated based on the measured difference between positively-charged and the negatively-charged W bosons, (N
W+−N
W−)
meas, and the ratio of W
+to W
−, r
MC, determined from the simulation:
N
W =r
MC+1 r
MC−1
!
(N
W+−N
W−)
meas.(2)
It has been shown that the simulation overestimates the number of W+jets events compared to the
data-driven method by up to
∼20%, depending on the jet multiplicity. Corresponding scale factors to
correct the prediction from the simulation have been derived [59] for W+
≥4 jets events and are used
in this analysis to calibrate the W+jets background to data before b tagging. The fractions of Wb b ¯ and Wc c ¯ are determined from data using the method described in Ref. [59]. As a result, the Wb b ¯ and Wc c ¯ events in the simulation are scaled by a factor of 1.13 (1.22), in the electron (muon) channel. The Wc background in the simulation is scaled by a factor of 1.52, which is derived from the NLO theoretical prediction. The fraction of W+light jets events is scaled accordingly in order to preserve the overall normalisation of the W+jets background before b tagging, which is obtained from data using Eq. (2).
7 Classification of Event Topologies
Preselected events containing four or more jets are categorised according to the event topology defined by the number of jets with p
T >25 GeV and the number of b-tagged jets.
A total of nine independent topologies are considered in this search, which are analysed separately and combined statistically to maximise the overall sensitivity. Four topologies consisting of 5 jets of which 3 or
≥4 jets are b tagged, and
≥6 jets of which 3 or
≥4 jets are b tagged, are referred to as
“signal region”: they have a larger signal-to-background ratio and dominate the fit to extract the Higgs boson signal or set limits on its production cross section. The five topologies consisting of 4 jets of which 0, 1, and
≥2 are b tagged, 5 jets of which 2 are b tagged and
≥6 jets of which 2 are b tagged, are also included in the search. These additional samples are dominated by different backgrounds and are used to constrain the related systematic uncertainties, some of which affect the background prediction in the signal region.
As will be described in Sect. 8, a kinematic reconstruction assuming the t tb ¯ b ¯ hypothesis is performed on events with
≥6 jets of which 3 or
≥4 jets are b tagged. For these topologies, the invariant mass of the pair of jets not selected as top quark decay products (m
bb¯) is used as the final variable to discriminate the signal, which shows a resonant structure near the correct Higgs boson mass, from the non-resonant background. For the rest of the event topologies, the scalar sum of the jet transverse momenta (H
Thad), considering all selected jets, is used as the final variable. The H
Thadvariable provides sensitivity to systematic uncertainties such as those arising from the jet energy calibration or the modelling of the t t+jets background. ¯
The event yields for the combined electron and muon samples for the different search channels con- sidered in this analysis are summarised in Table 1. The background prediction is improved by perform- ing a fit to the data under the signal-plus-background hypothesis, as discussed in Sect. 10. The improved predictions will be referred to as “post-fit” below. The errors are statistical plus systematic, where the systematic uncertainty given includes the constraining effect of the fit to the data.
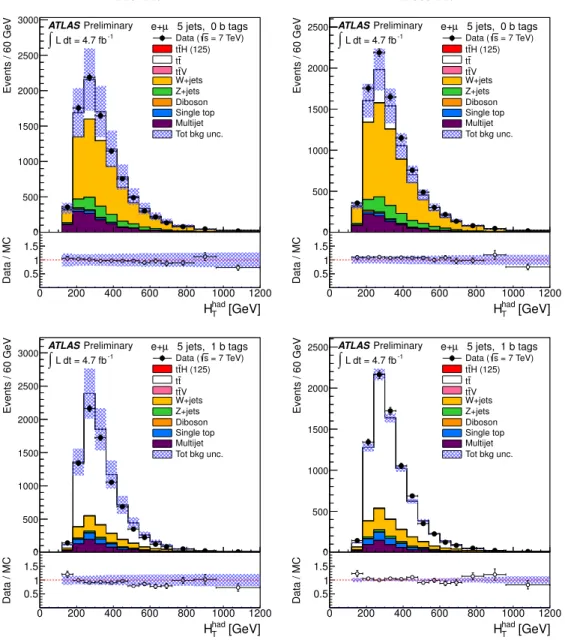
Other topologies not included in the search, such as 5 jets with 0 or 1 b-tags and 6 jets with 0 or 1 b-tags, are used to validate the extrapolation across topologies of the the improved background prediction (particularly on t t+jets) resulting from the fit to the data. ¯
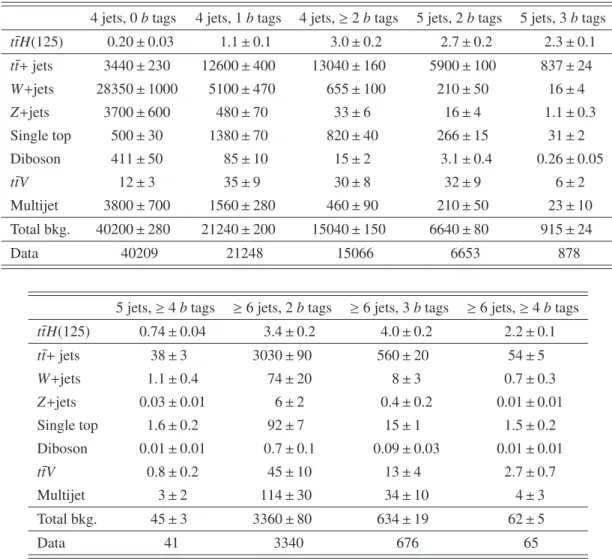
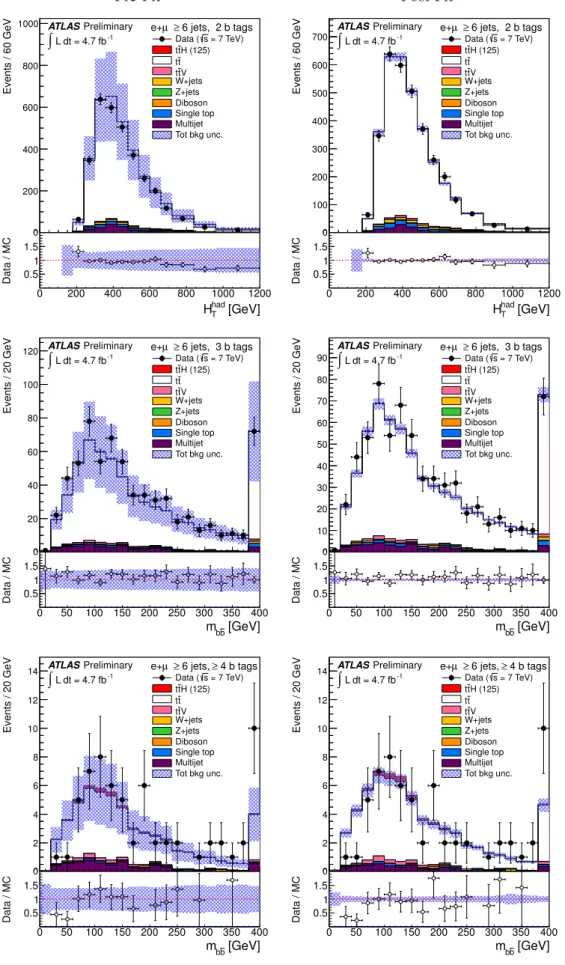
Figure 1 shows the S
/√B ratio, where S and B denote the expected signal (assuming SM cross sec- tions and branching ratios, and m
H=125 GeV) and background, respectively, for the different topologies under consideration. The relative proportions of the background yields obtained in each topology are shown in Figure 2.
8 Kinematic Reconstruction
A natural discriminator between the t tH ¯ (H
→b b) signal and the background is the reconstructed invari- ¯
ant mass of the b-quark pair, m
bb¯, in particular if the b-quarks can be determined to not have originated
from the top quarks. This assignment can be made for events with
≥6 jets of which
≥3 jets are b tagged,
from the two jets that are not assigned to the t t ¯ system. In the case of only three b-tagged jets one jet in
either the top quark or Higgs boson system will not be b tagged.
4 jets, 0btags 4 jets, 1btags 4 jets,≥2btags 5 jets, 2btags 5 jets, 3btags ttH(125)¯ 0.20±0.03 1.1±0.1 3.0±0.2 2.7±0.2 2.3±0.1 tt+¯ jets 3440±230 12600±400 13040±160 5900±100 837±24 W+jets 28350±1000 5100±470 655±100 210±50 16±4
Z+jets 3700±600 480±70 33±6 16±4 1.1±0.3
Single top 500±30 1380±70 820±40 266±15 31±2
Diboson 411±50 85±10 15±2 3.1±0.4 0.26±0.05
ttV¯ 12±3 35±9 30±8 32±9 6±2
Multijet 3800±700 1560±280 460±90 210±50 23±10
Total bkg. 40200±280 21240±200 15040±150 6640±80 915±24
Data 40209 21248 15066 6653 878
5 jets,≥4btags ≥6 jets, 2btags ≥6 jets, 3btags ≥6 jets,≥4btags ttH(125)¯ 0.74±0.04 3.4±0.2 4.0±0.2 2.2±0.1 tt+¯ jets 38±3 3030±90 560±20 54±5 W+jets 1.1±0.4 74±20 8±3 0.7±0.3 Z+jets 0.03±0.01 6±2 0.4±0.2 0.01±0.01
Single top 1.6±0.2 92±7 15±1 1.5±0.2
Diboson 0.01±0.01 0.7±0.1 0.09±0.03 0.01±0.01
ttV¯ 0.8±0.2 45±10 13±4 2.7±0.7
Multijet 3±2 114±30 34±10 4±3
Total bkg. 45±3 3360±80 634±19 62±5
Data 41 3340 676 65
Table 1: Table summarising post-fit event yields under the signal-plus-background hypothesis (assuming
SM cross sections and branching ratios, and m
H =125 GeV) for signal, backgrounds and data in each
of the topologies considered, corresponding to the combined e+jets and
µ+jets channels. The quoteduncertainties are the sum in quadrature of statistical and total systematic uncertainties on the yields,
computed taking into account correlations among nuisance parameters and among processes.
L dt = 4.7 fb
-1∫ , Preliminary (Simulation)
ATLAS m
H= 125 GeV
BS /
0.0 0.1 0.2 0.3 0.4 0.5
0 b tags
4 jets BS /
0.0 0.1 0.2 0.3 0.4 0.5
1 b tags
4 jets BS /
0.0 0.1 0.2 0.3 0.4 0.5
2 b tags
4 jets BS /
0.0 0.1 0.2 0.3 0.4 0.5
3 b tags
4 jets BS /
0.0 0.1 0.2 0.3 0.4 0.5
4 b tags
≥ 4 jets
BS /
0.0 0.1 0.2 0.3 0.4 0.5
0 b tags
5 jets BS /
0.0 0.1 0.2 0.3 0.4 0.5
1 b tags
5 jets BS /
0.0 0.1 0.2 0.3 0.4 0.5
2 b tags
5 jets BS /
0.0 0.1 0.2 0.3 0.4 0.5
3 b tags
5 jets BS /
0.0 0.1 0.2 0.3 0.4 0.5
4 b tags
≥ 5 jets
BS /
0.0 0.1 0.2 0.3 0.4 0.5
0 b tags 6 jets
≥ BS /
0.0 0.1 0.2 0.3 0.4 0.5
1 b tags 6 jets
≥ BS /
0.0 0.1 0.2 0.3 0.4 0.5
2 b tags 6 jets
≥ BS /
0.0 0.1 0.2 0.3 0.4 0.5
3 b tags 6 jets
≥ BS /
0.0 0.1 0.2 0.3 0.4 0.5
4 b tags
≥ 6 jets
≥
Figure 1: S
/√B ratio for each of the topologies under consideration after event preselection (assuming SM cross sections and branching ratios, and m
H=125 GeV). Each row shows the plots for a specific jet multiplicity (4, 5,
≥6), and the columns show the b-tagged jet multiplicity (0, 1, 2, 3,
≥4). Topologies with S
/√B
>0.05 are shown in red, while the rest are shown in blue.
A three-stage algorithm to select the candidate decay products of the Higgs boson is used. The first step is to select exactly six jets from the reconstructed jets selected in the analysis. The three or four b-tagged jets, ranked by p
T, are chosen first. To complete the list of six jets to be used for kinematic reconstruction, additional jets are then selected from the remaining p
T-ordered jets. Since the likelihood function used in the kinematic fit procedure described below is invariant under the permutation of two jets associated to the W boson decay, there are overall 180 jet permutations to be inspected for the t tH ¯ case. Combinations containing b-tagged jets that are inappropriately assigned to a W boson decaying hadronically are vetoed. For events with 3 b-tagged jets there are 36 permutations, and for those with 4 b-tagged jets there are 12 permutations possible, of which only 6 correspond to distinctly different assignments of the b jets from the Higgs boson decays.
The final stage of the analysis consists in a kinematic likelihood fit of the selected objects (leptons, E
missTand jets) to a t t ¯ hypothesis with two remaining jets set aside to form the invariant mass of the Higgs boson candidate in an unconstrained way. The Kinematic Likelihood Fitter (KLFitter) algorithm [60]
employed in this analysis performs kinematic reconstruction using the maximum likelihood method that allows observed jets to be assigned to the final state partons of the t t ¯ decay and finds good estimators for measured quantities using kinematic constraints. The likelihood function is built as a product of individual likelihood terms describing the kinematics of the t t ¯ signature and contains constraints from the masses of the two W bosons and the two top quarks.
Detector resolutions for energy measurements are described in terms of transfer functions that map
initial parton kinematics to those of reconstructed jets and leptons. The transfer functions are derived
for electrons, muons, light-quark (u, d, s, c) jets and b-quark jets, using a simulated t t ¯ sample generated
0 b tags 4 jets
1 b tags 4 jets
2 b tags 4 jets
3 b tags 4 jets
4 b tags
≥ 4 jets
ATLAS Preliminary (Simulation)
= 125 GeV mH
0 b tags 5 jets
1 b tags 5 jets
2 b tags 5 jets
3 b tags 5 jets
4 b tags
≥
5 jets tt+HF jets
+light jets t t
V t t W+jets Z+jets Diboson Single top Multijet
+HF jets t t
+light jets t t
V t t W+jets Z+jets Diboson Single top Multijet
0 b tags 6 jets
≥
1 b tags 6 jets
≥
2 b tags 6 jets
≥
3 b tags 6 jets
≥
4 b tags
≥ 6 jets
≥
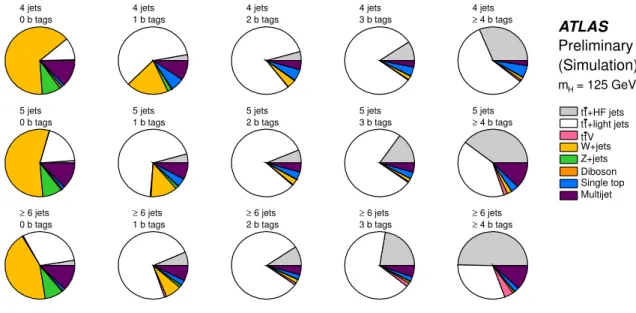
Figure 2: A series of pie charts showing the fractional contributions of the various backgrounds to the total background prediction in this analysis. Each row shows the plots for a specific jet multiplicity (4, 5,
≥6), and the columns show the b-tagged jet multiplicity (0, 1, 2, 3,
≥4).
with MC@NLO, and are parameterised in p
T(for muons) or energy in several
η-regions of the detectorto reflect its structure. It is assumed that the angular variables of each reconstructed object are measured with a negligible uncertainty. The association of reconstructed objects to the underlying partons is done by matching in
∆Rbetween the parton and the reconstructed object. This has been done separately for light-quark jets, b-quark jets, electrons and muons (dependent on p
T) using a double Gaussian resolution function and for E
missTusing a single Gaussian resolution function.
The W boson masses are reconstructed from two light (untagged) jets (m
j j) on the hadronic side of the decay and from the lepton and E
missT(m
lν) on the leptonic side of the decay, and are constrained to be compatible with a Breit-Wigner distribution around a W mass of m
W=80.4 GeV within a width of
ΓW=2.1 GeV. The reconstructed top quark mass is constrained to follow a Breit-Wigner distribution around a pole mass of m
t =172.5 GeV within a width of
Γt =1.5 GeV. No constraint is applied to the reconstructed Higgs boson mass, which is assumed unknown.
With these assumptions the likelihood function takes the form
L =T
JE ˜
jet1 |E
bhad×
T
JE ˜
jet2 |E
blep×
T
JE ˜
jet3 |E
q1×
T
JE ˜
jet4 |E
q2×
T
JE ˜
jet5 |E
b×
T
JE ˜
jet6 |E
b¯
×
T
missE ˜
missx |p
νx×
T
missE ˜
missy |p
νy×
T
eE ˜
e |E
e
T
µ˜
p
T,µ|p
T,µ
×
BW
nm
q1q2 |m
W,ΓWo×
BW
{m
lν|m
W,ΓW}×
BW
nm
q1q2bhad |m
top,Γtopo×
BW
nm
lνblep |m
top,Γtopo(3)
where BW are the Breit-Wigner functions describing the W and top quark decays. T
J, T
e, T
µand T
missare
the transfer functions for jets, electrons, muons and E
missT, respectively. The best permutation is found
by maximising the likelihood. This reconstruction method has been used in top quark mass [61] and
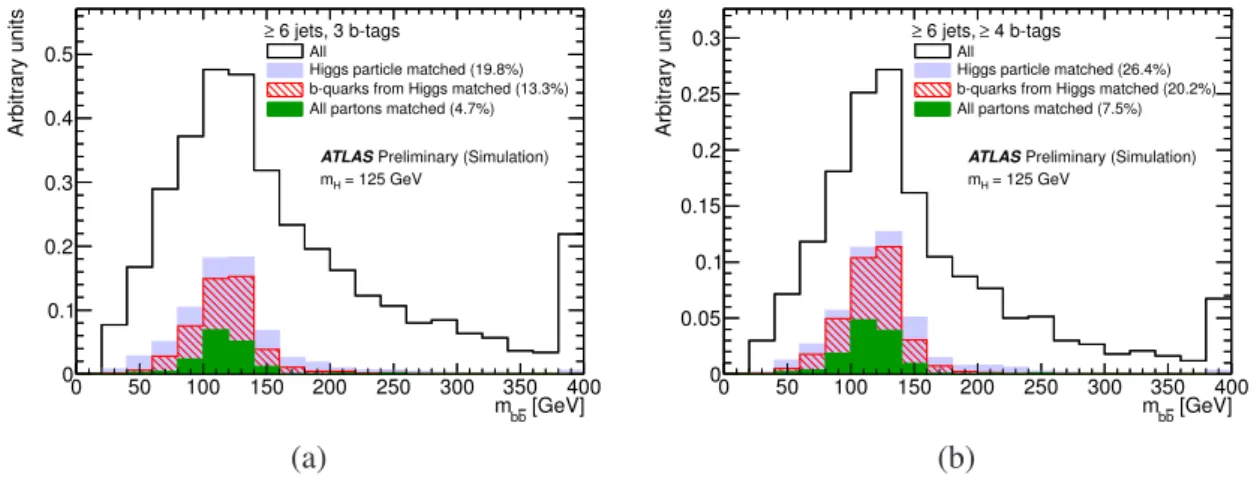
asymmetry [62] measurements. Simulation studies show that the correct b jet pair is identified as coming
from the Higgs boson decay with a probability of 26% (20%) for events with
≥4 (exactly 3) b-tagged
jets. Figure 3 illustrates the resulting shape of the m
bb¯distribution in simulated t¯ tH events. In 25% of the
cases at least one of jets from the Higgs boson decay is not included among the list of jets selected for performing the kinematic fit. Since the Higgs boson tends to be uniformly distributed in
φbetween the top quarks which themselves tend to be 180 degrees away from each other, the b decays from the top and Higgs boson overlap quite often. In addition, the c quark from a W decay can be mistaken as originating from the Higgs boson decay.
[GeV]
b
mb
0 50 100 150 200 250 300 350 400
Arbitrary units
0 0.1 0.2 0.3 0.4 0.5
6 jets, 3 b-tags
≥ All
Higgs particle matched (19.8%) b-quarks from Higgs matched (13.3%) All partons matched (4.7%)
Preliminary (Simulation) ATLAS
= 125 GeV mH
[GeV]
b
mb
0 50 100 150 200 250 300 350 400
Arbitrary units
0 0.05 0.1 0.15 0.2 0.25
0.3 ≥ 6 jets, ≥ 4 b-tags
All
Higgs particle matched (26.4%) b-quarks from Higgs matched (20.2%) All partons matched (7.5%)
Preliminary (Simulation) ATLAS
= 125 GeV mH
(a) (b)
Figure 3:
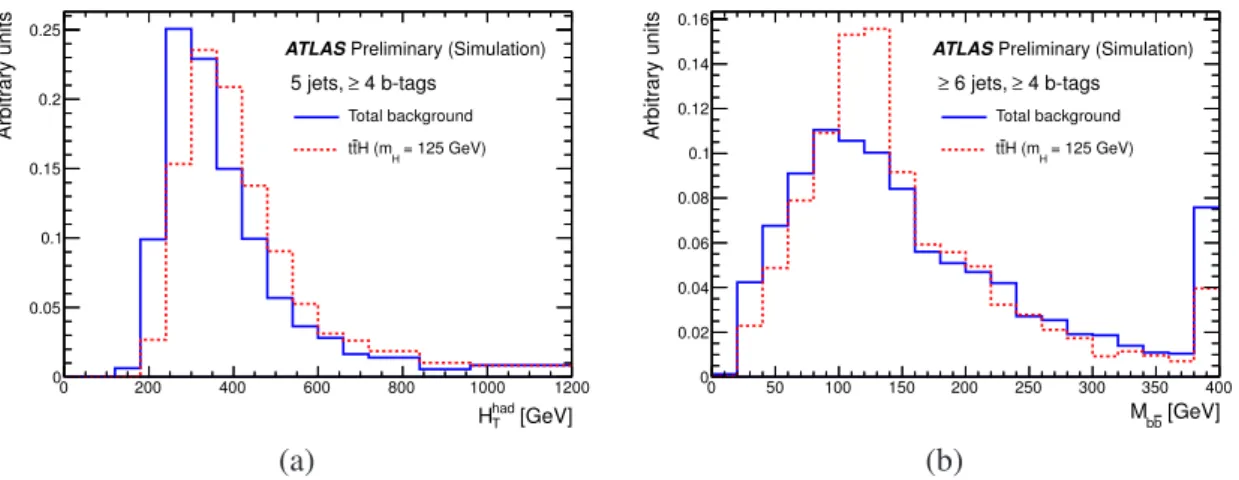
Distribution of the reconstructed Higgs boson mass (mbb¯) after kinematic fit for simulatedt¯tHsignal (assuming SM cross sections and branching ratios, andmH=125 GeV) in the combinede+jets andµ+jets channels after requiring (a)≥ 6 jets of which 3 jets arebtagged, and (b)≥ 6 jets of which≥ 4 jets areb tagged. Also overlaid are the distributions for the subset of events where the reconstructed Higgs boson matches (inηandφ) the generator-level Higgs boson particle (labeled as “Higgs particle matched”), the subset of events where the two bjets used formbb¯ match thebquarks from the Higgs boson decay (labeled as “bquarks from Higgs matched”), and the subset of events where all jets considered in the kinematic fit match the partons from the decays of the top quarks and Higgs boson (labeled as “all partons matched”). In all instances angular matching is performed by requiring∆R<0.4. The fractions of selected events satisfying the different matching requirements are indicated between parenthesis. The last bin in the figures contains the overflow.Figure 4 compares between signal and background the shape of the H
Thaddistribution for the most sensitive topology using this variable (5 jets,
≥4 b tags), and the shape of the m
bb¯distribution for the most sensitive topology using this variable (
≥6 jets,
≥4 b tags).
9 Systematic Uncertainties
Several sources of systematic uncertainties have been considered that can affect the normalisation of sig- nal and background and/or the shape of their corresponding final discriminant distributions. Individual sources of systematic uncertainty are considered uncorrelated. Correlations of a given systematic un- certainty are maintained across processes and channels. Table 2 presents a summary of the systematic uncertainties considered in the analysis indicating whether they are taken to be normalisation-only, or to affect both shape and normalisation. Details of the systematic uncertainties affecting the signal and/or background normalisations for each background and channel can be found in Tables 5–12 in Appendix A.
The following sections describe each of the systematic uncertainties considered in the analysis. In
order to reduce the degrading impact of systematic uncertainties on the sensitivity of the search, nuisance
parameters corresponding to each of the systematic uncertainties are fitted to data during the statistical
analysis, exploiting the constraining power from the background-dominated topologies considered, as
described in Sect. 10. A rough estimate of which systematic uncertainties are dominant can be obtained
by considering those from the process with the largest yield, t t, in the most sensitive channel: ¯
≥6 jets
[GeV]
had
HT
0 200 400 600 800 1000 1200
Arbitrary units
0 0.05 0.1 0.15 0.2 0.25
4 b-tags 5 jets, ≥
Total background = 125 GeV) H (mH
t t
Preliminary (Simulation) ATLAS
[GeV]
b
Mb
0 50 100 150 200 250 300 350 400
Arbitrary units
0 0.02 0.04 0.06 0.08 0.1 0.12 0.14 0.16
4 b-tags 6 jets, ≥
≥
Total background = 125 GeV) H (mH
t t
Preliminary (Simulation) ATLAS
(a) (b)
Figure 4:
Comparison of (a) theHThad distribution and (b) thembb¯ distribution betweent¯tH signal withmH = 125 GeV (dashed red histogram) and total background (solid blue histogram) in the combinede+jets andµ+jets channels. In the case ofHThadthe selection used is 5 jets of which≥4 jets arebtagged, while in the case ofmbb¯the selection used is≥6 jets of which≥4 jets arebtagged. Both distributions are normalised to unity in order to better compare the shapes between signal and background. The last bin in the figures contains the overflow.
Systematic uncertainty Status Components
Luminosity N 1
Lepton ID+reco+trigger N 1
Jet vertex fraction efficiency N 1
Jet energy scale SN 16
Jet energy resolution N 1
b-tagging efficiency SN 9
c-tagging efficiency SN 5
Light jet-tagging efficiency SN 1
t t ¯ cross section N 1
t¯ tV cross section N 1
Single top cross section N 1
Dibosons cross section N 1
V+jets normalisation N 3
Multijet normalisation N 7
W+heavy-flavour fractions SN 4
t¯ t modelling SN 3
t t+heavy-flavour fractions ¯ SN 1
t tH ¯ modelling N 1
Table 2: List of systematic uncertainties considered. A “N” means that such uncertainty is taken as normalisation-only for all processes and channels affected. A “SN” means that such uncertainty is taken as both shape and normalisation although for small backgrounds only the normalisation uncertainty is considered. Some of the systematic uncertainties are split into several different components for a more accurate treatment.
of which
≥4 are b tagged. From the measured yields in Table 1 it can be seen that t t ¯ is 82% of the
background. From the systematic uncertainties listed in Table 12 after all data constraints are applied,
it can be seen that the t t ¯
+heavy-flavour modelling, b-, c-, and light-tagging efficiencies, the t t ¯
+light flavour modelling and jet energy scale dominate the systematic uncertainties in the largest background t¯ t. The more sophisticated treatment of the systematic uncertainties including correlations described in Sect. 10 only changes this naive estimate by showing that multijet normalisation enters as an important systematic uncertainty as well and reduces the importance of the b-tagging uncertainty alone.
9.1 Luminosity
The luminosity estimate has an uncertainty of 1.8% [63]. This systematic uncertainty is applied to all processes except the multijet background.
9.2 Uncertainties on Object Definitions
In this section uncertainties in the reconstruction of jets, leptons and b-, c-, and light flavour-tagging are considered.
9.2.1 Lepton Reconstruction, Identification and Trigger
The reconstruction and identification efficiency of electrons and muons, as well as the efficiency of the trigger used to record the events, differ between data and simulation. Scale factors are derived using tag- and-probe techniques on Z
→ ℓ+ℓ−(ℓ
=e, µ) data and simulated samples to correct the simulation for these discrepancies. For each source of uncertainty, the quadratic sums of the statistical and systematic uncertainties on the corresponding scale factor is taken as the overall systematic uncertainty. A total per-lepton uncertainty of 1.3% is estimated for the combined e+jets and
µ+jets channels.9.2.2 Lepton Momentum Scale and Resolution
The accuracy of lepton momentum scale and resolution in simulation is checked using reconstructed distributions of the Z
→ℓ+ℓ−and J/ψ
→ℓ+ℓ−mass (in the case of electrons, E/ p studies using W
→eν events are also used). Small discrepancies are observed between simulation and the data, and corrections for the lepton energy scale and resolution are applied. In the case of electrons, energy scale corrections need to be applied to data (all regions) and the simulation (calorimeter transition region), while energy resolution corrections are applied to the simulation only. In the case of muons, momentum scale and resolution corrections are only applied to the simulation. Uncertainties on both the momentum scale and resolution are considered, and varied separately. The resulting uncertainties on the total yield predicted by the simulation are at the sub-percent level and are therefore neglected in the analysis.
9.2.3 Jet Vertex Fraction Efficiency
The per-jet efficiency to satisfy the
|JVF
| >0.75 requirement is measured in Z(
→ℓ+ℓ−)+1-jet events in data and simulation, selecting separately events enriched in hard-scatter jets and events enriched in jets from other proton interactions in the same bunch crossing (pileup). Dedicated efficiency and inefficiency scale factors are measured separately for both type of jets. In particular, the efficiency scale factor for hard-scatter jets is larger than 1, decreasing from
∼1.03 at p
T =25 GeV to
∼1.01 for p
T >150 GeV.
The scale factors for pileup jets are found to be consistent with 1. The product of all per-jet scale factors
define a per-event weight used to calibrate the simulation to data. The effect on acceptance for signal and
backgrounds of this uncertainty is
∼2.5–3.5%.
9.2.4 Jet Energy Scale
The jet energy scale and its uncertainty have been derived combining information from test-beam data, LHC collision data and simulation [24, 64–67]. The jet energy scale uncertainty is split into 16 uncor- related sources which can have different jet p
Tand
ηdependencies and are treated independently in this analysis and in the fits to the data. This ensures that the impact of this uncertainty on the search sensitiv- ity is not artificially reduced by over-constraining the associated nuisance parameters, as could happen in the case of a simplified jet energy scale uncertainty treatment involving a single uncertainty source.
Additional uncertainties have been added for the b-jet energy scale and effects of pileup in the data. The missing transverse momentum is corrected according to the varied p
Tof the jets in each event and all jet-related kinematic variables are recomputed accordingly.
9.2.5 Jet Energy Resolution
The jet energy resolution has been measured separately for data and the simulation using two in-situ techniques [24]. The expected fractional p
Tresolution for a given jet was measured as a function of its p
Tand rapidity. A systematic uncertainty is defined as the quadratic difference between the jet energy resolutions for data and the simulation. To estimate the corresponding systematic uncertainty in the anal- ysis, the energy of jets in the simulation is smeared by this residual difference, and the changes in the normalisation and shape of the final discriminant is compared to the default prediction by the simula- tion. Since jets in the simulation cannot be under-smeared, by definition the resulting uncertainty on the normalisation and shape of the final discriminant is one-sided. This uncertainty is then symmetrised.
9.2.6 Heavy- and Light-Flavour Tagging
The effects of uncertainties in efficiencies for the heavy flavour identification of jets by the b-tagging algorithm have been evaluated. This analysis uses the operating point with approximately 70% efficiency for b-quark jets. These efficiencies are measured from data and are different depending on the jet flavour.
Efficiencies for b quarks in the simulation have to be corrected by a p
T-dependent factor of 0.91–0.98 and a factor
∼1.1 for c quarks, whereas the light jet efficiency has to be scaled up by a factor of
∼1.2.
These scale factors have an uncertainty between 6% and 20% for b jets, between 12% and 22% for c jets, and
∼16% for light jets. The scale factors and their uncertainties are applied to each jet in the simulation depending on its flavour, p
Tand
η[68–70].
A total of nine and five independent sources of uncertainty are considered for the b-tagging and c- tagging efficiencies, respectively. Each of these uncertainties correspond to a resulting eigenvector after diagonalising the matrix containing the information of total uncertainty per p
Tbin and the bin-to-bin correlations. These systematic uncertainties are taken as uncorrelated between b, c jets, and light flavour jets. A per-jet weighting procedure is applied to simulated events to propagate the calibration of b tagging and the related uncertainties.
9.3 Normalisations of Data-Driven Backgrounds
In this section the uncertainties in rates of data-driven background estimates are described.
9.3.1