ATLAS-CONF-2014-038 04July2014
ATLAS NOTE
ATLAS-CONF-2014-038
July 4, 2014
Evidence for the associated production of a vector boson (W, Z) and top quark pair in the dilepton and trilepton channels in pp collision data at
√ s = 8 TeV collected by the ATLAS detector at the LHC
The ATLAS Collaboration
Abstract
Measurements of the production cross sections of top quark pairs in association with a
W or Z boson using a data set corresponding to 20.3 fb
−1of integrated luminosity collected
by the ATLAS detector in 2012 are presented. Final states with two or three leptons are
considered. Assuming t¯ tW production at the Standard Model rate, predicted by next-to-
leading-order QCD calculations, the ratio of the measured t¯ tZ signal strength to the Stan-
dard Model expectation is found to be
µttZ¯ =0.73
+0.29−0.26, corresponding to a 3.2
σexcess
over the background-only hypothesis. Assuming t¯ tZ production at the Standard Model rate,
the t¯ tW signal strength is found to be
µt¯tW =1.25
+0.57−0.48, corresponding to a 3.1
σexcess
over the background-only hypothesis. The combined t¯ tZ and t¯ tW signal strength, assuming
the Standard Model cross section ratio for t¯ tZ and t¯ tW predicted by next-to-leading-order
QCD calculations, is found to be
µt¯tV =0.89
+−0.220.23, corresponding to a 4.9
σexcess over
the background-only hypothesis. A simultaneous measurement of the t¯ tZ and t¯ tW signal
strengths yields
µt¯tZ =0.71
+−0.260.28and
µt¯tW =1.30
+−0.480.59, corresponding to a 4.4
σexcess over
the background-only hypothesis. Observed signal significance from the simultaneous mea-
surement yields 3.1σ for both t¯ tZ and t¯ tW processes. All measurements are consistent with
next-to-leading-order theoretical calculations for t¯ tZ and t¯ tW processes.
1 Introduction
The top quark is the heaviest known elementary particle, discovered in 1995 by the CDF and D0 col- laborations [1, 2]. Its coupling to the Higgs boson of order one indicates that the top quark is closely connected to electroweak symmetry breaking. Despite the fact that the top quark was discovered almost two decades ago, some of its properties have not yet been fully investigated. In particular, its couplings to
γand Z bosons have never been directly measured. Extensions of the Standard Model (SM), such as technicolor or other scenarios with a strongly coupled Higgs sector, could modify the couplings of the top quark.
With the large centre of mass energy and integrated luminosity of the collected data samples at the Large Hadron Collider (LHC), the processes where the Standard Model (SM) bosons (γ, Z, W and H) are produced in association with top quarks become accessible. These processes provide a means of directly measuring top quark couplings [3–5]. Previous public results from the LHC have been provided by both the CMS [6, 7] and ATLAS Collaborations [8].
In this note, a measurement of the t¯ tZ and t¯ tW cross sections with 20.3 fb
−1of proton-proton ( pp) collision data collected by the ATLAS detector is presented. Channels with two leptons (both same- sign (SS) and opposite sign (OS)) and three leptons (electrons or muons) are utilised. The presence of multiple jets and b-tagged jets is required to improve sensitivity to the t¯ tV (V
=W
,Z) processes. In the opposite sign dilepton channel, there are large backgrounds from inclusive top pair (t¯ t) production and Z boson production in association with jets (Z
+jets). A multivariate discriminant, built using a neuralnetwork, based on kinematic event information, is used to discriminate signal from these backgrounds.
Two signal regions are considered, depending on whether or not a Z boson can be reconstructed. The trilepton channel is mostly sensitive to t¯ tZ, while the same-sign dilepton channel targets t¯ tW production.
Multiple signal regions corresponding to di
fferent jet and b-tagged jet multiplicities are considered in the opposite sign and trilepton channels to further enhance the sensitivity to the signal. A simultaneous fit is performed to all the signal regions from all three channels to extract cross sections for t¯ tZ and t¯ tW production.
The note is organised as follows. Section 2 contains a description of the ATLAS detector. Section 3 gives details of the Monte Carlo simulation samples used in the analysis. Section 4 gives the definitions of physics objects used, while Section 5 describes the event preselections used in the various channels.
Section 6 describes the trilepton and same-sign dilepton channel analyses. Section 7 discusses the details of the opposite-sign dilepton channel analysis. The systematic uncertainties are discussed in Section 8, while Section 9 contains the results. Finally, conclusions are presented in Section 10.
2 The ATLAS detector
The ATLAS detector [9] consists of four main subsystems: an inner tracking system surrounded by a su- perconducting solenoid, electromagnetic and hadronic calorimeters, and a muon spectrometer. The inner detector provides tracking information from pixel and silicon microstrip detectors in the pseudorapidity
1range
|η| <2.5 and from a transition radiation tracker (TRT) covering
|η| <2.0, all immersed in a 2 T magnetic field provided by a superconducting solenoid. The electromagnetic (EM) sampling calorimeter uses lead and liquid argon (LAr) and is divided into a barrel region (|η|
<1.475) and an end-cap region (1.375
<|η|<3.2). Hadron calorimetry is based on two di
fferent detector technologies, with scintillator
1ATLAS uses a right-handed coordinate system with its origin at the nominal interaction point (IP) in the centre of the detector and thez-axis coinciding with the axis of the beam pipe. Thex-axis points from the IP to the centre of the LHC ring, and they-axis points upward. Cylindrical coordinates (r,φ) are used in the transverse plane,φbeing the azimuthal angle around the beam pipe. The pseudorapidity is defined in terms of the polar angleθasη=−ln tan(θ/2). For the purpose of the fiducial
tiles or LAr as active media, and with either steel, copper, or tungsten as the absorber material. The calorimeters cover
|η| <4.9. The muon spectrometer measures the deflection of muon tracks within
|η|<
2.7 using multiple layers of high-precision tracking chambers located in toroidal fields of approxi- mately 0.5 T and 1 T in the central and end-cap regions of ATLAS, respectively. The muon spectrometer is also instrumented with separate trigger chambers covering
|η|<2.4.
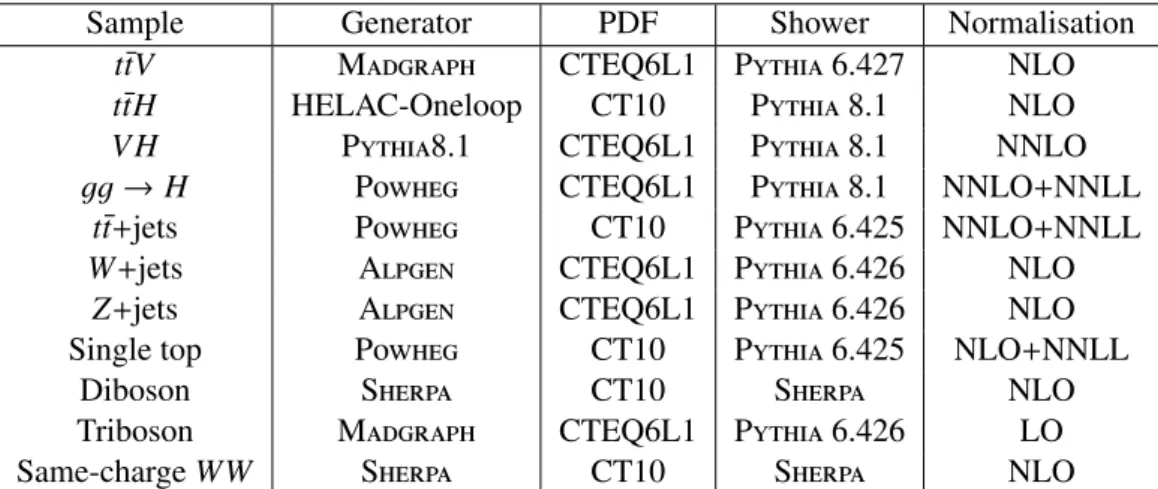
3 Simulated event samples
Monte Carlo simulated samples are used to optimise the signal regions used in the measurement and to model the background processes. The signal samples of t¯ tV (V
=W
,Z) production are generated with the M
adgraph v5 generator [10] using leading-order (LO) matrix elements with up to one additional parton and using the CTEQ6L1 PDF set. P
ythia6.425 with the AUET2B tune [11] is used for hadronisation and to describe the underlying event. The t¯ tV samples are normalised to the inclusive next-to-leading-order (NLO) QCD cross section predictions
σ(t¯tZ)
=206
±45 fb and
σ(t¯tW)
=232
±51 fb [12, 13]. The top quark mass is assumed to be 172.5 GeV.
Samples of W/Z
+jets events are generated using the A
lpgen v2.14 [14] LO generator and the CTEQ6L1 PDF set [15]. Parton shower and fragmentation are modelled with Pythia 6.425 [16]. To avoid double- counting of partonic configurations generated by both the matrix-element calculation and the parton- shower evolution, a parton-jet matching scheme (“MLM matching”) [17] is employed.
The W/Z
+jets samples are generated with up to five additional partons, separately forW/Z
+lightjets, W/Z
+b b ¯
+jets and W
/Z+c c ¯
+jets. The overlap between W/Z
+Q Q ¯ (Q
=b, c) events generated from the matrix element calculation and those generated from parton-shower evolution in the W
/Z+light jet samples is avoided via an algorithm based on the angular separation between the extra heavy quarks: if
∆
R(Q, Q) ¯
>0.4, the matrix-element prediction is used, otherwise the parton-shower prediction is used.
The W
/Z+jets background is normalised to the inclusive next-to-next-to-leading-order (NNLO) QCD cross section [18].
The WW/WZ/ZZ
+jets samples are generated using Sherpa [19] with massive b, c-quarks with up to three additional partons in the matrix element (ME) and parton shower (PS) and are normalised to their NLO QCD theoretical cross sections [20].
Simulated t¯ t events are generated using the P
owheggenerator [21–23], which implements the NLO matrix element for inclusive t¯ t production, with the CT10 PDF set. P
owhegis interfaced to P
ythia6.425 [16] with the CTEQ6L1 set of parton distribution functions using the Perugia2011C tune [24].
The sample is normalised to the theoretical calculation performed at NNLO in QCD that includes resum- mation of next-to-next-to-leading logarithmic (NNLL) soft gluon terms with
top++2.0 [25–30] yielding 253
+15−16pb for a centre of mass energy of 8 TeV. The uncertainty on the calculation includes the choice of PDF set, the uncertainties provided with the PDF sets, and the uncertainties on
αSand the top quark mass. The PDF and
αSuncertainties are calculated using the PDF4LHC prescription [31] with the MSTW2008 68% CL NNLO [32, 33], CT10 NNLO [34, 35] and NNPDF2.3 5f FFN [36] PDF sets and added in quadrature to the scale uncertainty.
Samples of single top quark backgrounds corresponding to the t-, s- and Wt production mechanisms
are generated with Powheg [21–23] using the CT10 PDF set [34]. All samples are interfaced to Pythia
6.425 [16] with the CTEQ6L1 set of parton distribution functions using the Perugia2011C tune. Overlaps
between the t¯ t and Wt final states are removed using the so-called diagram removal scheme [37]. The
single top quark samples are normalised to the approximate NLO+NNLL theoretical cross sections [38–
Sample Generator PDF Shower Normalisation t¯ tV M
adgraphCTEQ6L1 P
ythia6.427 NLO
t¯ tH HELAC-Oneloop CT10 Pythia 8.1 NLO
V H P
ythia8.1 CTEQ6L1 P
ythia8.1 NNLO
gg→
H P
owhegCTEQ6L1 P
ythia8.1 NNLO
+NNLL t¯ t
+jetsPowheg CT10 Pythia 6.425 NNLO+NNLL W
+jetsA
lpgenCTEQ6L1 P
ythia6.426 NLO
Z
+jets A
lpgenCTEQ6L1 P
ythia6.426 NLO
Single top Powheg CT10 Pythia 6.425 NLO+NNLL
Diboson S
herpaCT10 S
herpaNLO
Triboson M
adgraphCTEQ6L1 P
ythia6.426 LO
Same-charge WW S
herpaCT10 S
herpaNLO
Table 1: A summary of generators, PDF sets and cross section calculations used for the various MC samples.
produced using the CT10NLO PDF sets, and the normalisation and Higgs boson decay branching frac- tions are taken from the NLO QCD calculations from Ref. [42]. The process
gg →H
→4l is modelled using P
owheginterfaced with P
ythia8 [43]. W H and ZH production are modelled using P
ythia8. The samples are normalised to the NNLO QCD cross sections with NLO electro-weak (EW) corrections.
The production of a single top quark in association with a Z boson is simulated with Madgraph
v5 and the CTEQ6L1 PDF set. M
adgraphis interfaced to P
ythia6.425 using the AUET2B tune and the CTEQ6L1 PDF set. The relevant samples are normalised to the NLO predictions obtained from
aMC@NLO [44].The production of three vector bosons (WWW, ZWW) that decay leptonically is also simulated with M
adgraph v5 and P
ythia6.425. The production of two W bosons with the same charge is modelled using the Sherpa generator, including diagrams of order
α4EWand
α2EWα2S. The LO cross section obtained from the generator is used to normalise the samples.
All P
ythia6 samples use P
hotos2.15 [45] to simulate photon radiation and T
auola1.20 [46] to simulate
τdecays. All simulated samples include multiple pp interactions and are processed through a simulation [47] of the detector geometry and response using G
eant4 [48]. Table 1 provides a sum- mary of the MC samples used in the analysis. All simulated samples are processed through the same reconstruction software as the data.
4 Object Reconstruction
The main physics objects used in this measurement are electrons, muons, jets, b-jets and missing trans- verse momentum. A brief summary of the main reconstruction and identification criteria applied for each of these physics objects is given below.
Electron candidates [49] are reconstructed from energy deposits (clusters) in the electromagnetic calorimeter that are associated with reconstructed tracks in the inner detector. The electrons are required to have
|ηcluster|<2.47 (where
ηclusteris the pseudorapidity of the calorimeter cluster associated with the electron candidate). Candidates in the calorimetry transition region 1.37
<|ηcluster|<1.52 are excluded.
The electron identification relies on a likelihood-based selection [50] which combines calorimeter, track-
ing and combined variables such as shower shape variables of the EM calorimeter middle layer, track
quality requirements and track-cluster matching, particle identification using the TRT, and discrimination
reconstructed conversion vertices.
To reduce the background from non-prompt electrons, i.e. from decays of hadrons (including heavy flavour) produced in jets, electron candidates are required to be isolated. In the opposite sign (OS) dilep- ton channel, where such background is small, the electron isolation is defined based only on tracker infor- mation, requiring that the ratio of the sum of track transverse momenta in a cone of
∆R
= p(
∆η)2+(
∆φ)2=0.3 around the electron track (p
cone30T) to the transverse momentum (p
T) of the electron be less than 0.12, i.e., p
cone30T /pT<0.12. In the trilepton channel, where the non-prompt lepton background is more promi- nent, additional requirements are imposed on electron isolation. For electrons with transverse energy E
T <50 GeV, the ratio of the additional calorimeter energy within a cone of
∆R
=0.2 of the electron (E
cone20T) to the p
Tof the electron is required to be less than 0.12. For E
T >50 GeV, both E
Tcone20and
p
cone30Tare required to be less than 6 GeV.
Muon candidates are reconstructed from track segments in the various layers of the muon spectro- meter, and matched with tracks identified in the inner detector. The final candidates are refitted using the complete track information from both detector systems, and are required to have
|η|<2.5. Additionally, muons are required to be separated by
∆R
>0.4 from any selected jet and to satisfy a p
T-dependent track- based isolation requirement [51] that has good performance under high pileup conditions or in boosted configurations where the muon is close to a jet: the scalar sum of the track p
Tin a cone of variable radius
∆
R
<10 GeV/ p
µTaround the muon (excluding the muon track itself) must be less than 5% of the muon p
T.
For both electrons and muons, the lepton track longitudinal impact parameter with respect to the primary vertex
2, z
0, is required to be less than 2 mm.
Jets are reconstructed with the anti-k
talgorithm [52–54] with a radius parameter R
=0.4 from calibrated topological clusters [9] built from energy deposits in the calorimeters. Prior to jet finding, a local cluster calibration scheme [55, 56] is applied to correct the topological cluster energies for the effects of non-compensation, dead material and out-of-cluster leakage. The corrections are obtained from simulations of charged and neutral particles. After energy calibration [57, 58], jets are required to have p
T >25 GeV and
|η|<2.5.
To avoid selecting jets from multiple pp interactions, an additional requirement — referred to as the jet vertex fraction (JVF) requirement — is imposed on jets with p
T <50 GeV and
|η| <2.4. It ensures that at least 50% of the sum of the p
Tof tracks with p
T >1 GeV associated with a jet comes from tracks compatible with originating from the primary vertex.
During jet reconstruction, no distinction is made between identified electrons and jet energy deposits.
Therefore, if any of the jets lie within
∆R
<0.2 of a selected electron, the single closest jet is discarded in order to avoid double-counting of electrons as jets. After this, electrons which are within
∆R
<0.4 of a remaining jet are removed.
Jets are identified as containing a b quark (b-tagged) via an algorithm [59] using multivariate tech- niques to combine information from the impact parameters of displaced tracks as well as topological properties of secondary and tertiary decay vertices reconstructed within the jet. The working point used for this measurement corresponds to 70% e
fficiency to tag a b-quark jet, with a light-jet rejection factor of
∼130 and a charm jet rejection factor of 5, as determined for b-tagged jets with p
T >20 GeV and
|η|<
2.5 in simulated t¯ t events. The efficiency of b-tagging in simulation is corrected to that in data using a t¯ t based calibration [60].
The magnitude of the missing transverse momentum (E
Tmiss) is reconstructed by first matching each
calorimeter energy cluster with either a reconstructed lepton or jet, and calibrating the energy of the clus-
ter according to the type of associated object. The remaining unassociated clusters are then calibrated
for energy losses in un-instrumented regions and for the different responses of the calorimeters to elec- tromagnetic and hadronic shower components. This calibration scheme is similar to that described in Ref. [61]. E
missTis calculated from a vector sum of the calibrated cluster momenta, together with a term associated with muon momenta.
5 Event Selection and Sample Composition
This measurement is based on data collected by the ATLAS experiment in pp collisions at
√s
=8 TeV between April and October 2012. The corresponding integrated luminositity is 20.3 fb
−1. Only events collected using a single electron or muon trigger under stable beam conditions that pass the standard data quality criteria are accepted. The trigger requirements vary with the data-taking period. In particular, the p
Tthresholds are 24 or 60 GeV for electrons and 24 or 36 GeV for muons. The triggers with the lower p
Tthreshold include isolation requirements on the candidate lepton, resulting in ine
fficiencies at high p
Tthat are recovered by the triggers with higher p
Tthreshold. The trigger uses criteria that are looser than those used in final reconstruction, but are similar in nature. In all selections considered, at least one selected lepton with p
T >25 GeV is required to match (
∆R
<0.15) a lepton reconstructed by the high-level trigger. Events are required to have at least one reconstructed vertex.
5.1 Same-sign dimuon and trilepton channels
The same-sign dimuon channel, referred to as 2µSS, targets the t¯ tW process. Events are required to contain exactly two same-sign muons. The two same-sign electron channel is found to have a large background from electron charge mismeasurements and are not considered. The events are also required to contain at least two b-tagged jets with p
T >25 GeV and
|η| <2.5. The dominant background after this preselection are events with non-prompt and misidentified leptons.
In the trilepton channel, events are required to have exactly three selected leptons. Events containing a fourth lepton with p
T >15 GeV are rejected. The leading lepton is required to have p
T >25 GeV.
Two preselections are considered, referred to as 3`Z and 3`Zveto. The 3`Z region targets the t¯ tZ process, while 3`Zveto aims at the t¯ tW process. In the region 3`Z, at least one pair of leptons is required to have the same flavour and opposite charge and have an invariant mass within 10 GeV of the Z boson mass. Region 3`Zveto contains the remaining trilepton events with a requirement that the selected leptons must not all have the same sign.
The 3`Z preselection is dominated by WZ
+jets events, with a significant contribution from eventswith non-prompt and misidentified leptons. For validation of the modelling, a control region called CRZ is defined. In the CRZ region the presence of one to three selected jets, exactly one of which is b-tagged, is required in addition to the requirements of the 3`Z preselection. To validate the 3`Zveto region, which is dominated by non-prompt and misidentified leptons, a control region CRW is defined by requiring exactly one jet to be b-tagged in addition to the requirements of the 3`Zvetoregion.
The fake-lepton background fraction in both the same-sign and trilepton signal regions are estimated using an orthogonal sideband in data constructed from a relaxed lepton selection. The e
fficiencies for real and fake leptons are measured in events containing two selected leptons and one b-tagged jet. The 2µSS fake lepton background is validated in the low E
missTregion (E
Tmiss<40 GeV) of the 2µSS channel.
5.2 Opposite-sign dilepton channel
In the opposite-sign (OS) dilepton channel, events are required to have exactly two leptons of opposite
charge and at least three jets satisfying the quality and kinematic criteria discussed in Sect. 4, at least one
of which is b-tagged. The leading lepton is required to have p
>25 GeV and the subleading p
>15
GeV. Events with additional leptons that match the selection cuts of the trilepton channel are rejected to avoid overlaps.
Two orthogonal analysis regions are defined to separate various final states of t¯ tZ and t¯ tW processes contributing to the OS selection. The 2`OSZveto analysis region contains events outside the Z-mass window,
|m``−m
Z| >10 GeV, in the ee and
µµchannels, and the 2`OSZ region has the same flavour dilepton events within the Z boson mass window:
|m``−mZ|<10 GeV. For ee and
µµevents, the invariant mass of the two leptons, m
``, is required to be larger than 15 GeV to suppress contributions from the electromagnetic decay of hadronic resonances such as the J/ψ and
Υmesons into same-flavour leptons.
The E
Tmiss >40 GeV requirement is applied in 2`OSZveto in the ee and
µµdilepton channels to reduce the Z
+jets contribution.Dilepton eµ events are also included in the 2`OSZveto region. For these events, the scalar sum of the transverse energy of leptons and jets, H
T, is required to be above 130 GeV. In both 2`OSZveto and 2`OSZ, an additional cut on the average distance between two jets
∆R
jjave>0.75 is applied.
In 2`OSZveto, the t¯ tV signal contribution originates mainly from the dileptonic t¯ t final state accom- panied by a hadronic W
/Zboson decay and by the semileptonic t¯ t final state with a leptonic W boson decay. In 2`OSZ, the contribution of t¯ tW production is negligible while the t¯ tZ contribution comes from the fully hadronic t¯ t final state with a leptonic Z boson decay.
After this event preselection the dominant backgrounds are t¯ t
+jets and Z
+jets production in 2`OSZveto and 2`OSZ respectively. The best possible description of these backgrounds by the simulation and the assignment of appropriate systematic uncertainties are the key aspects of the measurement in the OS channel.
To improve t¯ t background modelling, a two-step correction is applied to simulated t¯ t events in P
owheg+P
ythiabased on the ratio of the measured di
fferential cross sections at
√s
=7 TeV between data and the simulation [62]. First, the p
Tof the t¯ t system in simulation is reweighted to match the mea- surement. This improves the agreement between simulation and data in the description of the number of jets distribution. In a second step, reweighting of the top quark p
Tis performed taking into account the change of the top quark p
Tdistribution due to the t¯ t system p
Treweighting. The latter mostly a
ffects p
Tdistributions of leptons and jets. Thus the two reweightings are complementary to each other.
To improve the Z
+jets background modelling, the MC simulation is reweighted to account for the di
fference of the Z p
Tspectrum between data and simulation [63] and in addition the ZQ Q ¯ (Q
=b, c) component of the Z
+jets background is adjusted to match data in aZQ Q ¯ dominated control region with at least one b-tagged jet.
Small background contributions arise from single top quark Wt-channel production, from diboson (WW, WZ, ZZ) processes, from the associated production of a Higgs boson and a t¯ t pair, as well as from the associated production of a WW and a t¯ t pair and associated production of a single top quark and a Z boson. These background contributions are determined using corresponding MC samples.
In 2`OSZveto, the W
+jets,t¯ t production with a single lepton in the final state and t- and s-channels single top quark production processes can pass selection cuts due to lepton misidentification. Their yield is estimated using simulation and cross checked with a data driven technique based on the selection of a same-sign lepton pair. In 2`OSZ, the contribution of the non-prompt and misidentified lepton (fake lepton) background is negligible.
6 Same-sign and trilepton channels
for the final result, including both statistical and systematic uncertainties. The selection optimization is performed with respect to cuts on E
missT, lepton p
Tand (in the same sign dimuon region only) H
T.
The grouping and optimization result in five signal region definitions: SRZb1j4, SRZb2j3, SRZb2j4, SRW`3 and SR2µSS. In the SRZb1j4 region, at least four selected jets are required, exactly one of which is b-tagged. In the SRZb2j3 region, exactly three selected jets with at least two jets b-tagged are required. In SRZb2j4 at least four selected jets are required, where at least two jets are b-tagged.
Finally, in SRW`3 at least two and at most three jets are required, where at least two jets are b-tagged.
For SRZb1j4, SRZb2j3 and SRZb2j4 the minimum p
Trequirement on the third leading electron is raised to 20 GeV, while for SRW`3 the minimum p
Trequirement on the third leading electron is raised to 25 GeV. In the same-sign region SR2µSS, the optimization based on the expected backgrounds results in a selection with three requirements: a minimum p
Ton the second leading muon of at least 25 GeV, a E
missTlarger than 40 GeV and H
Tlarger than 240 GeV.
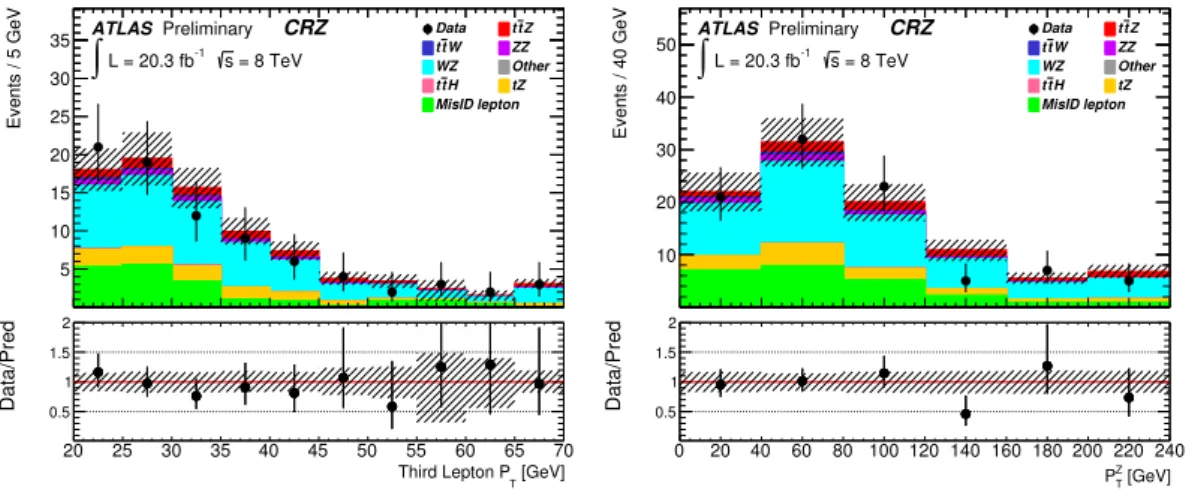
To validate the modelling of the dominant backgrounds in the 3`Z (3`Zveto) regions, the CRZ (CRW) region defined in Section 5.1 is used. These control regions are not included in the fit. Figure 1 shows the p
Tdistributions of the third lepton and the p
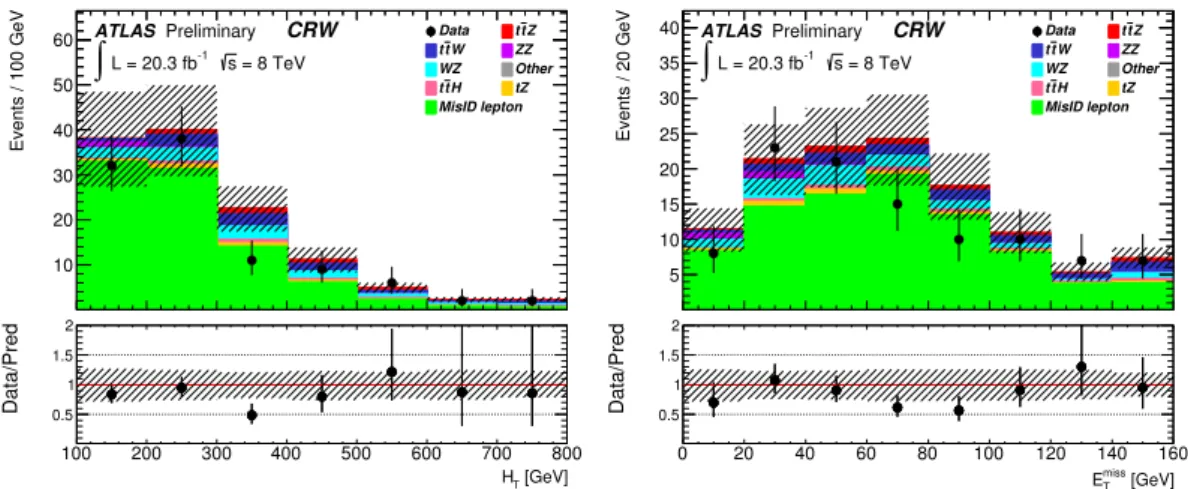
Tdistribution of the Z candidate reconstructed from the pair of leptons whose invariant mass is closest to the Z boson mass, for events passing the CRZ selection. Figure 2 shows the distributions of H
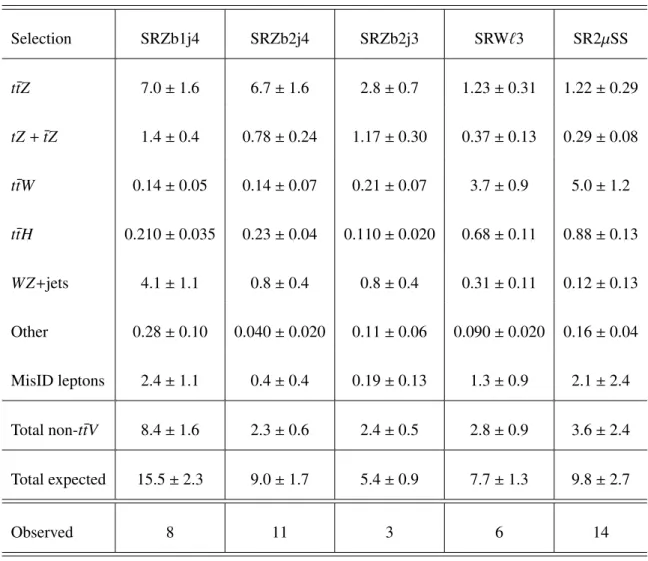
T, for events passing the CRW selection. Good agreement between the observed and expected distributions is observed. The expected and observed yields in the signal regions are shown in Table 2. A counting analysis is performed in the five signal regions to extract the t¯ tZ and t¯ tW signal strengths.
Events / 5 GeV
5 10 15 20 25 30
35 ATLASPreliminary CRZ = 8 TeV s
-1 L = 20.3 fb
∫
Data ttZ W t
t ZZ
WZ Other
H t
t tZ
MisID lepton
[GeV]
Third Lepton PT
20 25 30 35 40 45 50 55 60 65 70
Data/Pred 0.5
1 1.5 2
Events / 40 GeV
10 20 30 40
50 ATLAS Preliminary CRZ = 8 TeV s
-1 L = 20.3 fb
∫
Data ttZ W t
t ZZ
WZ Other
H t
t tZ
MisID lepton
[GeV]
Z
PT
0 20 40 60 80 100 120 140 160 180 200 220 240
Data/Pred 0.5
1 1.5 2
Figure 1: The distributions of the p
Tof the third leading lepton (left), and the p
Tof the reconstructed Z boson candidate (right) in events passing the CRZ selection. The shaded bands represent the systematic uncertainties on the expected event counts. The last bin in each histogram includes the overflow.
7 Opposite sign dilepton channel
7.1 Classification of Events According to Event Topology
Preselected events in both the 2`OSZveto and 2`OSZ regions are categorised according to the number of jets and the number of b-tagged jets.
In the 2`OSZveto region, events with at least three jets with one or two b-tagged jets are split in three
exclusive regions according to jet multiplicity: (3j, 1b
+2b), (4j, 1b
+2b), (
≥5j, 1b
+2b). These regions
Selection SRZb1j4 SRZb2j4 SRZb2j3 SRW`3 SR2µSS t¯ tZ 7.0
±1.6 6.7
±1.6 2.8
±0.7 1.23
±0.31 1.22
±0.29
tZ
+tZ ¯ 1.4
±0.4 0.78
±0.24 1.17
±0.30 0.37
±0.13 0.29
±0.08 t¯ tW 0.14
±0.05 0.14
±0.07 0.21
±0.07 3.7
±0.9 5.0
±1.2 t¯ tH 0.210
±0.035 0.23
±0.04 0.110
±0.020 0.68
±0.11 0.88
±0.13 WZ
+jets4.1
±1.1 0.8
±0.4 0.8
±0.4 0.31
±0.11 0.12
±0.13 Other 0.28
±0.10 0.040
±0.020 0.11
±0.06 0.090
±0.020 0.16
±0.04 MisID leptons 2.4
±1.1 0.4
±0.4 0.19
±0.13 1.3
±0.9 2.1
±2.4 Total non-t¯ tV 8.4
±1.6 2.3
±0.6 2.4
±0.5 2.8
±0.9 3.6
±2.4 Total expected 15.5
±2.3 9.0
±1.7 5.4
±0.9 7.7
±1.3 9.8
±2.7
Observed 8 11 3 6 14
Table 2: Pre-fit event yields for signal, backgrounds and data in the five signal regions SRZb2j3,
SRZb1j4, SRZb2j4, SRW`3 and SR2µSS. The entry “Other” includes the triboson and SM same-sign
WW production processes. The quoted uncertainties on expected event yields include systematic and
Monte Carlo statistical uncertainties.
Events / 100 GeV
10 20 30 40 50
60 ATLASPreliminary CRW = 8 TeV s
-1 L = 20.3 fb
∫
Data ttZ W t
t ZZ
WZ Other
H t
t tZ
MisID lepton
[GeV]
HT
100 200 300 400 500 600 700 800
Data/Pred 0.5
1 1.5 2
Events / 20 GeV
5 10 15 20 25 30 35
40 ATLAS Preliminary CRW = 8 TeV s
-1 L = 20.3 fb
∫
Data ttZ W t
t ZZ
WZ Other
H t
t tZ
MisID lepton
[GeV]
miss
ET
0 20 40 60 80 100 120 140 160
Data/Pred 0.5
1 1.5 2
Figure 2: Distributions of H
T(left) and E
Tmiss(right) for events passing the CRW selection. The shaded bands represent the systematic uncertainties on the expected event counts. The last bin in each histogram includes the overflow.
S
/Band S
/√B, they are merged together into one region. In 2`OSZ, events with at least three jets and exactly two b-tagged jets are split in three exclusive regions according to jet multiplicity: (3j, 2b), (4j, 2b), (≥ 5j, 2b).
All six regions are jointly interpreted in the final statistical analysis. The event yields for the com- bined ee
+jets,µµ+jets andeµ
+jets samples for the different regions considered in the OS dilepton chan-nel are summarised in Tables 3 and 4.
7.2 Neural Network Analysis
A neural network (NN) discriminant built using the NeuroBayes [64] package is used to separate the combined t¯ tZ and t¯ tW , signal from the background in the signal-rich regions (4j, 1b
+2b) and (
≥5j, 1b
+2b) in the 2`OSZveto region and (≥ 5j, 2b) in the 2`OSZ region. The other regions considered in the analysis have lower sensitivity, and event counting is used in the (3j, 1b
+2b) region of 2`OSZveto and both counting and shape information from the scalar sum of the jet p
T(H
Thad) in the (3j, 2b) and (4j, 2b) regions of 2`OSZ. Signal-depleted regions have a varying composition of background processes and are used to constrain systematic uncertainties, thus improving background prediction in the signal-rich regions.
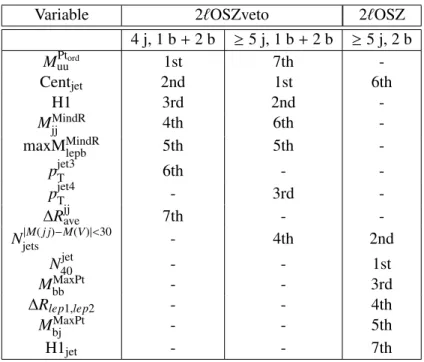
The set of variables used as input for the NN discriminant is chosen separately for each region, based on the statistical separation power of each variable, and discarding highly correlated variables. The algorithm is run independently in each signal-rich region allowing to select the best set of variables for each case. All variables used for the NN training are required to describe the data well in multiple control regions. The list of selected variables is given in Table 5. Table 6 shows the lists of variables used in each region and their ranking by separation power.
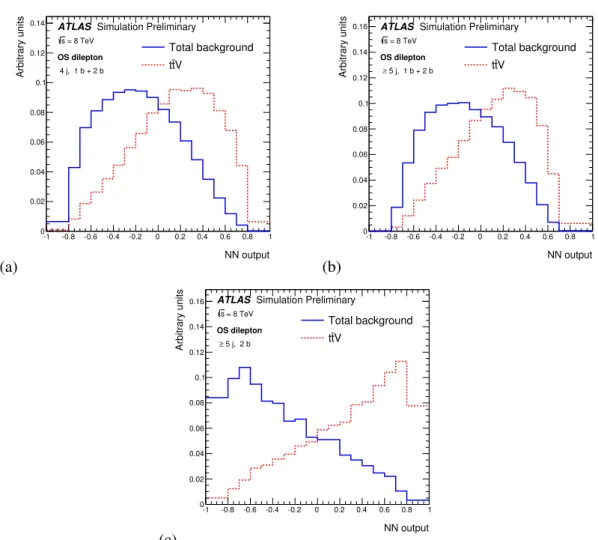
Figure 3 illustrates the discrimination between the t¯ tV signal and background provided by the NN
discriminant. In the 2`OSZveto region, the signal contribution comes from t¯ tW and t¯ tZ production with
hadronic W and Z decays respectively. As both contributions are comparable in size and have similar
kinematics, they result in a similar NN discriminant shape. In the 2`OSZ region, the t¯ tW contribution is
negligible. Thus the NN discriminant shape is driven by the t¯ tZ signal.
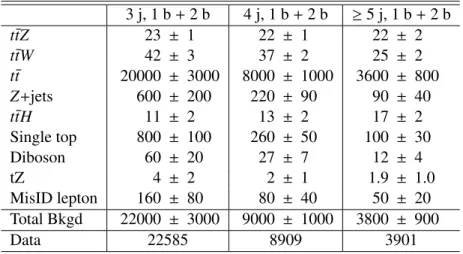
3 j, 1 b
+2 b 4 j, 1 b
+2 b
≥5 j, 1 b
+2 b
t¯ tZ 23
±1 22
±1 22
±2
t¯ tW 42
±3 37
±2 25
±2
t¯ t 20000
±3000 8000
±1000 3600
±800
Z
+jets600
±200 220
±90 90
±40
t¯ tH 11
±2 13
±2 17
±2
Single top 800
±100 260
±50 100
±30
Diboson 60
±20 27
±7 12
±4
tZ 4
±2 2
±1 1.9
±1.0
MisID lepton 160
±80 80
±40 50
±20
Total Bkgd 22000
±3000 9000
±1000 3800
±900
Data 22585 8909 3901
Table 3: Estimated event yields for signal and backgrounds, as well as the observed data in the 2`OSZveto region. The quoted uncertainties on expected event yields include both systematic uncer- tainties, as well as MC statistical uncertainties.
3 j, 2 b 4 j, 2 b
≥5 j, 2 b
t¯ tZ 3.7
±0.4 7.3
±0.6 18
±1
t¯ tW 1.2
±0.1 1.3
±0.1 0.9
±0.1
t¯ t 800
±100 330
±60 160
±30
Z
+jets 2000
±900 800
±400 300
±200 t¯ tH 0.49
±0.07 0.63
±0.08 0.9
±0.1
Single top 19
±3 7
±2 3
±1
Diboson 26
±7 14
±4 10
±3
tZ 4
±2 5
±2 3
±3
MisID lepton 4
±2 2
±1 1.4
±0.7
Total Bkgd 2800
±900 1100
±400 500
±200
Data 2806 1031 471
Table 4: Estimated event yields for signal and backgrounds, as well as the observed data in the 2`OSZ
region. The quoted uncertainties on expected event yields include both systematic uncertainties, as well
as MC statistical uncertainties.
Variable Definition
M
uuPtordMass of the two untagged jets with the highest p
Tin events with exactly two tagged jets or mass of the two untagged jets with the highest p
Tafter discarding the jet with second highest b-tagging weight in events with exactly one tagged jet
Cent
jetSum of p
Tdivided by sum of E for all jets
H1 2nd Fox-Wolfram moment
H1
jet2nd Fox-Wolfram moment built from jets only
M
jjMindRMass of the combination between any two jets with the smallest
∆R maxM
MindRlepbMaximum mass between a lepton and the tagged jet with the smallest
∆R p
jet3TThird leading jet p
Tp
jet4TFourth leading jet p
T∆
R
jjaveAverage
∆R for all jet pairs N
|M(j j)−M(V)|<30jets
Number of jet pairs with mass within a window of 30 GeV around 85 GeV N
40jetNumber of jets with p
T≥40 GeV
M
bbMaxPtMass of the combination of two tagged jets with the largest vector sum p
TM
bjMaxPtMass of the combination of a tagged jet and any jet with the largest vector sum p
T∆
R
lep1,lep2 ∆R between the two leptons
Table 5: The variables considered for use within the Neural Network analysis in the opposite-sign dilep- ton channel. The definition of Fox-Wolfram moments can be found in Ref. [65].
Variable 2`OSZveto 2`OSZ
4 j, 1 b
+2 b
≥5 j, 1 b
+2 b
≥5 j, 2 b
M
Ptuuord1st 7th -
Cent
jet2nd 1st 6th
H1 3rd 2nd -
M
jjMindR4th 6th -
maxM
MindRlepb5th 5th -
p
jet3T6th - -
p
jet4T- 3rd -
∆
R
jjave7th - -
N
jets|M(j j)−M(V)|<30- 4th 2nd
N
40jet- - 1st
M
bbMaxPt- - 3rd
∆
R
lep1,lep2- - 4th
M
bjMaxPt- - 5th
H1
jet- - 7th
Table 6: The lists and rankings of the variables in each of the signal regions in the opposite-sign dilepton
channel.
NN output
-1 -0.8 -0.6 -0.4 -0.2 0 0.2 0.4 0.6 0.8 1
Arbitrary units
0 0.02 0.04 0.06 0.08 0.1 0.12
0.14 ATLAS Simulation Preliminary = 8 TeV
s OS dilepton 4 j, 1 b + 2 b
Total background V
t t
(a)
NN output-1 -0.8 -0.6 -0.4 -0.2 0 0.2 0.4 0.6 0.8 1
Arbitrary units
0 0.02 0.04 0.06 0.08 0.1 0.12 0.14
0.16 ATLAS Simulation Preliminary = 8 TeV
s OS dilepton
5 j, 1 b + 2 b
≥
Total background V
t t
(b)
NN output
-1 -0.8 -0.6 -0.4 -0.2 0 0.2 0.4 0.6 0.8 1
Arbitrary units
0 0.02 0.04 0.06 0.08 0.1 0.12 0.14
0.16 ATLAS Simulation Preliminary = 8 TeV
s OS dilepton
5 j, 2 b
≥
Total background V
t t
(c)
Figure 3: Expected distribution of the neural network discriminant for the background (blue) and signal
(red dashed) in
(a)the (4j, 1b
+2b) region in 2`OSZveto,
(b)the (≥ 5j, 1b
+2b) region in 2`OSZveto,
and
(c)the (≥ 5j, 2b) region in 2`OSZ.
8 Systematic uncertainties
Several sources of systematic uncertainties are considered that can a
ffect the normalisation of signal and background in each channel and/or the shape of the discriminant distributions in the OS dilepton channel.
The following sections describe each of the systematic uncertainties considered in each channel.
8.1 Luminosity
The luminosity estimate has an uncertainty of 2.8% [66], determined using beam-separation scans, as described in Ref. [67]. This systematic uncertainty is applied to all contributions obtained from MC simulation.
8.2 Uncertainties on Physics Objects
The treatment of the uncertainties on physics objects is common across all channels except for the details of the heavy- and light-flavour tagging uncertainty treatment indicated below.
8.2.1 Leptons
Uncertainties associated with the lepton selection arise from the trigger, reconstruction, identification, isolation and lepton momentum scale and resolution. In total, uncertainties associated with electrons (muons) include a total of 5 (6) components.
The reconstruction and identification efficiency of electrons and muons, as well as the efficiency of the triggers used to record the events, slightly di
ffer between data and simulation. Correction factors are derived using tag-and-probe techniques on Z
→`+`−(`
=e, µ) data and simulated samples [68, 69] to correct the simulation for these discrepancies.
The accuracy of the lepton momentum scale and resolution in simulation is checked using recon- structed distributions of the Z
→ `+`−and J/ψ
→ `+`−masses. In the case of electrons, E/ p studies using W
→eν events are also used. Small discrepancies are observed between data and simulation, and corrections for the lepton energy scale and resolution in the latter are applied. In the case of elec- trons, energy scale corrections are applied to data and simulation, while energy resolution corrections are applied to the simulation only. In the case of muons, momentum scale and resolution corrections are only applied to the simulation. Uncertainties on both the momentum scale and resolutions in the muon spectrometer and the tracking system are considered, and varied separately.
8.2.2 Jet Energy Scale
The jet energy scale (JES) and its uncertainty are derived combining information from test-beam data, LHC collision data and simulation [57, 70]. The jet energy scale uncertainty is split into 22 uncorrelated sources which model the p
Tand
ηdependencies of the JES uncertainty [57] and are treated indepen- dently.
8.2.3 Jet Vertex Fraction
The per-jet efficiency to satisfy the jet vertex fraction requirement is measured in Z(
→`+`−)+1-jet events
in data and simulation, selecting separately events enriched in hard-scatter jets and events enriched in
jets from other proton interactions in the same bunch crossing (pileup). The corresponding uncertainty
is evaluated and propagated to the analysis by changing the nominal JVF cut value.
8.2.4 Jet Energy Resolution
The jet energy resolution is measured separately for data and simulation [71]. The fractional p
Treso- lution for jets was measured as a function of their p
Tand rapidity. A systematic uncertainty is defined as the difference in quadrature between the jet energy resolutions for data and simulation. To estimate the impact of this systematic uncertainty on this analysis, the energy of jets in the simulation is smeared by this residual difference, and the changes in the normalisation and shape of the final discriminant are compared to the default prediction. Since jets in the simulation cannot be under-smeared, the resulting uncertainty on the normalisation and shape of the final discriminant is one-sided by definition, and the resulting uncertainty is then symmetrised.
8.2.5 Jet Reconstruction
The jet reconstruction e
fficiency is found to be about 0.2% lower in the simulation than in data for jets below 30 GeV and is found to be consistent with data for higher jet p
T. To evaluate the effect of this inefficiency, 0.2% of the jets with p
Tbelow 30 GeV are removed randomly and all jet-related kinematic variables are recomputed, and the event selection is updated accordingly.
8.2.6 Heavy- and Light-Flavour Tagging
The efficiency of the flavour tagging algorithm has been measured for each jet flavour using control samples in data in simulation. From the ratio of e
fficiencies correction factors are defined to correct per-jet tagging rates in the simulation. In the case of b-jets, correction factors and their uncertainties are estimated based on observed and simulated b-tagging rates in t¯ t dilepton events [60]. In the case of c-jets, they are derived based on jets with identified D
∗mesons [72]. In both cases the correction factors are parameterised as a function of jet p
T. In the case of light-flavour jets, correction factors and their uncertainties are derived using dijet events, and they are parameterised as a function of jet p
Tand
η[73].
A total of six independent sources of uncertainty a
ffecting each the b- and c-tagging e
fficiency are considered in the OS dilepton channel while they are combined in one source each in the trilepton and SS dilepton channels. Each of the six uncertainties corresponds to an eigenvector resulting from diag- onalising the matrix containing the information of the total uncertainty per p
Tbin and the bin-to-bin correlations. Twelve uncertainties are considered for the light jet tagging in the OS dilepton channel which depend on the jet p
Tand
ηregion while, similarly to b- and c-tagging, they are combined in one source in the trilepton and SS dilepton channel since these channels use only event count information rather than shapes. These systematic uncertainties are taken as uncorrelated between b jets, c jets, and light-flavour jets.
8.3 Uncertainties on Signal Modelling
8.3.1 Scale and radiation
To assess the scale uncertainties on the t¯ tV modelling, the factorisation and renormalisation scales are
varied by a factor of two up and down with respect to the nominal values. Radiation uncertainties are
assessed by varying the strong coupling
αsin the matrix element calculation by a factor of two up
and down with respect to the nominal value, while simultaneously varying the amount of initial state
radiation in Pythia [74]. In addition, the jet p
Tmatching threshold is varied up and down by a factor of
jets between the reference and alternate samples. The dominating systematic uncertainty on the t¯ tV modelling is from the variation associated with the strong coupling
αsin the matrix element calculation with a simultaneous variation of the amount of initial state radiation in Pythia. This variation has a significant effect on the distribution of the number of jets in t¯ tV events.
8.3.2 PDF
Systematic uncertainties on the t¯ tV modelling due to PDF choice are evaluated using the uncertainty sets of the CT10 NLO [34], MSTW2008 68% CL NLO [32, 33] and NNPDF 2.3 NLO [36] sets. The final uncertainty was calculated as half the envelope encompassing the predictions from all three PDF sets along with their associated uncertainties, following the PDF4LHC recommendations [31].
8.4 Uncertainties on Background Modelling
Uncertainties on the background modelling differ significantly between the analysis channels due to large di
fferences in the background composition between the channels.
8.4.1 Same-sign dimuon and trilepton channels
Misidentified lepton background:
The uncertainty on the misidentified lepton background is esti- mated by measuring the real and misidentified lepton rates in two orthogonal regions, one with three or more jets, and another one with one or two jets. An additional uncertainty of 30% on this background rate originates from the subtraction of backgrounds in the control region to measure the fake lepton rates, and is dominated by low statistics in the regions where the rates are measured.
V H
background:Uncertainties of 20% are assumed for the normalisations of the W H and ZH pro- cesses.
Other backgrounds:
These include triboson and SM same-sign WW processes. A 100% uncertainty is considered for the sum of these backgrounds.
8.4.2 Opposite-sign dilepton channel
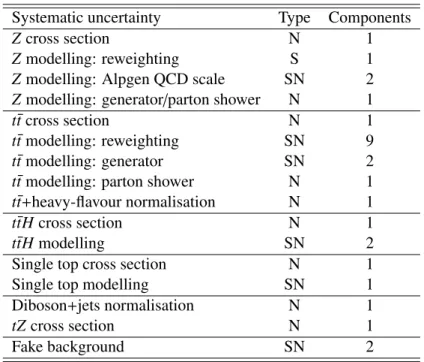
Table 7 presents a summary of the systematic uncertainties on the background modelling considered in the OS dilepton channel.
Z
+jets background:Four sources of uncertainties are considered: theoretical cross section uncer- tainty, uncertainty due to the Z p
Tcorrection, uncertainty due to scale choice for QCD emissions in A
lpgenand the uncertainty due to the choice of the generator.
•
An NNLO QCD cross section uncertainty of 4% is applied to the Z
+jets contribution [18]
•
A systematic uncertainty equal to the full size of the Z p
Tcorrection is included in the fit as a shape-only systematic to disentangle full shape and normalisation per jet multiplicity e
ffects in the description of the Z
+jets process.•
Several Z
+jets MC variation samples were used to assess the uncertainty due to the extrapolation
of the Z
+jets simulation prediction to high jet multiplicity. The variation of the scale associatedwith the strong coupling
αsin the matrix element (by a factor of two up and down) is found to
Systematic uncertainty Type Components
Z cross section N 1
Z modelling: reweighting S 1
Z modelling: Alpgen QCD scale SN 2
Z modelling: generator/parton shower N 1
t¯ t cross section N 1
t¯ t modelling: reweighting SN 9
t¯ t modelling: generator SN 2
t¯ t modelling: parton shower N 1
t¯ t
+heavy-flavour normalisation N 1
t¯ tH cross section N 1
t¯ tH modelling SN 2
Single top cross section N 1
Single top modelling SN 1
Diboson
+jets normalisation N 1
tZ cross section N 1
Fake background SN 2
Table 7: List of systematic uncertainties on the background modelling considered in the opposite-sign dilepton channel. Type “N” indicates that the uncertainty is taken as normalisation per jet multiplicity- only for all processes and channels affected, whereas type “S” indicates systematics that are considered full shape-only in all processes and channels. Type “SN” indicates that the uncertainty is taken as both shape and normalisation per jet multiplicity bin. Some of the systematic uncertainties are split into several different components for a more accurate treatment (the number of components is indicated in the column labeled as “Components”).
•
The effect of the choice of matrix element generator and parton shower on Z
+jets modelling isevaluated by using the Sherpa Z
+jets MC sample as an alternative model. In the analysis, the e
ffect of this model uncertainty is described as a separate rate uncertanity parameter for each jet multiplicity since a significant discrepancy between data and simulation is observed in the H
Thaddistribution in the high statistics (3j, 2b) region of 2`OSZ.
t¯ t
+jets background:Several systematic uncertainties a
ffecting the modelling of t¯ t
+jets are considered in this channel: systematic uncertainties due to the uncertainty on the cross section, uncertainties due to the choice of the parton shower and hadronisation model, and uncertainties due to the reweighting procedure applied to correct the t¯ t MC modelling. An additional uncertainty is assigned to account for the limited knowledge of the t¯ t production in association with heavy flavour jets.
•
An uncertainty of
+5%/-6% is assumed for the inclusivet¯ t production cross section as described in Sect. 3.
•
To improve agreement between data and t¯ t MC modelling a reweighting procedure based on the
di
fference between top quark p
Tand t¯ t system p
Tdistributions measured in data and in the simu-
elling in t¯ t events (up to 12% uncertainty on the overall normalisation of t¯ t in the (≥ 5j, 1b+ 2b) re- gion), the choice of the generator to simulate t¯ t production, and uncertainties on the components of jet energy calibration and jet resolution and jet flavour tagging.
•
An uncertainty due to the choice of the generator is evaluated by comparing a sample generated using M
adgraphinterfaced with P
ythiato the default t¯ t sample. E
ffects on the shapes are com- pared, symmetrised and applied to the shapes predicted by the default model after correcting both samples to match top quark p
Tand t¯ t p
Tdistributions as measured in the differential cross section analysis.
•
An uncertainty due to the choice of the parton shower and hadronisation model is derived by comparing events produced by Powheg interfaced with Pythia or Herwig. Only the effect on normalisation per jet multiplicity is considered from this source since the effect on the shape is found to be similar to the one from M
adgraph+P
ythia.
•
A systematic uncertainty of 50% is applied to the t¯ t
+HF components of t¯ t
+jets background ob- tained from the Powheg+Pythia MC simulation.
Single top background:
An uncertainty of 6.8% is assumed for the cross section of the single top production [75] corresponding to the theoretical uncertainty on Wt-channel production, the only process contributing to this final state. An additional modelling uncertainty on Wt production is obtained from a simulated sample which uses the alternative diagram subtraction approach in the Wt-channel production to avoid overlap between single top quark and t¯ t final states.
Misidentified lepton background:
An uncertainty of 50% is applied to the misidentified lepton yield across all selected regions to cover the maximum di
fference between yields obtained from the simulation and from SS dilepton events in data. An additional uncertainty is applied to cover the di
fference in shape of H
Tdistributions in the MC simulated and SS data events.
8.4.3 Common electroweak backgrounds modelling
Diboson background:
In the trilepton and same-sign dimuon channels the diboson background is dominated by WZ production. In the opposite-sign dilepton channel diboson background includes WW , WZ and ZZ production and the uncertainties are applied to the sum of these processes.
In all channels the uncertainty on the diboson background includes a 20% uncertainty estimated from the agreement between data and prediction in the trilepton CRZ region, and the observed uncertainty in the WZ prediction when theory assumptions are varied. Additional uncertainties are assigned due to a di
fference in jet and b-tag multiplicities between the trilepton and opposite-sign dilepton signal regions and the control region:
•
A 10% uncertainty is added to the WZ
+jets uncertainty in the trilepton and same-sign dimuonchannels to account for the extrapolation of the cross section with three light jets to the cross section with four light jets.
•
An uncorrelated 40% uncertainty is added to the WZ
+jets cross section in the trilepton and same- sign dimuon channels in quadrature in the signal regions requiring at least two b-tagged jets. This uncertainty is added to the diboson background in all selected regions in the opposite-sign dilepton channel to account for the modelling of diboson production associated with the heavy flavour jets.
In the trilepton and same-sign dimuon channels a 100% uncertainty is applied to the ZZ background
t¯ tH
background:An uncertainty of 12% is assumed for the theoretical cross section of t¯ tH produc- tion [42] in all channels. Additional uncertainties that a
ffect t¯ tH kinematics are applied in the OS dilepton channel. They come from the choice of factorisation and renormalisation scales and the functional form of the scale in t¯ tH simulated samples. The effect of the variations is studied at particle level and the nominal P
owH
elt¯ tH MC sample is reweighted to reproduce these variations.
tZ
background:An uncertainty of 20% is assumed for the theoretical cross section of the tZ back- ground. An additional uncorrelated 15% uncertainty arising from scale,
αsand the jet p
Tthreshold variations, is applied to the tZ background in the trilepton and same-sign dimuon channels.
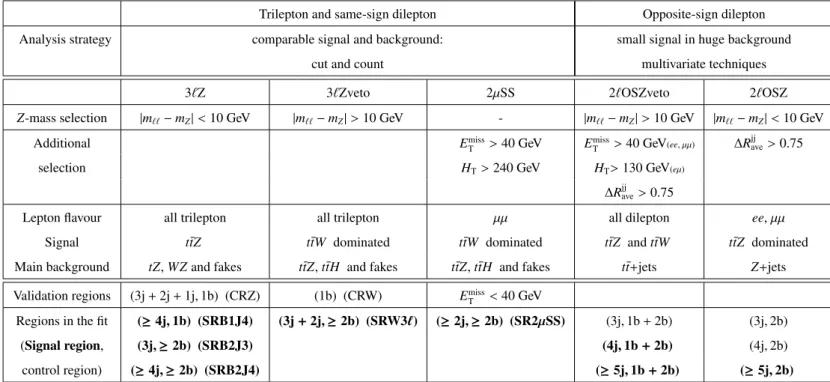
9 Results
A summary of all three channels with their corresponding fit regions used to measure t¯ tW and t¯ tZ pro- duction in this analysis is shown in Table 8.
Trilepton and same-sign dilepton Opposite-sign dilepton
Analysis strategy comparable signal and background: small signal in huge background
cut and count multivariate techniques
3`Z 3`Zveto 2µSS 2`OSZveto 2`OSZ
Z-mass selection |m``−mZ|<10 GeV |m``−mZ|>10 GeV - |m``−mZ|>10 GeV |m``−mZ|<10 GeV
Additional EmissT >40 GeV EmissT >40 GeV(ee,µµ) ∆Rjjave>0.75
selection HT>240 GeV HT>130 GeV(eµ)
∆Rjjave>0.75
Lepton flavour all trilepton all trilepton µµ all dilepton ee,µµ
Signal t¯tZ ttW¯ dominated ttW¯ dominated ttZ¯ andttW¯ ttZ¯ dominated
Main background tZ,WZand fakes t¯tZ,t¯tH and fakes t¯tZ,t¯tH and fakes t¯t+jets Z+jets Validation regions (3j+2j+1j,1b) (CRZ) (1b) (CRW) EmissT <40 GeV
Regions in the fit (≥4j,1b) (SRB1J4) (3j+2j,≥2b) (SRW3`) (≥2j,≥2b) (SR2µSS) (3j,1b+2b) (3j,2b)
(Signal region, (3j,≥2b) (SRB2J3) (4j,1b+2b) (4j,2b)
control region) (≥4j,≥2b) (SRB2J4) (≥5j,1b+2b) (≥5j,2b)