ATLAS-CONF-2013-024 09/04/2013
ATLAS NOTE
ATLAS-CONF-2013-024
March 7, 2013
Minor Revision: April 9, 2013
Search for direct production of the top squark in the all-hadronic t t ¯ + E
Tmissfinal state in 21 fb
−1of p-p collisions at √
s = 8 TeV with the ATLAS detector
The ATLAS Collaboration
Abstract
The results of a search for direct pair production of scalar partners of the top quark in 20.5
fb−1of
ppcollisions at
√s=8
TeV using the ATLAS detector at the LHC are reported. The top squarks are assumed to decay exclusively into a top quark and the lightest supersymmetric particle. The search is conducted in events with large missing transverse momentum and six or more jets, targeting the fully- hadronic top final state. Results are interpreted in a
R-parity conserving minimalsupersymmetric scenario of direct top squark pair production. Top squarks in this model with masses between 320 and 660 GeV are excluded at 95%
CLfor a nearly massless LSP. For a LSP mass of 150 GeV the exclusion interval is between 400 and 620 GeV. The result significantly extends previous limits in the all-hadronic final state and excludes top squarks up to higher masses than in previous searches.
In the version of March 7, Fig. 4 left was missing the contribution from Z+jets. This plot has now been replaced. Only this plot was affected. The analysis and the results remain unchanged.
c Copyright 2013 CERN for the benefit of the ATLAS Collaboration.
Reproduction of this article or parts of it is allowed as specified in the CC-BY-3.0 license.
1 Introduction
The recent observation at the Large Hadron Collider (LHC) [1] of a particle consistent with the Standard Model (SM) Higgs Boson [2, 3] has brought renewed attention to the gauge hierarchy problem [4–7]. Supersymmetry (SUSY) [8–16] provides an extension of the SM which resolves the hierarchy problem [17–22] by introducing supersymmetric partners of the known bosons and fermions. The dominant contribution to the divergence of the Higgs boson mass arises from loop diagrams involving the top quark; these can be largely canceled if the scalar part- ner of the top quark (top squark) has a mass below approximately the TeV scale [23, 24]. The two top squark states (˜
tLand
t˜R), superpartners corresponding to the left- and right-handed top quarks, mix to form the two mass eigenstates,
t˜1and
t˜2; due to the large top Yukawa coupling, the mixing can be large, resulting in a significant mass-splitting between the lighter (designated as
t˜1) and heavier top squarks. In the framework of the
R-parity conserving minimal supersym-metric extension of the SM (MSSM) [17, 25–28], SUSY particles are produced in pairs and the lightest supersymmetric particle (LSP) is stable, providing a possible candidate for dark matter.
The undetected LSP results in missing transverse momentum, whose magnitude is denoted as
ETmiss.
This note reports on a search with the ATLAS detector for direct
t˜1pair production, extend- ing the analysis described in Ref. [29]. The search utilizes the full 2012 dataset, collected at a
ppcenter-of-mass energy of
√s=8
TeV and corresponding to an integrated luminosity of 20.5 fb
−1. The search is optimized under the assumption that each top squark decays exclu- sively to a top quark and the LSP, and is targeted towards top quark decay in the all-hadronic channel. The final state for this search is therefore six or more jets and
ETmiss. The search is nearly insensitive to the details of the top quark polarization, and hence to the mixture of
t˜Land
t˜Rin the mass eigenstates. Previous searches for direct top squark production at center- of-mass energies of 7 and 8 TeV have been reported by the ATLAS [30–34] and CMS [35–38]
collaborations.
2 Simulated event samples and SUSY signal modeling
Samples of simulated events are used for the description of the background and to model the SUSY signal. The main backgrounds to this search arise from
tt¯production where one top de- cays semi-leptonically (with the lepton, primarily taus, mis-identified as a jet),
Z(→νν)plus heavy-flavor jets, and the irreducible background from
t¯t+Z(
→νν). Other background pro-cesses which are considered are multijets,
Zplus light-flavor jets,
Wplus light- and heavy-flavor jets, single-top,
tt¯+W,
tt¯+WW , and diboson production.
Top quark pair production, followed by the leptonic decay of one of the top quarks, is simulated with POWHEG [39] while MC@NLO [40, 41] is used to model top quark pair production in the all-hadronic channel, as well as single-top production in the
s- andW tchannels. ACER MC [42] is used for single-top production in the
t-channel.SHERPA [43] is used for
W+jets and
Z+jets production (including heavy-flavor jets) as well as for diboson (WW,
ZZand
W Z)production. MADGRAPH [44] is used for
tt¯+Z,tt¯+Wand
tt¯+WWproduction.
The fragmentation/hadronization for the MC@NLO samples are performed with HERWIG [45],
using JIMMY [46] for the underlying event, while PYTHIA [47] is used for samples gener-
ated with POWHEG, MADGRAPH and ACER MC. The parton density function (PDF) sets used
for the SM backgrounds are: CT10 [48] for the MC@NLO, POWHEG and SHERPA samples, and
CTEQ6L1 [49] for the MADGRAPH and ACER MC samples. The underlying event tunes are the
ATLAS AUET2B [50] for POWHEG, ACER MC and MADGRAPH samples and AUET2 [51] for the
MC@NLO sample.
For the initial comparison with data, all SM background cross sections are normalized to the results of higher-order calculations when available. The theoretical cross sections for
W+jets and
Z+jets are calculated with DYNNLO [52] with the MSTW 2008 NNLO [53] PDF set. Thesame K-factor, i.e. the ratio of next-to-next-leading-order (NNLO) to leading-order cross sec- tions, is applied to the production of
W/Zin association with heavy-flavor jets. The inclusive
tt¯cross section is calculated with HATHOR 1.2 [54] using MSTW 2008 NNLO PDFs. The pro- duction of
t¯tin association with
W/Zare normalized to NLO cross sections [55, 56]. Single-top cross sections are taken from MC@NLO. For the diboson cross sections, MCFM [57] with the MSTW 2008 NLO PDFs is used. The
tt¯+WW cross section is taken from MADGRAPH.
The signal samples are generated using HERWIG++ [58]. The mixing matrices for the top squark and for the neutralinos are chosen such that the top quark produced in the decay has a right-handed polarization in 95% of the decays. A subset of signal samples are generated with top squarks corresponding to the left-handed top quark in order to assess the impact on the signal acceptance. Signal cross sections are calculated to NLO in the strong coupling constant, adding the resummation of soft gluon emission at next-to-leading-logarithmic accuracy (NLO+
NLL) [59–61]. The nominal cross section and the uncertainty are taken from an envelope of cross section predictions using different PDF sets and factorization and renormalization scales, as described in Ref. [62].
The detector simulation [63] is performed using GEANT4 [64] or a fast simulation frame- work where the showers in the electromagnetic and hadronic calorimeters are simulated with a parametrized description [65] and the rest of the detector simulated with GEANT4. All sam- ples are produced with a range of simulated minimum-bias interactions overlaid on the hard- scattering event to account for multiple
ppinteractions in the same bunch crossing (pile-up).
The overlay also treats the impact of pile-up from bunch crossings other than the one in which the event occurred. Corrections are applied to the simulated samples to account for differences between data and simulation for the lepton trigger and reconstruction efficiencies, momentum scale and resolution, and for the efficiency and mis-tag rates for
b-quark tagging.3 Trigger and data collection
The ATLAS detector
1has been described elsewhere [66,67]. The data used in this analysis were collected from the end of March through mid-December 2012 during which the instantaneous luminosity of the LHC reached
7.7×1033cm−2s−1. The average number of interactions per bunch crossing ranged from approximately 5 to 40 during the run, with an average of about 21. After the application of beam, detector, and data-quality requirements, the total integrated luminosity is 20.5 fb
−1.
The data were collected using several triggers. For the top squark search itself, a missing transverse energy trigger was used. This trigger bases the bulk of its rejection on the vector sum of transverse energies deposited in projective trigger towers (each with a size of approximately
∆η×∆φ∼0.1×0.1
for
|η|<2.5and larger and less regular in the more forward regions). A more refined calculation based on the vector sum of all calorimeter cells above threshold is made at a later stage in the trigger processing. The trigger required
ETmiss >80 GeV, and is
1ATLAS uses a right-handed coordinate system with its origin at the nominal interaction point (IP) in the centre of the detector and thez-axis along the beam pipe. Thex-axis points from the IP to the centre of the LHC ring, and theyaxis points upward. Cylindrical coordinates(r,φ)are used in the transverse plane,φbeing the azimuthal angle around the beam pipe. The pseudorapidity is defined in terms of the polar angleθasη=−ln tan(θ/2).
fully efficient for offline calibrated
ETmiss>150GeV, for events passing the jet multiplicity and
pTrequirements described in Section 5.
Data samples enriched in the major sources of background were collected with electron and muon triggers. The electron trigger selects events based on the presence of clusters in the electromagnetic calorimeter, with a shower shape consistent with that of an electron and a matching track in the tracking system. The transverse energy threshold at the trigger level was 24 GeV (12 GeV) for single (double) electrons. Electron isolation requirements at the trigger level were as follows. The transverse energy in the section of the hadronic calorimeter behind the cluster was required to be less than 1 GeV, and the scalar sum of the
pTof tracks within a cone of radius
∆R= p(∆η)2+ (∆φ)2=0.2
around the electron (excluding the electron itself) was required to be less than 10% of the electron
ET. In order to recover some of the efficiency for high-
pTelectrons, events were also collected with a single-electron trigger with looser shower shape requirements, and no isolation requirements, but with a
ETthreshold of 60 GeV. The muon trigger selects events containing one or more muon candidates based on tracks identified in the muon spectrometer and inner detector. For the single-muon trigger, the
pTthreshold was 24 GeV, and the scalar sum of the
pTof tracks within a cone of radius
∆R=0.2around the muon (excluding the muon itself) was required to be less than 12% of the muon
pT. To recover some of the efficiency for higher
pTmuons, events were also collected with a single-muon trigger with a
pTthreshold of 36 GeV with no isolation requirement. The di-muon trigger required one muon above a
pTthreshold of 18 GeV with a second muon above 8 GeV, both without requirements on isolation.
Jet triggers were used to collect data samples for the estimation of the multijet and fully- hadronic
tt¯backgrounds. The jet
pTthresholds ranged from 55 to 460 GeV. In order to stay within the bandwidth limits of the trigger system, only a fraction of events passing these trig- gers were recorded to permanent storage.
4 Object reconstruction
The reconstructed primary vertex [68] is required to be consistent with the beam spot envelope and to have at least five associated tracks; when more than one such vertex is found, the vertex with the largest summed
|pT|2of the associated tracks is chosen.
Electrons, muons and jets are selected in two stages. Electrons are reconstructed from en- ergy clusters in the electromagnetic calorimeter matched to a track in the inner detector [69].
Pre-selected electrons are required to have
|η|<2.47and pass a variant of the “loose” selection defined in Ref. [69], re-optimized for 2012 data. Pre-selected electrons are further required to have
pT >10 GeV. Muons are identified either as a combined track in the muon spectrometer and inner detector systems, or as an inner detector track matched with a muon spectrometer segment [70, 71]. Pre-selected muons are required to have
|η|<2.4and
pT >10 GeV. Jets arereconstructed using the anti-k
talgorithm [72, 73] with a distance parameter
R=0.4. Events containing jets arising from detector noise, cosmic rays or other non-collision sources are re- jected [74]. Pre-selected jets are required to have
pT>20 GeV and
|η|<4.5. Since electrons arealso reconstructed as jets, pre-selected jets which overlap with pre-selected electrons within a distance
∆R=0.2are discarded. The missing transverse momentum is computed as described in Ref. [75], but using the list of pre-selected electrons, muons and jets instead of the defaults.
The missing transverse momentum from the tracking system (denoted as
ETmiss,track) is com- puted from the vector sum of the reconstructed tracks with
pT>0.5GeV and associated with the primary vertex in the event.
For the final selection of signal candidates, jets are required to have
pT >35 GeV and
|η|<2.8. Jets with|η|<2.5
arising from
b-quarks are identified using information about trackimpact parameters and reconstructed secondary vertices [76]; the
b-tagging algorithm is basedon a neural network using the output weights of the IP3D, JetFitter+IP3D, and SV1 algorithms (defined in Ref. [77, 78]) as input. The
b-tagging requirements are set at an operating pointcorresponding to an average efficiency of 70% for
b-jets in simulatedtt¯events, for which the algorithm provides a rejection factor of approximately 150 for light-quark and gluon jets (de- pending on the
pTof the jet) and a rejection of approximately 5 for charm jets.
For the selection of events in background control regions (described in Sec. 6) requiring leptons, the requirements on electrons and muons are tightened. Electrons are required to pass a variant of the “tight” selection of Ref. [69], re-optimized for 2012 data, and must have
|η|<2.47
and a distance to the closest jet
∆R>0.4. Electrons are required to satisfy track- andcalorimeter-based isolation criteria. The scalar sum of the
pTof tracks within a cone of radius
∆R=0.3
(“track isolation”) around the electron (excluding the electron itself) is required to be less than 16% of the electron
pT. The scalar sum of the
ETof calorimeter energy deposits (cor- rected for pile-up) within a cone of radius
∆R=0.3(“calorimeter isolation”) around the electron (again, excluding the electron itself) is required to be less than 18% of the electron
pT. The im- pact parameter of the electron in the transverse plane with respect to the reconstructed event primary vertex is required to be less than five times the expected impact parameter uncertainty while the impact parameter along the beam direction is required to be less than 0.4 mm. Muons are required to have
|η|<2.4and
∆R>0.4with respect to the closest jet. Further isolation cri- teria are imposed: both the track and calorimeter isolation are required to be less than 12% of the muon
pT. The transverse impact parameter of the muon is required to be less than three times the expected uncertainty; the longitudinal impact parameter is required to be less than 0.4 mm. The lepton
pTrequirements vary by background control region, as summarized below in Table 1.
5 Event selection
The event selection criteria are listed in Table 1 for the signal selection as well as the background control region (described in Sec. 6).
Events containing fake
ETmissarising from jets associated with calorimeter noise or non- collision backgrounds [79], or by cosmic-ray muons or poorly reconstructed muons [71, 80]
are rejected. Signal events are required to contain no pre-selected electrons and muons with
∆R>0.4
with respect to the closest pre-selected jet. Six or more jets are then required, of which
≥2
must have been
b-tagged. The two leading jets are required to havepT>80GeV with the re- maining jets having
pT>35GeV. Events with
ETmissarising from mis-measured jets or from jets containing an undetected semi-leptonically decaying heavy-flavor hadron are rejected by re- quiring the azimuthal angle (∆φ ) between the
ETmissdirection and any of the three highest
pTjets in the event (∆φ
(jet,EmissT )) to be greater than 0.2π. Further reduction of such events is achieved by requiring the
ETmisscalculated from the tracking system to be greater than 30 GeV and to have an angular separation
∆φ(ETmiss,ETmiss,track)less than
π/3radians with respect to the
ETmisscalcu- lated from the calorimeter system. Events containing tau leptons that are reconstructed as jets are rejected by vetoing events containing a non-b-tagged jet with
≤4associated tracks, where the
∆φbetween the jet and the direction of
ETmissis less than
0.2π; this requirement is listed as
“tau veto” in Table 1. The background from semi-leptonic
tt¯background is further reduced by requiring the transverse mass (m
T) between the
ETmissand the
b-tagged jet closest in∆φto the
ETmissdirection (m
T(b,ETmiss) =q
2pbTETmiss(1−cos(∆φ(~pbT,~pTmiss)))
) to be greater than 175 GeV.
Signal tt¯CR Z+jets CR Multijet CR
single two
Trigger
ETmisselectron (muon) electron (muon)
ETmissNlep
0 1 2 0
p`T <
10 (10)
>35 (35)
>20 (20)
<10 (10)
p`T2
—
<10 (10)
>20 (10) —
m``
— — 81 to 101 —
Njet ≥
6
≥6
≥6
≥6pTjet >
80,80,35,...35
>80,80,35,...35
>80,80,35,...35
>80,80,35,...35
Nb-jet ≥2 ≥2 ≥2 ≥2
mj j j
80 to 270 0 to 600 80 to 270 —
ETmiss >
200, 300, 350
>200, 300, 350
>70
>160
ETmiss,track >30 >30 >30 >30
∆φ(ETmiss,ETmiss,track) <π/3 <π/3 <π/3 >π/3
mT(`,ETmiss)
— 40 to 120 — —
∆φ(jet,EmissT ) >π/5 >π/10 >π/5 <π/5
mT(b-jet,ETmiss) >175
—
>175
>175
Tau veto yes no yes no
Table 1: Overview of the selection criteria for the signal and control (CR) regions in this anal- ysis. The
pTselections for leptons are given for electrons (muons). All mass and momentum requirements are in units of GeV. For the multijet CR, the requirements on
∆φ(ETmiss,ETmiss,track)and
∆φ(jet,EmissT )are imposed in a logical OR. For the
Z+jets CR, theETmiss-related requirements are shown after having recomputed
ETmissfollowing the removal of the two leptons.
Finally, the event is required to have two 3-jet systems whose invariant masses are consistent with that of the top quark. To reduce the combinatorics, the three closest jets in the
η−φplane are combined to form one 3-jet system. A second 3-jet system is defined by repeating the proce- dure. The invariant mass of each of the 3-jet systems is required to be between 80 and 270 GeV.
The final discriminating variable between signal and background is
ETmiss. Three signal regions (denoted by SRn, where n=1,2,3) are defined, targeting different ranges of the top squark mass, by varying the lower edge of the
ETmissrequirement, SR1:
≥200GeV, SR2:
≥300GeV, and SR3:
≥350
GeV.
6 Background estimation
The backgrounds from semi-leptonic
tt¯and
Z+jets events are estimated by defining two controlregions, one for each background; the control region is defined such that the process of interest
is dominant. The simulation is normalized to data in that control region, and the simulation is
used to extrapolate the background expectation into the signal region. The multijet background
is estimated from the data by taking a sample of well-measured multijet events and smearing
the jet energies by a jet response function, determined with PYTHIA8 [81] (and cross-checked
against the data), separately for light-quark and heavy-flavor jets; this procedure also accounts
for the background from all-hadronic
t¯tevents. All other backgrounds in the signal and in the
control regions are estimated entirely from the simulation, using the most accurate theoretical
cross sections available.
The control sample for the semi-leptonic
tt¯background is defined with requirements sim- ilar to those described in Sec. 5 for the top squark signal candidates but with the following differences. The data sample is based on the single-electron or muon trigger. The requirements on the lepton veto, the tau veto and on
mT(b,ETmiss)are removed. The presence of a single lepton (as described in Sec. 4) is required; events with an additional isolated electron or muon with
pT>10GeV are rejected. The transverse mass between the lepton and
ETmissis required to be between 40 and 120 GeV. The lepton is then treated as a non-b-tagged jet before imposing the jet and
b-tagged jet multiplicity requirements. The requirement on∆φbetween the three leading
pTjets and
ETmissis relaxed to be greater than
0.1π. The mass requirements on the two 3-jet sys- tems are relaxed; the minimum requirement is removed, and the maximum is set to 600 GeV.
Three control regions are then defined, one for each signal region, with the same
ETmissrequire- ment as the corresponding signal region. Figure 1 compares several distributions in data and simulation after these requirements for the semi-leptonic
tt¯control region corresponding to SR1 (E
Tmiss>200GeV). The normalization of the simulation to the data in the
t¯tcontrol region is performed in a fit described in Sec. 7.
The control sample for
Z(→νν)plus heavy-flavor jets background is based on a sample
of
Z(→``)+jets events (where`denotes either an electron or muon). The events are collected
with the dilepton triggers. Exactly two oppositely charged electrons or muons are required with
pT>20,20GeV for electrons and
pT>20,10GeV for muons. The invariant mass of the dilepton pair is required to be between 81 and 101 GeV. To reduce the
tt¯contamination, the events are required to have
ETmiss<50GeV. The reconstructed dileptons are then removed from the event and the vector sum of their momenta is added to both the calorimeter and track- based
ETmiss; after this recalculation of the
ETmissthe events are required to have
ETmiss>70GeV.
The remaining requirements for the top squark signal regions are then applied. Figure 2 shows the distribution of
ETmissafter it has been recomputed, following the removal of the two leptons from the event. Based on the comparison in the control region, the simulation is scaled up by a factor of
1.06±0.35to match the data.
The multijet (including fully-hadronic
tt) backgrounds are evaluated using the jet-smearing¯technique described in Ref. [82]. To validate the technique, the smeared samples are com- pared to data in a region enriched in multijet events. Six or more jets are required, with the same requirements as in the signal search, including the requirement of two or more
b-taggedjets. The calorimeter-based (track-based)
ETmissis required to be greater than 160 (30) GeV. The requirements on the masses of the two 3-jet systems are dropped. One of the signal region requirements on the azimuthal separation
∆φ(jet,EmissT )or
∆φ(ETmiss,ETmiss,track)is inverted to en- hance the population of mis-measured multijet events, and the smeared sample is normalized to the data. Figure 3 shows the distribution of these two quantities in the multijet control re- gion. The multijet (and fully-hadronic
tt) backgrounds in the signal regions are then evaluated¯by applying the remaining signal region requirements on the smeared event sample.
The contamination in the control regions from signal events is ignored. From simulation, the contamination is expected to be at most a few percent in the top and multijet control regions and negligible in the
Z+jets control region.7 Systematic uncertainties and background fit
Systematic uncertainties have an impact on the expected background and signal event yields
in the control and signal regions. These uncertainties are treated as nuisance parameters in a
profile likelihood fit described later in this section. The following systematic uncertainties on
the reconstructed objects are taken into account. The jet energy scale (JES) and jet energy res-
200 250 300 350 400 450 500
Events / 50 GeV
1 10 102
103
104
105
>200 GeV
miss
ET
1-lepton, CRTop
Data 2012 SM Total
t t SingleTop
+V t t W Z Diboson
)=(400,1) GeV 1 χ∼0 1,
~t (
)=(600,1) GeV 1 χ∼0 1,
~t ( = 8 TeV
s
-1, L dt = 20.5 fb
∫ATLAS Preliminary
[GeV]
miss
ET
200 250 300 350 400 450 500
Data / SM
0 0.5 1 1.5 2
>
0 100 200 300 400 500 600 700 800
Events / 50 GeV
1 10 102
103
104
105
>200 GeV
miss
ET
1-lepton, CRTop
Data 2012 SM Total
t t SingleTop
+V t t W Z Diboson
)=(400,1) GeV 1 χ∼0 1,
~t (
)=(600,1) GeV 1 χ∼0 1,
~t ( = 8 TeV
s
-1, L dt = 20.5 fb
∫ATLAS Preliminary
) [GeV]
miss
ET T(b, m
0 100 200 300 400 500 600 700 800
Data / SM
0 0.5 1 1.5 2
>
4 6 8 10 12 14 16
Events
1 10 102
103
104
>200 GeV
miss
ET
1-lepton, CRTop
Data 2012 SM Total
t t SingleTop
+V t t W Z Diboson
)=(400,1) GeV 1 χ∼0 1, t~ (
)=(600,1) GeV 1 χ∼0 1, t~ ( = 8 TeV
s
-1, L dt = 20.5 fb
∫
ATLAS Preliminary
njets
4 6 8 10 12 14 16
Data / SM
0 0.5 1 1.5 2
>
100 200 300 400 500 600
Events / 50 GeV
20 40 60 80 100 120 140 160
>200 GeV
miss
ET
1-lepton, CRTop
Data 2012 SM Total
t t SingleTop
+V t t W Z Diboson
)=(400,1) GeV 1 χ∼0 1,
~t (
)=(600,1) GeV 1 χ∼0 1,
~t ( = 8 TeV
s
-1, L dt = 20.5 fb
∫
ATLAS Preliminary
[GeV]
0
mjjj
100 200 300 400 500 600
Data / SM
0 0.5 1 1.5 2
>
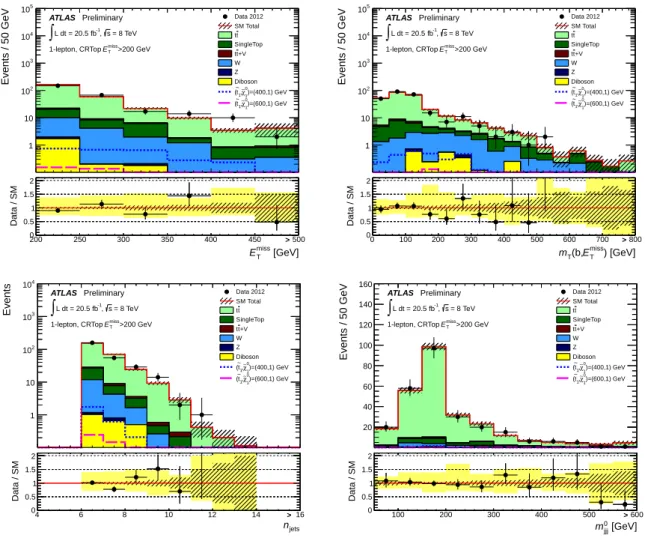
Figure 1: Distributions in the semi-leptonic
tt¯control region for SR1 (E
Tmiss >200GeV) after the application of all selection requirements. All kinematic quantities have been recalculated after having treated the lepton as a jet. Top left:
ETmiss. Top right:
mT(b,ETmiss). Bottom left:jet multiplicity. Bottom right: invariant mass of the first selected 3-jet system. The stacked his- tograms show the Standard Model expectation, normalized using the theoretical cross sections.
The expectation from two representative signal points (with top squark masses of 400 GeV and
600 GeV and a nearly massless LSP) are shown unstacked. The “Data/SM” plots show the ratio
between data and the total Standard Model expectation. The rightmost bin includes all over-
flows. The grey uncertainty band around the Standard Model expectation shows the statistical
uncertainty and the yellow band (shown only for the “Data/SM” plots) shows the combination
of statistical and systematic uncertainties.
0 50 100 150 200 250 300 350 400 450
Events/ 70 GeV
1 10 102
103
Z+jets CR, After b-tagging
Data 2012 SM Total Z
t t = 8 TeV
s
-1, L dt = 20.5 fb
∫ATLAS Preliminary
[GeV]
miss
ET
0 50 100 150 200 250 300 350 400 450
data / SM
0 1 2
0 100 200 300 400 500 600 700
Events/ 70 GeV
1 10 102
103
104
Z+jets CR, After 6 jets
Data 2012 SM Total Z
t t = 8 TeV
s
-1, L dt = 20.5 fb
∫ATLAS Preliminary
[GeV]
miss
ET
0 100 200 300 400 500 600 700
data / SM
0 1 2
Figure 2: The
ETmissdistribution in the
Z+jets control region after all selection requirements(left) and without the requirement on the number of
b-tagged jets (right). TheETmisshas been recomputed after removing the two leptons from the event. The stacked histograms show the Standard Model expectations, normalized using the theoretical cross sections. The “Data/SM”
plots show the ratio between data and the total Standard Model expectation. The uncertainty band around the Standard Model expectation is the combination of statistical and systematic uncertainties.
Events / 0.2
10 102
103
104 Preliminary ∫ L dt ~20.5 fb-1, s = 8 TeV
ATLAS Data 2012
SM Total Multijet Estimate
t t +V t t single top W Z
)=(400,1) GeV 1 χ∼0 1, t~ (
)=(600,1) GeV 1 χ∼0 1, t~ (
miss) ET
φ(j,
0 0.5 1 1.5 2 2.5∆ 3
Data / SM
0.5 1 1.5 2 2.5
Events / 50 GeV
1 10 102
103
104 Preliminary ∫ L dt ~20.5 fb-1, s = 8 TeV
ATLAS Data 2012
SM Total Multijet Estimate
t t +V t t single top W Z
)=(400,1) GeV 1 χ∼0 1,
~t (
)=(600,1) GeV 1 χ∼0 1,
~t (
[GeV]
miss
ET
150 200 250 300 350 400 450 500 550 600
Data / SM
0.5 1 1.5 2 2.5
Figure 3: Distributions of
∆φ(jet,EmissT )(left) and
ETmiss(right) in the multijet control re- gion. The left plot is shown with neither the requirement on
∆φ(jet,EmissT )nor the one on
∆φ(ETmiss,ETmiss,track)
applied. The stacked histograms show the Standard Model expectations.
The expectation from two representative signal points (with top squark masses of 400 GeV and
600 GeV and a nearly massless LSP) are shown unstacked. The multijet contribution has been
normalized to the data after subtraction of the other backgrounds normalized to theoretical
cross sections. The “Data/SM” plots show the ratio between data and the total Standard Model
expectation. The rightmost bin includes all overflows. The uncertainty band around the Stan-
dard Model expectation shows the statistical uncertainty only.
olution (JER) uncertainties are determined from 2012 data, using the techniques described in Refs. [74] and [83]. Uncertainties on the lepton identification, momentum/energy scale and resolution are estimated from samples of
Z → `+`−,
J/ψ →`+`−and
W± →`±νdecays in data [69–71]. The uncertainties on the jet and lepton energies are propagated to the
ETmiss; an ad- ditional
ETmissuncertainty arising from energy deposits not associated with any reconstructed objects is also included [75]. Uncertainties on the
b-tagging efficiency are derived from datasamples tagged with muons associated with jets, either utilizing templates of the muon mo- mentum transverse to the closest jet [76] or following the “System8” [84] method [85]. Uncer- tainties on the light-flavor mis-tag rate are derived by examining tracks with negative impact parameter [86] while charm mis-tag uncertainties are obtained from data samples tagged by reconstructing
D∗mesons [87].
Uncertainties from the identification efficiency for jets associated with the reconstructed primary vertex and from the overlay of pile-up in simulated events are both found to be negli- gible.
Uncertainties in the multijet and fully-hadronic
tt¯backgrounds arise from the following uncertainties in the jet-smearing technique: heavy-flavor tagging, Gaussian core and non- Gaussian tail components of the jet response function, and the jet energy scale. The level of agreement between the data and expectation in Fig. 3 indicates that the systematic uncertainty in the background is within 50%. An uncertainty of 100% is assigned to be conservative.
Theoretical uncertainties in the extrapolation of the semi-leptonic
tt¯background from the control regions to the signal regions are studied as follows. The impact of missing higher-order diagrams in the matrix element is assessed by varying the renormalization and factorization scales in POWHEG up and down by a factor of two from their nominal values. The effects from varying each of the scales independently are added in quadrature. The impact of modeling uncertainties in fragmentation and hadronization is studied by comparing POWHEG samples in- terfaced to PYTHIA versus those interfaced to HERWIG/JIMMY. The difference is symmetrized to give the total uncertainty. Uncertainties in the modeling of initial- and final-state radiation (ISR and FSR) are evaluated using several ACER MC samples with differing parton shower set- tings, constrained by measurement [88]. Half of the difference between the samples is taken as the uncertainty. The impact of treating the lepton in the control region simply as a jet is found to be negligible. For the
Z+jets background, an uncertainty on the extrapolation from controlregion to signal region is assessed by varying the factorization and renormalization scales up and down by a factor of two from their nominal values.
The uncertainty on the integrated luminosity of 3.6% is derived, following the same method- ology as that detailed in Ref. [89], from a preliminary calibration of the luminosity scale derived from beam-separation scans performed in April 2012. The uncertainties on the cross sections for
tt¯+W and
tt¯+Z are taken to be 50%, motivated by the cross section uncertainty in Ref. [55]
and additional uncertainties on kinematic distributions evaluated with MADGRAPH+PYTHIA.
The uncertainty on the cross section for
Wproduction in association with heavy flavor jets is taken from Ref. [90].
The uncertainty in the signal cross section is taken from an envelope of cross section predic- tions using different PDF sets (including the
αSuncertainty) and factorization and renormal- ization scales, as described in Ref. [62].
The background in the signal region and the impact of systematic uncertainties on the back- ground yields and signal estimates are estimated with a fit based on the profile likelihood method [91]. The inputs to the fit are as follows:
1. The observed number of events in the semi-leptonic
t¯tcontrol region and the number
expected from initial background estimates.
2. Transfer factors (TF) which are multiplicative factors that propagate the event count from the semi-leptonic
tt¯control regions to the signal regions.
3. Background estimates in the signal region for
Z+jets, multijets and fully-hadronictt¯ob- tained as described in Sec. 6.
4. Expectations from simulation for the number of events from the remaining backgrounds (t
t¯+boson,
W+jets, single-top, diboson) in the signal regions.
The event count in each of the three control and three signal regions is treated with a Pois- son probability density function. The statistical and systematic uncertainties on the expected yields are included in the probability density function as nuisance parameters, constrained to be Gaussian with a width given by the size of the uncertainty. Seventeen nuisance parameters are included in the fit. Correlations in the nuisance parameters from the
t¯tcontrol region to the signal region are taken into account where necessary. The Poisson probability density func- tions also includes a free parameter to scale the expected contribution from the semi-leptonic
t¯tbackground in its control region. A likelihood is formed as the product of these probability density functions and the constraints on the nuisance parameters. The one free parameter and the nuisance parameters are adjusted to maximize the likelihood.
8 Results and interpretation
The predicted background in the signal regions and the observed numbers of events are shown in Table 2. No significant discrepancy is seen between the observed yields and SM expectations.
Number of events SR1 SR2 SR3
Observed 15 2 1
Expected background 17.5±3.2 4.7±1.5 2.7±1.2
Expectedtt¯ 9.8±2.6 1.9±1.3 0.9±0.7
Expectedtt¯+W/Z 1.7±1.0 0.7±0.4 0.51±0.30
ExpectedZ+jets 2.1±1.0 1.2±0.5 0.8±0.4
ExpectedW+jets 1.2±0.8 0.32±0.29 0.19+0.23−0.19
Expected single-top 1.5±0.9 0.5±0.4 0.3+0.5−0.3
Expected multijet 0.12±0.12 0.01±0.01 <0.01
Expected diboson 1.2±1.2 <0.22 <0.22
Fit input expectationtt¯ 9.9 1.7 0.6
Table 2: The observed numbers of events in the three signal regions, and the background expec- tations. The input to the fit for the semi-leptonic
t¯tbackground is also shown. The uncertainties shown are the statistical plus systematic uncertainties on the mean of the Poisson function de- scribing the background probability density. Uncertainties on the inputs are not shown as they are almost the same as the uncertainties from the fit. Numerical rounding can cause the sum of the individual backgrounds to not add up exactly to the total.
The systematic uncertainty on the background ranges between 18% and 45% across the
three signal regions. Significant contributions to this uncertainty arise from the theoretical
modeling of the main background processes, the jet energy scale/resolution and the limited number of events in the signal region for the background simulation samples. The dominant sources of systematic uncertainty are summarized in Table 3.
Uncertainty SR1 SR2 SR3
Total 18% 33% 45%
Background sample sizes (data and simulation) 10% 17% 21%
Jet energy scale and resolution 10% 10% 25%
tt¯theory 10% 19% 22%
Z+jets theory 4% 8% 8%
tt¯+W/Ztheory 5% 8% 10%
Table 3: The total systematic uncertainty on the background in each of the three signal regions and a list of the dominant contributions to the uncertainty. The individual uncertainties can be correlated.
For the signal prediction, the systematic uncertainty is approximately 30%, constant across the plane of top squark and LSP masses. The uncertainty is dominated by the uncertainties on the jet energy scale (25%) and
b-tagging (15%) as well as by the theoretical uncertainties on thecross section (14%).
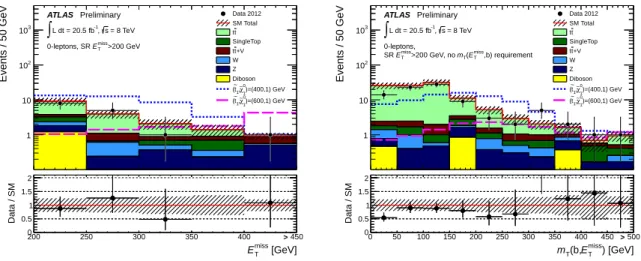
The distributions of
ETmissand
mT(b,ETmiss)are shown in Figure 4; in each of these distri- butions, all signal selection requirements have been applied except for the one on the vari- able being plotted. For the
mT(b,ETmiss)distribution, the
ETmissrequirement is set to that of SR1 (E
Tmiss>200GeV). The SM expectation shown is based on the initial normalization of the back- ground contributions.
200 250 300 350 400 450
Events / 50 GeV
1 10 102
103
>200 GeV
miss
ET
0-leptons, SR
Data 2012 SM Total
t t SingleTop
+V t t W Z Diboson
)=(400,1) GeV 1 χ∼0 1, t~ (
)=(600,1) GeV 1 χ∼0 1, t~ ( = 8 TeV
s
-1, L dt = 20.5 fb
∫
ATLAS Preliminary
[GeV]
miss
ET
200 250 300 350 400 450
Data / SM
0 0.5 1 1.5 2
>
0 50 100 150 200 250 300 350 400 450 500
Events / 50 GeV
1 10 102
103
0-leptons,
,b) requirement
miss
ET
( mT
>200 GeV, no
miss
ET
SR
Data 2012 SM Total
t t SingleTop
+V t t W Z Diboson
)=(400,1) GeV 1 χ∼0 1,
~t (
)=(600,1) GeV 1 χ∼0 1,
~t ( = 8 TeV
s
-1, L dt = 20.5 fb
∫
ATLAS Preliminary
) [GeV]
miss
ET T(b, m
0 50 100 150 200 250 300 350 400 450 500
Data / SM
0 0.5 1 1.5 2
>
Figure 4: Distributions of
ETmiss(left) and
mT(b,ETmiss)(right) after all selection requirements except for the one on the variable being plotted. The rightmost bin includes all overflows.
For the
mT(b,ETmiss)distribution,
ETmiss>200GeV has been applied. The SM expectation shown
here is the input to the SM background fit. The uncertainty band around the SM expectation
combines statistical and systematic uncertainties.
Signal region hεσi95obs
[fb]
Sobs95 S95exp CLBSR1 0.49 10.0
10.6+5.5−1.70.39
SR2 0.17 3.6
5.3+3.2−1.70.20
SR3 0.19 3.9
4.5+1.9−0.70.27
Table 4: Left to right: 95% CL upper limits on the visible cross section (
hεσi95obs) in the various signal regions, and on the number of signal events (S
95obs). The third column (S
exp95) shows the 95% CL upper limit on the number of signal events, given the expected number (and
±1σuncertainty on the expectation) of background events. The last column indicates the
CLBvalue, i.e. the observed confidence level for the background-only hypothesis.
Limits on the visible cross section (i.e. the cross section evaluated inside a given signal re- gion) are obtained by including the number of events observed in that signal region as an input to the fit and deriving an additional parameter, representing the non-SM signal strength (con- strained to be non-negative), as the output of the fit. Limits on the number of non-SM events in the signal region, obtained using the
CLs[92] prescription, are divided by the integrated lumi- nosity to derive the constraints on the visible cross section. The limits at 95% confidence level (CL) are shown in Table 4.
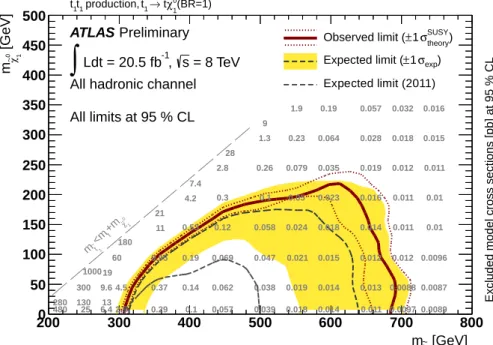
For excluding specific models of new physics, the fit in the signal region proceeds in the same way. Limits are set in a model of direct top squark pair production, followed by top squark decay (with 100% branching ratio) to a top quark and the LSP (
pp→t˜1t˜1∗→tχ˜10tχ˜10). The limits in the plane of the masses of the top squark and LSP are shown in Fig. 5. For each pair of top squark and LSP masses, the signal region with the best expected sensitivity is used to set the limit. Top squarks in this model with masses between 320 and 660 GeV are excluded at 95%
CL
for a nearly massless LSP. For a LSP mass of 150 GeV the exclusion interval is between 400 and 620 GeV. These quoted values are obtained by taking a signal cross section that is lower than the nominal value by 1
σin the theoretical uncertainty. The difference in acceptance for top squarks corresponding to left-handed top quarks, compared to those in the (right-handed) model shown here are modest; the relative difference in acceptance is typically within 10%.
The results can also be used to derive upper limits on the branching ratio for
t˜1→tχ˜10as a function of the masses of the top squark and LSP. The results are shown in Fig. 6. The conservative assumption is made here that this analysis has no sensitivity to other decay modes of the top squark. The nominal values for the signal cross sections are used to derive these branching ratio limits.
9 Conclusions
A search with the ATLAS detector for direct pair production of top squarks in final states con- taining six or more jets and
ETmisshas been presented. Data from the full 2012 data-taking period, corresponding to an integrated luminosity of 20.5 fb
−1, at a
ppcenter of mass energy of
√s=8
TeV, have been analyzed. Observations are consistent with SM expectations and exclu- sion limits have been placed in a model of top squark pair production, followed by the decay
t˜1→tχ˜10. Top squarks in this model with masses between 320 and 660 GeV are excluded at 95%
CL
for a nearly massless LSP. For a LSP mass of 150 GeV the exclusion interval is between 400
2000 300 400 500 600 700 800 50
100 150 200 250 300 350 400 450 500
1 0χ∼
+mt
<m
t1
m~
(BR=1)
0
χ∼1
→ t t1
production, ~ t1
~ t1
~
[GeV]
t1
m~
[GeV]0 1χ∼m
ATLAS Preliminary
= 8 TeV s
-1, Ldt = 20.5 fb
∫
All hadronic channel All limits at 95 % CLtheory) σSUSY
±1 Observed limit (
exp) σ
±1 Expected limit ( Expected limit (2011)
Figure 5: Expected and observed exclusion limits at 95%
CLfor the model of (pp
→t˜1t˜1∗→ tχ˜10tχ˜10) with 100% branching ratio of
t˜1→tχ˜10. The top quark produced in the decay has a right- handed polarization in 95% of the decays. The band around the median expected limit shows the
±1σvariations on the median expected limit, including all uncertainties except theoretical uncertainties on the signal. The dotted lines around the observed limit indicate the sensitivity to
±1σvariations on these theoretical uncertainties. The expected limit from the previous ATLAS search [29] with the same final state is also shown.
[GeV]
t1
m~
200 300 400 500 600 700 800
[GeV]0 1χ∼m
0 50 100 150 200 250 300 350 400 450 500
BR = 100 % BR = 75 % BR = 60 %
0.6 0.54 0.58 0.67 0.63 0.75 0.9 0.68 0.62 0.61 0.67 0.65 0.76 0.95
0.74 0.64 0.74 0.68 0.79 0.94 0.84 0.82 0.73 0.85
0.95
1 0χ∼
+mt
<m
t1
m~
0
χ∼1
→ t t1
production, ~ t1
~ t1
~
=8 TeV s
-1, Ldt = 20.5 fb
∫
Observed Excluded Branching Ratio at 95% CL ATLAS Preliminary
All hadronic channel
Figure 6: Excluded (at 95%
CL) branching fractions for t˜1 →tχ˜10in the model where
pp→ t˜1t˜1∗. The conservative assumption is made here that this analysis is sensitive only to the decay
channel
t˜1→tχ˜10and has no sensitivity to other decay modes.
and 620 GeV. The result significantly extends previous limits in the all-hadronic final state and excludes top squarks up to higher masses than in previous searches.
References
[1] L. Evans and P. Bryant, LHC Machine, JINST
3(2008) S08001.
[2] ATLAS Collaboration, Observation of a new particle in the search for the Standard Model Higgs boson with the ATLAS detector at the LHC, Phys.Lett.
B716(2012) 1–29, arXiv:1207.7214 [hep-ex].
[3] CMS Collaboration, Observation of a new boson at a mass of 125 GeV with the CMS experiment at the LHC, Phys.Lett.
B716(2012) 30–61, arXiv:1207.7235 [hep-ex].
[4] S. Weinberg, Implications of Dynamical Symmetry Breaking, Phys. Rev.
D13(1976) 974–996.
[5] E. Gildener, Gauge Symmetry Hierarchies, Phys. Rev.
D14(1976) 1667.
[6] S. Weinberg, Implications of Dynamical Symmetry Breaking: An Addendum, Phys. Rev.
D19(1979) 1277–1280.
[7] L. Susskind, Dynamics of Spontaneous Symmetry Breaking in the Weinberg- Salam Theory, Phys. Rev.
D20(1979) 2619–2625.
[8] H. Miyazawa, Baryon Number Changing Currents, Prog. Theor. Phys.
36 (6)(1966) 1266–1276.
[9] P. Ramond, Dual Theory for Free Fermions, Phys. Rev.
D3(1971) 2415–2418.
[10] Y. Golfand and E. Likhtman, Extension of the Algebra of Poincare Group Generators and Violation of p Invariance, JETP Lett.
13(1971) 323–326.
[11] A. Neveu and J. H. Schwarz, Factorizable dual model of pions, Nucl. Phys.
B31(1971) 86–112.
[12] A. Neveu and J. H. Schwarz, Quark Model of Dual Pions, Phys. Rev.
D4(1971) 1109–1111.
[13] J. Gervais and B. Sakita, Field theory interpretation of supergauges in dual models, Nucl. Phys.
B34