JHEP10(2017)141
Published for SISSA by Springer
Received: July 12, 2017 Accepted: October 8, 2017 Published: October 20, 2017
Search for pair production of heavy vector-like quarks decaying to high-p
TW bosons and b quarks in the lepton-plus-jets final state in pp collisions at √
s = 13 TeV with the ATLAS detector
The ATLAS collaboration
E-mail: atlas.publications@cern.ch
Abstract: A search is presented for the pair production of heavy vector-like T quarks, primarily targeting the T quark decays to aW boson and a b-quark. The search is based on 36.1 fb−1 of pp collisions at √
s = 13 TeV recorded in 2015 and 2016 with the ATLAS detector at the CERN Large Hadron Collider. Data are analysed in the lepton-plus-jets final state, including at least oneb-tagged jet and a large-radius jet identified as originating from the hadronic decay of a high-momentum W boson. No significant deviation from the Standard Model expectation is observed in the reconstructed T mass distribution. The observed 95% confidence level lower limit on the T mass are 1350 GeV assuming 100%
branching ratio to W b. In the SU(2) singlet scenario, the lower mass limit is 1170 GeV.
This search is also sensitive to a heavy vector-likeB quark decaying toW tand other final states. The results are thus reinterpreted to provide a 95% confidence level lower limit on theB quark mass at 1250 GeV assuming 100% branching ratio toW t; in the SU(2) singlet scenario, the limit is 1080 GeV. Mass limits on both T and B production are also set as a function of the decay branching ratios. The 100% branching ratio limits are found to be applicable to heavy vector-likeY andXproduction that decay toW bandW t, respectively.
Keywords: Exotics, Hadron-Hadron scattering (experiments)
ArXiv ePrint: 1707.03347
JHEP10(2017)141
Contents
1 Introduction 1
2 ATLAS detector 3
3 Data and simulation 3
4 Analysis object selection 5
5 Analysis strategy 6
5.1 Event preselection 7
5.2 TT¯ reconstruction 7
5.3 Classification of event topologies 8
5.3.1 Signal region definition 8
5.3.2 Control region definition 9
5.4 Multi-jet background estimation 9
6 Systematic uncertainties 10
6.1 Luminosity and normalisation uncertainties 11
6.2 Detector-related uncertainties 11
6.3 Generator modelling uncertainties 12
7 Results 12
7.1 Statistical interpretation 12
7.2 Likelihood fit results 13
7.3 Limits on VLQ pair production 15
8 Conclusions 15
The ATLAS collaboration 24
1 Introduction
The discovery of the Higgs boson by the ATLAS and CMS collaborations is a major milestone in high-energy physics [1, 2]. However, the underlying nature of electroweak symmetry breaking remains unknown. Naturalness arguments [3] require that quadratic divergences arising from radiative corrections to the Higgs boson mass are cancelled by a new mechanism to avoid fine-tuning. This paper presents a search for pair production of vector-like quarks (VLQs) decaying into third-generation quarks using theppcollision data collected at the Large Hadron Collider (LHC) in 2015 and 2016 at a centre-of-mass energy of 13 TeV.
JHEP10(2017)141
Several new mechanisms have been proposed in theories beyond the Standard Model (BSM). In supersymmetry, the cancellation comes from assigning superpartners to the Standard Model (SM) bosons and fermions. Alternatively, Little Higgs [4,5] and Composite Higgs [6, 7] models introduce a spontaneously broken global symmetry, with the Higgs boson emerging as a pseudo Nambu–Goldstone boson [8]. These latter models predict the existence of VLQs, defined as colour-triplet spin-1/2 fermions whose left- and right-handed chiral components have the same transformation properties under the weak-isospin SU(2) gauge group [9, 10]. Depending on the model, vector-like quarks are produced in SU(2) singlets, doublets or triplets of flavoursT,B,X orY, in which the first two have the same charge as the SM top and b quarks while the vector-like Y and X quarks have charge1
−4/3 and 5/3. In addition, in these models, VLQs are expected to couple preferentially to third-generation quarks [9, 11] and can have flavour-changing neutral-current decays in addition to the charged-current decays characteristic of chiral quarks. As a result, an up-typeT quark can decay not only to a W boson and a bquark, but also to aZ or Higgs boson and a top quark (T →W b,Zt, andHt). Similarly, a down-type B quark can decay to a Z or Higgs boson and a b quark, in addition to decaying to a W boson and a top quark (B → W t, Zb, and Hb). Instead, due to their charge, vector-like Y quarks decay exclusively to W b while vector-like X quarks decay exclusively to W t. To be consistent with the results from precision electroweak measurements a small mass-splitting between VLQs belonging to the same SU(2) multiplet is required, but no requirement is placed on which member of the doublet is heavier [12]. Cascade decays such as T → W B → W W t are thus assumed to be kinematically forbidden. Decays of VLQs into final states with first and second generation quarks, although not favoured, are not excluded [13,14].
This search targets the T →W bdecay mode, although it is sensitive to a wide range of branching ratios to the other two decay modes as well as to vector-like B, X and Y production. Previous searches in this decay mode by the ATLAS and CMS collaborations did not observe a significant deviation from the SM predictions. Those searches excluded VLQ masses below 740 GeV for any combination of branching ratios and below 920 GeV for the assumption of B(T → W b) = 1 [15,16]. A recent search by the ATLAS collaboration at√
s= 13 TeV sets a lower limit of 1160 GeV on the vector-like T quark mass for the pure Zt mode [17].
The event selection is optimised forTT¯production with subsequent decay to two high- pT W bosons and two b-quarks, where one of the W bosons decays leptonically and the other decays hadronically. To suppress the SM background, boosted jet reconstruction techniques [18, 19] are used to improve the identification of high-pT W bosons decaying hadronically while rejecting events with hadronically decaying, high-pT top-quarks.
The TT¯ system is reconstructed and the mass of the semi-leptonically decaying VLQ candidate is used to discriminate between SM and VLQ events. Finally, a profile likelihood fit is used to test for the presence of a VLQ signal as a function ofT andB quark masses and decay branching ratios. The results are found to be equally applicable to either singlet or doublet weak-isospin configurations as well as applicable to the decays of X and Y.
1All charges are quoted in units ofe.
JHEP10(2017)141
2 ATLAS detector
The ATLAS detector [20] at the LHC is a multipurpose particle detector with a forward- backward symmetric cylindrical geometry that covers nearly the entire solid angle around the collision point. It consists of an inner detector surrounded by a thin superconducting solenoid providing a 2 T axial magnetic field, electromagnetic and hadronic calorimeters, and a muon spectrometer. The inner detector covers the pseudorapidity range2 |η|<2.5.
It consists of a silicon pixel detector, including the insertable B-layer installed after Run 1 of the LHC [21,22], and a silicon microstrip detector surrounding the pixel detector, fol- lowed by a transition radiation straw-tube tracker. Lead/liquid-argon sampling calorime- ters provide electromagnetic energy measurements with high granularity and a hadronic (steel/scintillator-tile) calorimeter covers the central pseudorapidity range (|η|<1.7). The end-cap and forward regions are instrumented with liquid-argon calorimeters for both the electromagnetic and hadronic energy measurements up to |η| = 4.9. The outer part of the detector consists of a muon spectrometer with high-precision tracking chambers for coverage up to |η| = 2.7, fast detectors for triggering over |η| ¡ 2.4, and three large su- perconducting toroid magnets with eight coils each. The ATLAS detector has a two-level trigger system to select events for offline analysis [23].
3 Data and simulation
This search utilises a data set corresponding to 36.1±1.2 fb−1of integrated luminosity from pp collisions at √
s= 13 TeV collected by the ATLAS experiment, with 3.2 fb−1 collected in 2015 and 32.9 fb−1 collected in 2016 [24]. Data are only used if all ATLAS detector subsystems were operational. In all simulated events used in this search, the top quark and Higgs boson masses were set to 172.5 GeV and 125 GeV, respectively.
Simulated TT¯ events were generated with the leading-order (LO) generator Protos v2.2 [25] using the NNPDF2.3 LO parton distribution function (PDF) set and a set of tuned parameters called the A14 tune [26] for the underlying-event description and passed to Pythia 8.186 [27] for parton showering and fragmentation. The samples were gen- erated for an SU(2) singlet T VLQ, but with equal branching ratios of the T quark to each final state. To check the dependence of the results on the weak-isospin of the VLQ, one sample was also generated using the SU(2) doublet model including only the T con- tributions. The signal samples are normalised to pair-production cross-sections computed using Top++ v2.0 [28], including next-to-next-to-leading-order (NNLO) quantum chro- modynamics (QCD) corrections and soft-gluon resummation to NNLL accuracy [29–34], and using the MSTW 2008 NNLO PDF set. Their cross-sections vary from 3.38±0.25 pb (mT = 500 GeV) to 3.50±0.43 fb (mT = 1400 GeV). Theoretical uncertainties are eval- uated from variations of the factorisation and renormalisation scales, as well as from un-
2The ATLAS Collaboration uses a right-handed coordinate system with its origin at the nominal in- teraction point (IP) in the centre of the detector and thez-axis along the beam pipe. The x-axis points from the IP to the centre of the LHC ring, and they-axis points upwards. Cylindrical coordinates (r, φ) are used in the transverse plane,φbeing the azimuthal angle around the beam pipe. The pseudorapidity is defined in terms of the polar angle θ as η = −ln tan(θ/2). Angular distance is measured in units of
∆R≡p
(∆η)2+ (∆φ)2.
JHEP10(2017)141
certainties in the PDFs and αS. The latter two represent the largest contribution to the overall theoretical uncertainty in the signal cross-sections and are calculated using the PDF4LHC [35] prescription with the MSTW 2008 68% CL NNLO, CT10 NNLO [36, 37]
and NNPDF2.3 [38] 5f FFN PDF sets. Two benchmark signal scenarios are considered, along with a full scan of the branching-ratio plane. The first benchmark corresponds to a T quark that decays 100% to W b and the second corresponds to the SU(2) singlet T quark scenario, which predicts branching ratios of∼50%,∼25%,∼25% toW b,Ztand Ht, respectively [12]. Samples were also generated for BB¯ production for the reinterpretation of this search. They were produced using the same generator and normalised in the same way asTT¯. As withTT, two benchmark signal scenarios are considered, along with a full¯ scan of the branching-ratio plane. The first benchmark assumesB(B→W t) = 1 — which also corresponds to the SU(2) (B,T) doublet hypothesis — and the second corresponds to the SU(2) singlet B quark scenario, which predicts branching ratios of ∼50%, ∼25%,
∼25% toW t,Zb andHb, respectively [12].
The main SM backgrounds that are studied using simulated samples are due to tt,¯ W + jets, Z + jets, diboson, single top quark, and t¯t+V (V = W,Z) production. The multi-jet background is estimated using a data-driven technique discussed in section 5.4.
The nominaltt¯MC sample was generated withPowheg-Box v2interfaced withPythia 6.428 [39,40] for the parton shower and hadronisation, using the Perugia2012tune [41]
and the CT10 PDF set, and setting the hdamp parameter to the mass of the top quark.
To estimate t¯t modelling uncertainties, described in section 6.3, additional samples were generated using Powheg-Box v2interfaced with Herwig++ 2.7.1 [42], Powheg-Box v2 interfaced withPythia 8.186, and MG5 aMC@NLO 2.1.1 interfaced withPythia 8.186 [43]. Further, samples with Powheg-Box v2 interfaced with Pythia 6.428 were generated varying the factorisation and normalisation scales by 2 and 0.5, as well as the next-to-leading-order (NLO) radiation factor, hdamp, betweenmtop and twicemtop. Thet¯t samples are normalised to the NNLO cross-section, including NNLO QCD corrections and soft-gluon resummation to NNLL accuracy, as done for the signal samples.
Single top quark production (called ‘single top’ in the following) in the W t- and s- channels was also generated with Powheg-Box v2interfaced with Pythia 6.428, while single top production in the t-channel was generated with Powheg-Box v1 interfaced with Pythia 6.428 for the parton shower and hadronisation. Single-top samples were generated using the Perugia2012 tune and the CT10 PDF set. The single top cross- sections for the t- and s-channels are normalised to their next-to-leading-order (NLO) predictions, while for the W t-channel the cross-section is normalised to its NLO+NNLL prediction [44]. ForW+ jets,Z+ jets, and diboson (W W,W Z,ZZ) samples, theSherpa 2.2.1generator [45] was used with the CT10 PDF set. TheW+jets andZ+jets production samples are normalised to the NNLO cross-sections [46–48]. For diboson production, the generator cross-sections (already at NLO) are used for sample normalisation. The t¯t+V background is modelled using samples produced with MG5 aMC@NLO 2.1.1interfaced with Pythia 8.186, using the A14 tune and the NNPDF2.3 LO PDF set. The t¯t+V samples are normalised to their respective NLO cross-sections [43].
All simulated samples were produced using the ATLAS simulation infrastructure [49], using the fullGEANT4[50] simulation of the ATLAS detector and reconstructed with the
JHEP10(2017)141
same software as used for the data. Multiple overlaid proton-proton collisions in the same or nearby bunch crossings (pile-up) were simulated at rates matching that of the data; they were modelled as lowpTmulti-jet production using thePythia 8.186generator and tune A2 [51].
4 Analysis object selection
Reconstructed objects are defined by combining information from different detector sub- systems. This section outlines the criteria used to identify and select the reconstructed objects used in the analysis. Events are required to have at least one vertex candidate with at least two tracks with pT >500 MeV. The primary vertex is taken to be the vertex candidate with the largest sum of squared transverse momenta of all associated tracks.
To reconstruct jets, three-dimensional energy clusters in the calorimeter, assumed to represent massless particles coming from the primary vertex, are grouped together using the anti-kt clustering algorithm [52–54] with a radius parameter of 0.4 (1.0) for small-R (large-R) jets. Small-R jets and large-R jets are clustered independently.
Small-Rjets are calibrated using an energy- andη-dependent calibration scheme, with in situ corrections based on data [55], and are selected if they have pT > 25 GeV and
|η|<2.5. A multivariate jet vertex tagger (JVT) selectively removes small-R jets that are identified as having originated from pile-up collisions rather than the hard scatter [56]. Jets containing b-hadrons are identified via an algorithm that uses multivariate techniques to combine information from the impact parameters of displaced tracks as well as topological properties of secondary and tertiary decay vertices reconstructed within the jet. A jet is considered b-tagged if the value for the multivariate discriminant is above the threshold corresponding to an efficiency of 77% for tagging ab-quark-initiated jet. The corresponding light-jet rejection factor is ∼130 and the charm-jet rejection factor is ∼6, as determined for jets with pT >20 GeV and|η|<2.5 in simulated t¯tevents.
Large-R jets are built using the energy clusters in the calorimeter [57, 58] and then trimmed [59] to mitigate the effects of contamination from multiple interactions and im- prove background rejection. The jet energy and pseudorapidity are further calibrated to account for residual detector effects using energy and pseudorapidity dependent calibra- tion factors derived from simulation. The kt-based trimming algorithm reclusters the jet constituents into subjets with a finer-grained resolution (the R-parameter for subjets is set to Rsub = 0.2). Subjets that contribute less than 5% to the pT of the large-R jets are discarded. The properties (e.g. transverse momentum and invariant mass) of the jet are recalculated using only the constituents of the remaining subjets. Trimmed large-R jets are only considered if they have pT >200 GeV and|η|<2.0. To identify large-R jets that are likely to have originated from the hadronic decay of W bosons (Whad) and not from the hadronic decay of top quarks or multi-jet background, jet substructure information is exploited using the ratio of the energy correlation functionsDβ=12 [60,61] and jet mass [58].
Selected large-R jets must pass both the substructure and mass requirements of the 50%- efficientW-tagging working point [18]. To reduce the contribution from thet¯tbackground, theWhad candidate must not overlap any b-tagged small-R jets within ∆R <1.0. If mul-
JHEP10(2017)141
tiple large-R jets satisfy the above requirements, the one with a mass closest to the mass of the W boson is selected as the Whad candidate.
Electrons are reconstructed from energy deposits in the electromagnetic calorimeter matched to inner detector tracks. Electron candidates are required to satisfy likelihood- based identification criteria [62] and must have plepT > 30 GeV and |η| < 2.47. Electron candidates in the transition region between the barrel and endcap electromagnetic calorime- ters, 1.37<|η|<1.52, are excluded from this analysis. A lepton isolation requirement is implemented by calculating the quantity IR =P
∆R(track,lep)<RcutptrackT , where Rcut is the smaller of 10 GeV/plepT and 0.2; the track associated with the lepton is excluded from the calculation. The electron must satisfyIR<0.06·plepT . Additionally, electrons are required to have a track satisfying σ|d0|
d0
<5 and|z0sinθ|<0.5 mm, whered0 is the transverse impact parameter and z0 is the r–φ projection of the impact point onto the z-axis. An overlap- removal procedure prevents double-counting of energy between an electron and nearby jets by removing jets if the separation between the electron and jet is within ∆R < 0.2 and removing electrons if the separation is within 0.2 <∆R <0.4. In addition, a large-R jet is removed if the separation between the electron and the large-R jet is within ∆R <1.0.
Muons are reconstructed from an inner detector track matched to muon spectrometer tracks or track segments [63]. Candidate muons are required to pass quality specifications based on information from the muon spectrometer and inner detector. Furthermore, muons are required to be isolated from detector activity using the same criterion that is applied to electrons and their associated tracks must satisfy |z0sinθ|<0.5 mm and |dσ0|
d0 <3. Muons are selected if they have pT >30 GeV and |η|<2.5. An overlap-removal procedure is also applied to muons and jets. If a muon and a jet with at least three tracks are separated by
∆R < min(0.4,0.04 + 10 GeV/pTµ) the muon is removed; if the jet has fewer than three tracks, the jet is removed.
For a given reconstructed event, the magnitude of the negative vector sum of the pT of all reconstructed leptons and small-R jets is defined as the missing transverse momentum (ETmiss) [64]. An extra term is included to account for ‘soft’ energy from inner detector tracks that are not matched to any of the selected objects but are consistent with originating from the primary vertex.
The four-momentum of the neutrino can be analytically determined in each event using the missing transverse momentum vector E~Tmiss and assuming the lepton-neutrino system has an invariant mass equal to that of the W boson. Nearly half of the events are found to produce two complex solutions. When complex solutions are obtained, a real solution is determined by minimising aχ2 parameter based on the difference between the mass of the lepton-neutrino system and the measured value of the W boson mass. In the case of two real solutions, the solution with the smaller absolute value of the longitudinal momentum is used.
5 Analysis strategy
This search targets the decay of pair-produced VLQs,TT¯, where oneT quark decays toW b and the other decays toW b,ZtorHt. Since previous searches from ATLAS and CMS have
JHEP10(2017)141
excluded VLQs decaying to W b at 95% confidence level (CL) for masses below 920 GeV, this search focuses on the decays of higher-mass VLQs. The final state consists of a high-pT
charged lepton and missing transverse momentum from the decay of one of the W bosons, a high-momentum large-R jet from the hadronically decaying W boson, and multiple b- tagged jets. The event preselection is described in section5.1and the reconstruction of the TT¯ system is discussed in section5.2. The classification of events into signal and control regions follows in section 5.3.
The search for the BB¯ signal uses the same selection criteria, with no further optimization.
5.1 Event preselection
Events are required to pass a single-electron or single-muon trigger. The 2015 data were collected using electron triggers with ET thresholds of 24, 60, and 120 GeV. The 2016 data were collected using electron triggers with ET thresholds of 26, 60, and 140 GeV.
For the 2015 electron triggers, the highest-ET trigger had a looser quality requirement on the trigger object than the triggers with lower ET thresholds. For the 2016 electron triggers, the trigger with the lowestETthreshold had stringent requirements on the quality of the trigger object, as well as requirements on its isolation from other activity in the detector. The highest and second highest ET triggers had no requirement on isolation and had progressively looser quality requirements. Muon triggers with pT thresholds of 20 (26) GeV and requirements on isolation were used in 2015 (2016). Additionally, a high-pT muon trigger with a threshold of 50 GeV and no isolation requirement was used in both 2015 and 2016 data.
In addition to the trigger requirement, events must have at least one primary vertex with at least two associated tracks. Exactly one lepton candidate (electron or muon), as described in section4, is required. Signal events are expected to have a high jet multiplicity, since they include two b-jets as well as one jet from the hadronic decay of the W boson.
Therefore, at least three small-Rjets are required, of which at least one must be b-tagged.
At least one boosted hadronic W candidate is required and the ETmiss is required to be greater than 60 GeV.
After this selection, backgrounds with large contributions include t¯t, W + jets, and single-top events. Other SM processes, including diboson, Z + jets, t¯tV and multi-jet production, make a smaller but non-negligible contribution; these small backgrounds are collectively referred to as ‘Others’.
5.2 TT¯ reconstruction
After preselection, the four-momenta of the hadronic and semi-leptonic VLQ candidates are reconstructed using the selected lepton candidates, large-R jets, small-R jets, and missing transverse momentum of the event. VLQ candidates (T → W b) are formed by pairing each W boson candidate with a b-quark candidate. If there are two or more b-tagged jets in the event, the two highest-pT b-tagged jets are selected as theb-quark candidates. Both possible pairings of the b-quark candidates with the Whad and semi-leptonically decaying W boson (Wlep) candidates are tested and the pairing that minimises the absolute value
JHEP10(2017)141
[GeV]
lep
mT
0 200 400 600 800 1000 1200 1400 1600
Event fraction
0 0.1 0.2 0.3 0.4
t t
= 500 GeV mT
= 700 GeV mT
= 900 GeV mT
= 1100 GeV mT
= 1300 GeV mT
ATLAS Simulation
= 13 TeV s
ℬ(T→Wb) = 1
Signal Region
[GeV]
lep
mT
0 200 400 600 800 1000 1200 1400 1600
Event fraction
0 0.05 0.1 0.15 0.2 0.25
t t
= 700 GeV mB
= 900 GeV mB
= 1100 GeV mB
= 1300 GeV mB
ATLAS Simulation
= 13 TeV s
ℬ(B→W t) = 1
Signal Region
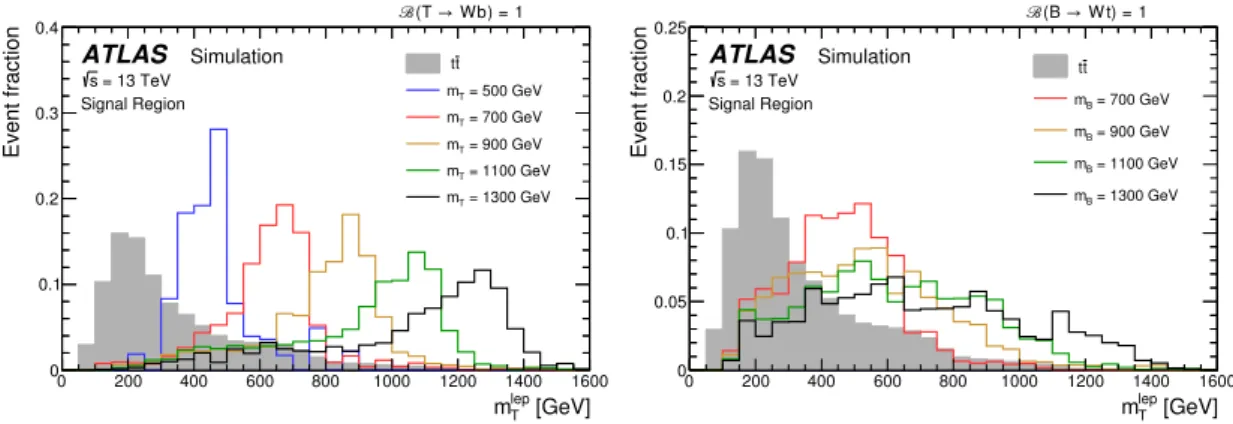
Figure 1. The reconstructed leptonic T quark mass in the signal region is shown for the t¯t background and a few signal mass points, for the signal modelsB(T →W b) = 1 (left) and for the signal models B(B → W t) = 1 (right). In both figures, the distributions are normalised to unity for comparison of the relative shapes at each mass point. Due to the limited Monte Carlo sample size, thet¯tdistribution has been smoothed.
of the mass difference between the semi-leptonically and hadronically reconstructed VLQ candidates, |∆m|, is chosen. If the event has only oneb-tagged jet, that jet is used as one of the b-quark candidates and then all permutations with the remaining small-R jets are tested to find the configuration that minimises|∆m|.
The final discriminating variable used in the statistical analysis is mlepT , the recon- structed mass of the semi-leptonically decaying vector-like T quark candidate. This is found to provide the best expected signal sensitivity. Figure1showsmlepT for benchmarkT andB quark signal models andtt¯production in the signal region (defined in section 5.3.1) after the reconstruction algorithm is applied. The reconstructed masses for the signal and t¯t background are shown to peak at the generated T and top-quark masses, respectively.
The tails arise from misreconstructed T candidates. As expected, the reconstruction algo- rithm does not reconstruct the B mass, yet the variable nonetheless provides separation power between the signal and the t¯tbackground.
5.3 Classification of event topologies
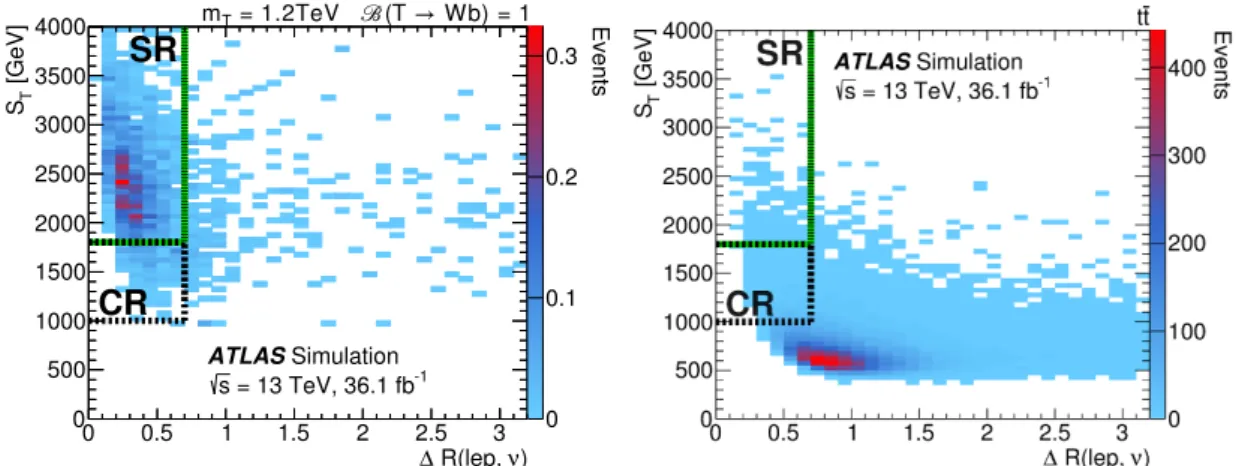
Att¯control region is used to constrain the production rate oftt¯events as well as systematic uncertainties related tott¯modelling. The signal and control regions are described in detail in section 5.3.1and section5.3.2. The scalar sum ofETmiss and the transverse momenta of the lepton and all small-R jets, ST, and the separation between the lepton and neutrino,
∆R(lep, ν), are used to define the two regions. These regions are shown in figure 2 after applying the event pre-selection, and described below.
5.3.1 Signal region definition
After the event pre-selection described in section 5.1, further requirements are applied to reduce the contribution of SM backgrounds relative to signal. Events in the signal region are selected based on their characteristic boosted topology with a high-pT W boson and larger separation between the W boson and the b quarks. Events are required to have
JHEP10(2017)141
) R(lep, ν
∆
0 0.5 1 1.5 2 2.5 3
[GeV]T S
0 500 1000 1500 2000 2500 3000 3500
4000 Events
0 0.1 0.2
SR 0.3
CR
ATLASSimulation = 13 TeV, 36.1 fb-1
s
mT= 1.2TeV ℬ(T→Wb) = 1
Figure 2. The signal region (SR) and control region (CR) are shown in a two-dimensional plane ofST and ∆R(lep, ν), overlaying the expected signal distribution forB(T →W b) = 1 and a mass of 1.2 TeV (left) and overlaying the distribution of the dominantt¯tbackground (right).
∆R(lep, ν)<0.7, arising from a boosted leptonically decayingW boson. In addition,ST is required to be greater than 1800 GeV. This requirement is found to maximise the expected sensitivity to VLQ masses above 1 TeV. In order to reject both thet¯tand single-top (mostly W t-channel) backgrounds, an additional requirement is put on the difference between the reconstructed masses of the leptonic and hadronic VLQ candidates,|∆m|=|mhadT −mlepT |<
300 GeV; this selection criterion is optimised to provide the best expected sensitivity.
The expected numbers of events in the signal region for the background processes and signal hypothesis with mass mT = 1 TeV are shown in table 1. For a signal model with B(T → W b) = 1, the acceptance times efficiency of the full event selection ranges from 0.2% to 4.0% for VLQ masses from mT = 500 to 1400 GeV. For the SU(2) singlet T scenario, for which B(T → W b) is approximately 50% for the mass range of interest, the signal acceptance ranges from 0.1% to 2.0%.
5.3.2 Control region definition
In this analysis, SM tt¯production is the dominant background process. To constrain the rate of t¯t production in the signal region, as well as to constrain some uncertainties related to t¯tmodelling, a control region is included in the statistical analysis. This region is defined by only changing the requirement on ST to 1000 GeV< ST <1800 GeV. This window is chosen to be as close as possible to the signal region, while still retaining a large number of background events. Both the lower requirement on the control region and the requirement separating the signal and control regions were optimised to maximise the expected sensitivity to the signal with a mass of 1000 GeV and B(T →W b) = 1.
5.4 Multi-jet background estimation
The multi-jet background originates from either the misidentification of a jet as a lep- ton candidate (fake lepton) or from the presence of a non-prompt lepton (e.g., from a semileptonic b- or c-hadron decay) that passes the isolation requirement. The multi-jet shape, normalisation, and related systematic uncertainties are estimated from data using
JHEP10(2017)141
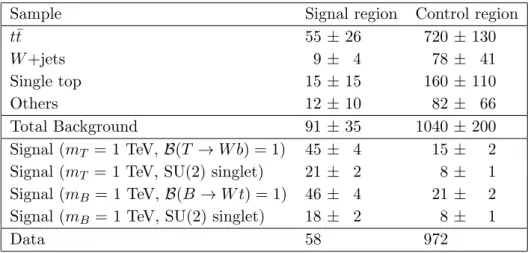
Sample Signal region Control region
tt¯ 55 ±26 720± 130
W+jets 9± 4 78± 41
Single top 15 ±15 160± 110
Others 12 ±10 82± 66
Total Background 91 ±35 1040± 200
Signal (mT = 1 TeV,B(T →W b) = 1) 45 ± 4 15± 2 Signal (mT = 1 TeV, SU(2) singlet) 21 ± 2 8± 1 Signal (mB = 1 TeV,B(B→W t) = 1) 46 ± 4 21± 2 Signal (mB = 1 TeV, SU(2) singlet) 18 ± 2 8± 1
Data 58 972
Table 1. Event yields for background sources and several signal models in the signal and control regions. The yields are given before the profile likelihood fit described in section 7. The quoted uncertainties include statistical and systematic uncertainties; for thet¯tbackground no cross-section uncertainty is included. The contributions from dibosons,Z+jets,ttV and multi-jet production are included in the Others category.
the matrix method (MM) [65]. The MM exploits the difference in efficiency for prompt leptons to pass loose and tight quality requirements, obtained from W and Z boson de- cays, and non-prompt or fake lepton candidates, from the misidentification of photons or jets. The efficiencies, measured in dedicated control regions, are parameterised as functions of the lepton candidate pT and η, ∆φ between the lepton and jets, and the b-tagged jet multiplicity.
The event selection used in this analysis significantly reduces the contribution of the multi-jet background in the signal and control regions, to the point where statistical un- certainties make the MM prediction unreliable. In order to obtain a reliable prediction, the requirements on ST and ∆R(lep, ν) are released to 1200 GeV and 1.5, respectively. In this region the MM prediction and the small Monte Carlo derived backgrounds (diboson, Z+jets and ttV) are studied and their shapes are found to be compatible. This selection is thus used to determine the ratio of the multi-jet production to the small Monte Carlo derived backgrounds. The ratio is then assumed to be the same in the signal and control regions and is used to scale those small MC derived backgrounds in order to account for the additional contribution from multi-jet backgrounds. This scaling was found to be sta- ble under small changes to the definition of the looser selection. In the signal region, the contribution from the multi-jet background to the total background is around 6%.
6 Systematic uncertainties
The systematic uncertainties are broken down into four broad categories: luminosity and cross-section uncertainties, detector-related experimental uncertainties, uncertainties in data-driven background estimations, and modelling uncertainties in simulated background processes. Each source of uncertainty is treated as a nuisance parameter in the fit of the leptonicT mass distribution, and shape effects are taken into account where relevant. Due
JHEP10(2017)141
to the tight selection criteria applied, the analysis is limited by the statistical uncertainty;
the systematic uncertainties only mildly degrade the sensitivity of the search.
6.1 Luminosity and normalisation uncertainties
The uncertainty in the combined 2015+2016 integrated luminosity is 3.2%. It is derived, following a methodology similar to that detailed in ref. [24], from a preliminary calibration of the luminosity scale using x–y beam-separation scans performed in August 2015 and May 2016. This systematic uncertainty is applied to all backgrounds and signal that are estimated using simulated Monte Carlo events, which are normalised to the measured integrated luminosity.
Theoretical cross-section uncertainties are applied to the relevant simulated sam- ples. The uncertainties for W/Z+jets and diboson production are 5% and 6%, respec- tively [47,66]. For the largest of these backgrounds, W+jets, a total uncertainty of 50%
in the normalisation is included. The pre-fit impact3 on the measured signal strength of the W+jets normalisation is less than 1%. Two additional shape uncertainties are also considered, related to the heavy-flavour content in the W+jets background. These uncer- tainties are derived by varying each heavy-flavour component of the W+jets background individually by a factor of 1.5, while keeping the overall normalisation fixed. For single top production, the uncertainties are taken as 6% [67,68]. The normalisation of t¯tis un- constrained in the fit. For the data-driven multi-jet estimation, an uncertainty of 100% is assigned to the normalisation, corresponding to the maximum range obtained by varying the values of the cuts on ST and ∆R(lep, ν) when obtaining the multi-jet contribution to the ‘Others’ background.
6.2 Detector-related uncertainties
The dominant sources of detector-related uncertainties in the signal and background yields relate to the small-Rand large-Rjet energy scales and resolutions. The small-Rand large- R jet energy scales and their uncertainties are derived by combining information from test-beam data, LHC collision data and simulation [69]. In addition to energy scale and resolution uncertainties, there are also uncertainties in the large-R mass and substructure scales and resolutions. These are evaluated similarly to the jet energy scale and resolution uncertainties and are propagated to the W-tagging efficiencies. At ∼2%, the uncertainty in the jet energy resolution has the largest pre-fit impact on the measured signal strength, corresponding to a normalisation difference in the signal, t¯t, and single top yields of 2%, 2%, and 14%, respectively.
Other detector-related uncertainties come from lepton trigger efficiencies, identification efficiencies, energy scales and resolutions, theETmissreconstruction, theb-tagging efficiency, and the JVT requirement. Uncertainties related to the efficiency for tagging c-jets have
3The pre-fit effect on the signal strength parameterµis calculated by fixing the corresponding uncertainty at θ±σθ, whereθ is the initial value of the systematic uncertainty and σθ is its pre-fit uncertainty, and performing the fit again. The difference between the default and the modified value of µ, ∆µ, represents the effect onµof this particular uncertainty (see section7.1for further details).
JHEP10(2017)141
the largest pre-fit impact on the measured signal strength (∼1%). This originates from a change in normalisation of ∼3% on both the signal and background yields.
6.3 Generator modelling uncertainties
Modelling uncertainties are estimated for the dominant t¯t and single-top backgrounds.
The modelling uncertainties are estimated by comparing simulated samples with different configurations, described in section 3. The effects of extra initial and final state gluon radiation are estimated by comparing simulated samples generated with enhanced or re- duced initial state radiation, changes to thehdampparameter, and different radiation tunes.
This uncertainty has a 12% normalisation impact on t¯t in the signal region, resulting in a pre-fit impact of ∼1% on the measured signal strength. The uncertainty in the frag- mentation, hadronisation and underlying-event modelling is estimated by comparing two different parton shower models, Pythia and Herwig++, while keeping the same hard- scatter matrix-element generator. This causes an 18% shift in the normalisation oft¯tin the signal region, resulting in a pre-fit impact of ∼3% on the measured signal strength. The uncertainty in the hard-scatter generation is estimated by comparing events generated with two different Monte Carlo generators,MG5 aMC@NLOand Powheg, while keeping the same parton shower model. This uncertainty has a 38% normalisation impact on t¯tin the signal region, resulting in a pre-fit impact of only ∼4% on the measured signal strength.
Modelling uncertainties in single top production are also included. In this analysis, W t-channel production is the dominant contribution and the largest uncertainty comes from the method used to remove the overlap between NLO W t production and LO t¯t production. The default method used is diagram removal, while the alternative method considered is diagram subtraction [70]. The full difference between the two methods is assigned as an uncertainty. This uncertainty has a 90% normalisation impact on single top in the signal region resulting in a pre-fit impact of∼5% on the measured signal strength.
7 Results
7.1 Statistical interpretation
The distribution of the reconstructed mass of the leptonically decayingT quark candidate, mlepT , in the signal and control regions is used to test for the presence of a signal. Hypothesis testing is performed using a modified frequentist method as implemented inRooStats[71, 72] and based on a profile likelihood which takes into account the systematic uncertainties as nuisance parameters that are fitted to the data.
The statistical analysis is based on a binned likelihood function L(µ, θ) constructed as a product of Poisson probability terms over all bins considered in the search. This function depends on the signal strength parameter µ, a multiplicative factor to the theoretical sig- nal production cross-section, and θ, a set of nuisance parameters that encode the effect of systematic uncertainties in the signal and background expectations and are implemented in the likelihood function as Gaussian constraints. Uncertainties in each bin of the mlepT distributions due to finite size of the simulated samples are also taken into account via
JHEP10(2017)141
dedicated fit parameters and are propagated to µ. In this analysis, the normalisation of the dominantt¯tbackground is included as an unconstrained nuisance parameter; there are sufficient number of events in the control regions and low mass region of the signal region, where the signal contribution is small, to obtain a data-driven estimate of the tt¯normali- sation. Nuisance parameters representing systematic uncertainties are only included in the likelihood if either of the following conditions are met: overall impact on the normalisation is larger than 1%, or the shape of the uncertainty varies by more than 1% between adjacent bins. This is done separately for each region and for each template (signal or background).
When the bin-by-bin statistical variation of a given uncertainty is significant, a smoothing algorithm is applied.
The expected number of events in a given bin depends onµandθ. The nuisance param- eters θ adjust the expectations for signal and background according to the corresponding systematic uncertainties, and their fitted values correspond to the amounts that best fit the data. This procedure allows for a reduction of the impact of systematic uncertainties in the search sensitivity by taking advantage of the highly populated background-dominated control region (CR) included in the likelihood fit.
The test statistic qµ is defined as the profile likelihood ratio, qµ =
−2ln(L(µ,θˆˆµ)/L(ˆµ,θ)), where ˆˆ µand ˆθ are the values of the parameters that maximise the likelihood function (with the constraint 0≤µˆ ≤µ), and θˆˆµ are the values of the nuisance parameters that maximise the likelihood function for a given value ofµ. The compatibility of the observed data with the background-only hypothesis is tested by setting µ= 0 in the profile likelihood ratio: q0 =−2ln(L(0,θˆˆ0)/L(ˆµ,θ)). In the absence of any significant ex-ˆ cess above the expected background, upper limits on the signal production cross-section for each of the signal scenarios considered are derived by using qµ in the CLs method [73,74].
For a given signal scenario, values of the production cross-section (parameterised by µ) yielding CLs <0.05, where CLs is computed using the asymptotic approximation [75], are excluded at ≥95% CL.
7.2 Likelihood fit results
The expected and observed event yields in the signal and control regions after fitting the background-only hypothesis to data, including all uncertainties, are listed in table 2. The total uncertainty shown in the table is the uncertainty obtained from the full fit, and is therefore not identical to the sum in quadrature of each component, due to the correla- tions between the fit parameters. The compatibility of the data with the background-only hypothesis is estimated by integrating the distribution of the test statistic, approximated using the asymptotic formulae [75], above the observed value ofq0. This value is computed for each signal scenario considered, defined by the assumed mass of the heavy quark and the three decay branching ratios. The lowest p-value is found to be ∼50%, for aT mass of 700 GeV. Thus no significant excess above the background expectation is found.
The sensitivity of the analysis is limited by the statistical uncertainty of the data.
Including all systematic uncertainties degrades the expected mass limits by only around 20 GeVand for a mass of 1 TeV, the cross-section limit increases by 4%. Individual un-
JHEP10(2017)141
Sample Signal region Control region
tt¯ 39 ±10 700±70
W+jets 8± 4 78 ±38
Single top 7± 4 110±40
Others 10 ± 7 72 ±48
Total background 64 ± 9 970±50
Data 58 972
Table 2. Event yields in the signal and control regions after the background-only fit to the signal and control regions. The uncertainties include statistical and systematic uncertainties. The uncer- tainties in the individual background components can be larger than the uncertainty in the sum of the backgrounds, which is strongly constrained by the data.
[GeV]
lep
mT
0 200 400 600 800 1000 1200 1400 1600 1800 2000 Data / Pred. 0.2
0.6 1 1.4 1.8
Events / bin
0 5 10 15 20 25 30
35 ATLAS
= 13 TeV s 36.1 fb-1
Signal Region Post-Fit
Data t t
+jets W Single top Others Uncertainty
[GeV]
lep
mT
0 200 400 600 800 1000 1200 1400 1600 1800 2000 Data / Pred. 0.2
0.6 1 1.4 1.8
Events / bin
0 50 100 150 200 250 300 350
ATLAS = 13 TeV s 36.1 fb-1
Control Region Post-Fit
Data t t
+jets W Single top Others Uncertainty
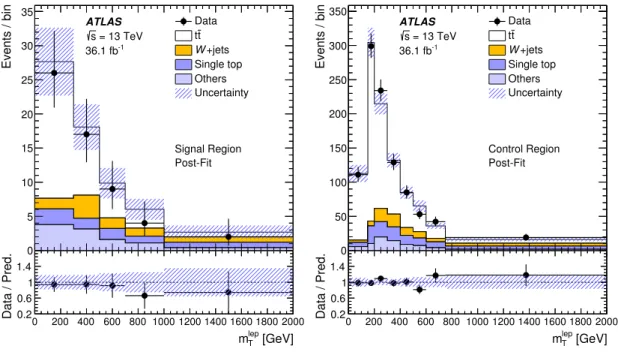
Figure 3. Fit results (background-only) for the leptonic VLQ candidate mass distributions (mlepT ) in (left) the signal region and (right) the control region. The lower panel shows the ratio of data to the fitted background yields. The band represents the systematic uncertainty after the maximum- likelihood fit.
certainties are generally not significantly constrained by data, except for the uncertainties associated with thett¯modelling that are constrained by up to 50% of their initial size.
A comparison of the post-fit agreement between data and prediction in the signal region, figure 3, shows a slight deficit of data in the signal region for the mlepT distribu- tion above 700 GeV. In this context, the observed upper limits on the TT¯ production cross-section are slightly stronger with respect to the expected sensitivity. The post-fit t¯t normalisation is found to be 0.93 ±0.16 times the Monte Carlo prediction, normalised to the NNLO+NNLL cross-section.
JHEP10(2017)141
7.3 Limits on VLQ pair production
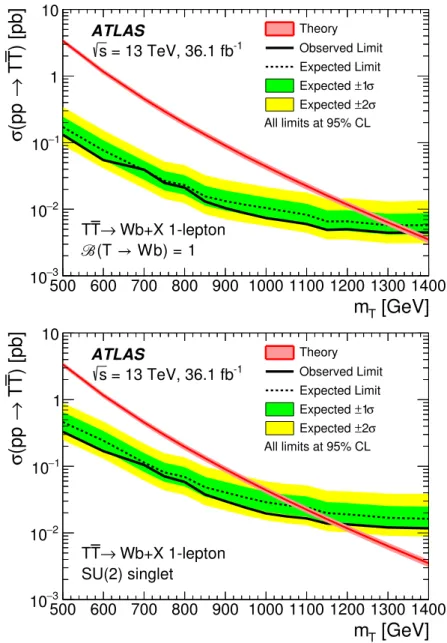
Upper limits at the 95% CL on theTT¯production cross-section are set for two benchmark scenarios as a function of T quark mass mT and compared to the theoretical prediction from Top++ v2.0 (figure 4). The resulting lower limit on mT is determined using the central value of the theoretical cross-section prediction. These results are only valid for new particles of narrow width. AssumingB(T →W b) =1, the observed (expected) lower limit is mT = 1350 GeV (1310 GeV). For branching ratios corresponding to the SU(2) singlet T scenario, the observed (expected) 95% CL lower limit is mT = 1170 GeV (1080 GeV). This represents a significant improvement compared to Run-1 searches [15, 16], for which the observed 95% CL limit was 920 GeV when assumingB(T →W b) =1.
To check that the results do not depend on the weak-isospin of the T quark in the simulated signal events, a sample of TT¯ events with a mass of 1.2 TeV was generated for an SU(2) doublet T quark and compared to the nominal sample of the same mass generated with an SU(2) singletT quark. Both the expected number of events and expected excluded cross-section are found to be consistent between those two samples. Thus the limits obtained are also applicable to VLQ models with non-zero weak-isospin. As there is no explicit use of charge identification, the B(T → W b) = 1 limits are found to be applicable to the pair-production of vector-like Y quarks of charge −4/3, which decay exclusively to W b.
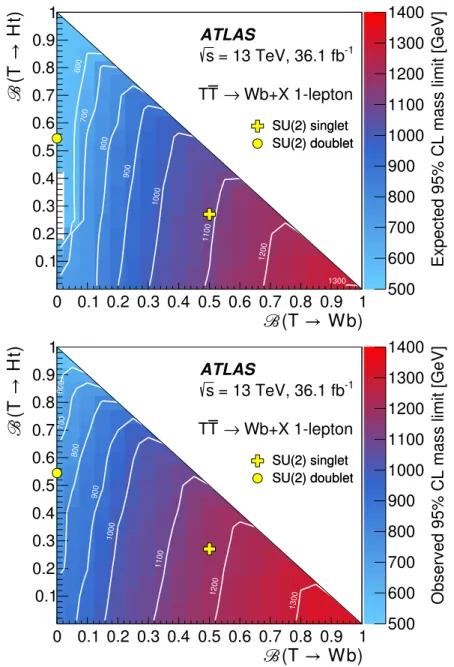
Exclusion limits on T quark pair-production are also obtained for different values of mT and as a function of branching ratios to each of the three decays. In order to probe the complete branching-ratio plane spanned by both processes, the signal samples are weighted by the ratios of the respective branching ratios to the original branching ratios in Protos.
Then, the complete analysis is repeated for each point in the B plane. Figure 5shows the corresponding expected and observedT quark mass limits in the plane B(T →Ht) versus B(T →W b), obtained by linear interpolation of the calculated CLs versusmT.
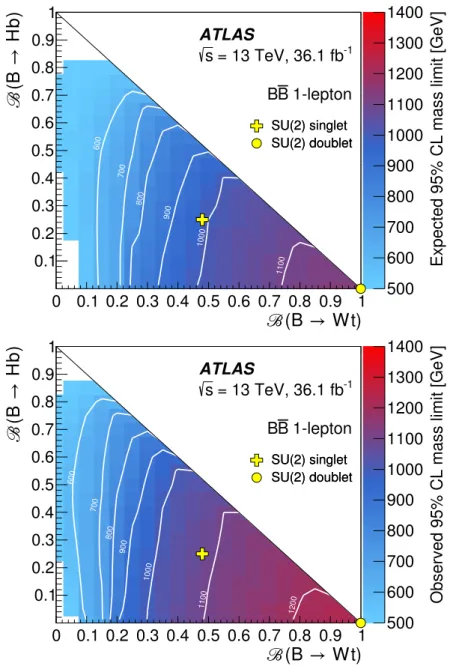
In this search, the acceptance for VLQ BB¯ pair production is ∼3% for the B(B → W t) = 1 scenario and ∼1.3% for the SU(2) singlet B scenario, which is similar to the TT¯ final state. Nonetheless, the sensitivity to BB¯ production is expected to be weaker, as the reconstructed T mass distribution is used as the final discriminant. Without any modifications to the analysis to specifically target BB¯ production, observed (expected) lower limits at 95% CL are set at 1250 (1150) GeV when assumingB(B →W t) = 1 and at 1080 (980) GeV for the SU(2) singletBscenario. This represents a significant improvement compared to Run-1 [76] and recent Run-2 searches [77] when assumingB(B →W t) =1, for which the observed 95% CL limit was 880 GeV and 1020 GeV, respectively. Being agnostic to the charge of the VLQ, the limits for B(B → W t) = 1 are found to be applicable to vector-like X quarks of charge +5/3, which exclusively decay to W t. Figure6 shows the corresponding expected and observedB quark mass limits in the planeB(B →Hb) versus B(B→W t), assumingB(B →Hb) +B(B→W t) +B(B →Zb) = 1 .
8 Conclusions
A search for the pair production of a heavy vector-like T quark, based on pp collisions at
√s= 13 TeV recorded in 2015 (3.2 fb−1) and 2016 (32.9 fb−1) with the ATLAS detector at
JHEP10(2017)141
[GeV]
mT
500 600 700 800 900 1000 1100 1200 1300 1400
) [pb]T T→(pp σ
3
10− 2
10− 1
10−
1 10
Theory Observed Limit Expected Limit
1σ Expected ±
2σ Expected ± All limits at 95% CL
Wb+X 1-lepton T→
T
ℬ(T →Wb) = 1 ATLAS
= 13 TeV, 36.1 fb-1
s
[GeV]
mT
500 600 700 800 900 1000 1100 1200 1300 1400
) [pb]T T→(pp σ
3
10− 2
10− 1
10−
1 10
Theory Observed Limit Expected Limit
1σ Expected ±
2σ Expected ± All limits at 95% CL
Wb+X 1-lepton T→
T
SU(2) singlet ATLAS
= 13 TeV, 36.1 fb-1
s
Figure 4. Expected (dashed black line) and observed (solid black line) upper limits at the 95% CL on the TT¯ cross-section as a function ofT quark mass assumingB(T →W b) = 1 (top) and in the SU(2) singletT scenario (bottom). The green and yellow bands correspond to±1 and±2 standard deviations around the expected limit. The thin red line and band show the theoretical prediction and its±1 standard deviation uncertainty.
the CERN Large Hadron Collider, is presented. Data are analysed in the lepton-plus-jets final state and no significant deviation from the Standard Model expectation is observed.
Assuming a branching ratio B(T → W b) = 1, the observed (expected) 95% CL lower limit on the vector-like quark mass is 1350 GeV (1310 GeV). For the scenario of an SU(2) singlet T quark, the observed (expected) mass limit is 1170 GeV (1080 GeV). Assuming the T quark can only decay to W b, Zt and Ht, 95% CL lower limits are derived for various masses in the two-dimensional plane of B(T → W b) versus B(T → Ht). This search is also reinterpreted to provide limits on B quark masses. These are found to be
JHEP10(2017)141
ℬ(T → Wb) 0 0.1 0.2 0.3 0.4 0.5 0.6 0.7 0.8 0.9 1
ℬ(T→Ht)
0.1 0.2 0.3 0.4 0.5 0.6 0.7 0.8 0.9 1
Expected 95% CL mass limit [GeV]
500 600 700 800 900 1000 1100 1200 1300 1400 ATLAS
= 13 TeV, 36.1 fb-1
s
Wb+X 1-lepton T →
T
600
700
800
900
1000
1100
1200
1300
SU(2) singlet SU(2) doublet SU(2) singlet SU(2) doublet
ℬ(T → Wb) 0 0.1 0.2 0.3 0.4 0.5 0.6 0.7 0.8 0.9 1
ℬ(T→Ht)
0.1 0.2 0.3 0.4 0.5 0.6 0.7 0.8 0.9 1
Observed 95% CL mass limit [GeV]
500 600 700 800 900 1000 1100 1200 1300 1400 ATLAS
= 13 TeV, 36.1 fb-1
s
Wb+X 1-lepton T →
T
600
700
800
900
1000
1100
1200
1300
SU(2) singlet SU(2) doublet SU(2) singlet SU(2) doublet
Figure 5. Expected (top) and observed (bottom) 95% CL lower limits on the mass of theT quark as a function of the decay branching ratios into B(T →W b) andB(T →Ht). Contour lines are provided to guide the eye. The markers indicate the branching ratios for the SU(2) singlet and doublet scenarios with masses above ∼0.8 TeV, where they are approximately independent of the VLQ T mass. The white region is due to the limit falling below 500 GeV, the lowest simulated signal mass.
1250 GeV (1150 GeV) assuming 100% branching ratio toW tand 1080 GeV (980 GeV) under the SU(2) singletB quark scenario. These limits are found to be equally applicable to VLQ Y quark and X quark production, that decay to W b and W t, respectively. Mass limits are also set as a function of the decay branching ratios B(T → Hb) versus B(T → W t) assuming only theB →W t,B→Zb and B →Hbdecay modes contribute.
JHEP10(2017)141
ℬ(B → Wt) 0 0.1 0.2 0.3 0.4 0.5 0.6 0.7 0.8 0.9 1
ℬ(B→Hb)
0.1 0.2 0.3 0.4 0.5 0.6 0.7 0.8 0.9 1
Expected 95% CL mass limit [GeV]
500 600 700 800 900 1000 1100 1200 1300 1400 ATLAS
= 13 TeV, 36.1 fb-1
s
1-lepton B
B
600
700
800 900
1000
1100
SU(2) singlet SU(2) doublet SU(2) singlet SU(2) doublet
ℬ(B → Wt) 0 0.1 0.2 0.3 0.4 0.5 0.6 0.7 0.8 0.9 1
ℬ(B→Hb)
0.1 0.2 0.3 0.4 0.5 0.6 0.7 0.8 0.9 1
Observed 95% CL mass limit [GeV]
500 600 700 800 900 1000 1100 1200 1300 1400 ATLAS
= 13 TeV, 36.1 fb-1
s
1-lepton B
B
600
700
800 900
1000
1100 1200
SU(2) singlet SU(2) doublet SU(2) singlet SU(2) doublet
Figure 6. Expected (top) and observed (bottom) 95% CL lower limits on the mass of theB quark as a function of the decay branching ratios into B(B →W t) and B(B →Hb). Contour lines are provided to guide the eye. The markers indicate the branching ratios for the SU(2) singlet and doublet scenarios with masses above ∼0.8 TeV, where they are approximately independent of the VLQ B mass. The white regions are due to the limit falling below 500 GeV, the lowest simulated signal mass.
Acknowledgments
We thank CERN for the very successful operation of the LHC, as well as the support staff from our institutions without whom ATLAS could not be operated efficiently.
We acknowledge the support of ANPCyT, Argentina; YerPhI, Armenia; ARC, Aus- tralia; BMWFW and FWF, Austria; ANAS, Azerbaijan; SSTC, Belarus; CNPq and
JHEP10(2017)141
FAPESP, Brazil; NSERC, NRC and CFI, Canada; CERN; CONICYT, Chile; CAS, MOST and NSFC, China; COLCIENCIAS, Colombia; MSMT CR, MPO CR and VSC CR, Czech Republic; DNRF and DNSRC, Denmark; IN2P3-CNRS, CEA-DSM/IRFU, France;
SRNSF, Georgia; BMBF, HGF, and MPG, Germany; GSRT, Greece; RGC, Hong Kong SAR, China; ISF, I-CORE and Benoziyo Center, Israel; INFN, Italy; MEXT and JSPS, Japan; CNRST, Morocco; NWO, Netherlands; RCN, Norway; MNiSW and NCN, Poland;
FCT, Portugal; MNE/IFA, Romania; MES of Russia and NRC KI, Russian Federation;
JINR; MESTD, Serbia; MSSR, Slovakia; ARRS and MIZˇS, Slovenia; DST/NRF, South Africa; MINECO, Spain; SRC and Wallenberg Foundation, Sweden; SERI, SNSF and Cantons of Bern and Geneva, Switzerland; MOST, Taiwan; TAEK, Turkey; STFC, United Kingdom; DOE and NSF, United States of America. In addition, individual groups and members have received support from BCKDF, the Canada Council, CANARIE, CRC, Compute Canada, FQRNT, and the Ontario Innovation Trust, Canada; EPLANET, ERC, ERDF, FP7, Horizon 2020 and Marie Sk lodowska-Curie Actions, European Union; In- vestissements d’Avenir Labex and Idex, ANR, R´egion Auvergne and Fondation Partager le Savoir, France; DFG and AvH Foundation, Germany; Herakleitos, Thales and Aristeia programmes co-financed by EU-ESF and the Greek NSRF; BSF, GIF and Minerva, Israel;
BRF, Norway; CERCA Programme Generalitat de Catalunya, Generalitat Valenciana, Spain; the Royal Society and Leverhulme Trust, United Kingdom.
The crucial computing support from all WLCG partners is acknowledged gratefully, in particular from CERN, the ATLAS Tier-1 facilities at TRIUMF (Canada), NDGF (Denmark, Norway, Sweden), CC-IN2P3 (France), KIT/GridKA (Germany), INFN-CNAF (Italy), NL-T1 (Netherlands), PIC (Spain), ASGC (Taiwan), RAL (U.K.) and BNL (U.S.A.), the Tier-2 facilities worldwide and large non-WLCG resource providers. Ma- jor contributors of computing resources are listed in ref. [78].
Open Access. This article is distributed under the terms of the Creative Commons Attribution License (CC-BY 4.0), which permits any use, distribution and reproduction in any medium, provided the original author(s) and source are credited.
References
[1] ATLAScollaboration,Observation of a new particle in the search for the standard model Higgs boson with the ATLAS detector at the LHC,Phys. Lett.B 716(2012) 1
[arXiv:1207.7214] [INSPIRE].
[2] CMScollaboration, Observation of a new boson at a mass of 125 GeV with the CMS experiment at the LHC,Phys. Lett.B 716(2012) 30[arXiv:1207.7235] [INSPIRE].
[3] G. ’t Hooft,Naturalness, chiral symmetry, and spontaneous chiral symmetry breaking, in Recent developments in gauge theories, G. ’t Hooft et al. eds., Plenum Press, New York U.S.A. (1980).
[4] N. Arkani-Hamed, A.G. Cohen, E. Katz and A.E. Nelson,The littlest Higgs,JHEP 07 (2002) 034[hep-ph/0206021] [INSPIRE].
[5] M. Schmaltz and D. Tucker-Smith,Little Higgs review,Ann. Rev. Nucl. Part. Sci. 55(2005) 229[hep-ph/0502182] [INSPIRE].
JHEP10(2017)141
[6] D.B. Kaplan, H. Georgi and S. Dimopoulos,Composite Higgs scalars,Phys. Lett.136B (1984) 187[INSPIRE].
[7] K. Agashe, R. Contino and A. Pomarol,The minimal composite Higgs model,Nucl. Phys.B 719(2005) 165[hep-ph/0412089] [INSPIRE].
[8] C.T. Hill and E.H. Simmons,Strong dynamics and electroweak symmetry breaking, Phys.
Rept.381(2003) 235[Erratum ibid.390(2004) 553] [hep-ph/0203079] [INSPIRE].
[9] F. del Aguila and M.J. Bowick,The possibility of new fermions with ∆I= 0 mass,Nucl.
Phys.B 224(1983) 107[INSPIRE].
[10] J.A. Aguilar-Saavedra,Identifying top partners at LHC,JHEP 11(2009) 030 [arXiv:0907.3155] [INSPIRE].
[11] J.A. Aguilar-Saavedra,Mixing with vector-like quarks: constraints and expectations, EPJ Web Conf.60(2013) 16012[arXiv:1306.4432] [INSPIRE].
[12] J.A. Aguilar-Saavedra, R. Benbrik, S. Heinemeyer and M. P´erez-Victoria,Handbook of vectorlike quarks: Mixing and single production,Phys. Rev.D 88(2013) 094010 [arXiv:1306.0572] [INSPIRE].
[13] A. Atre, M. Carena, T. Han and J. Santiago, Heavy quarks above the top at the Tevatron, Phys. Rev.D 79(2009) 054018 [arXiv:0806.3966] [INSPIRE].
[14] A. Atre et al.,Model-independent searches for new quarks at the LHC,JHEP 08(2011) 080 [arXiv:1102.1987] [INSPIRE].
[15] ATLAScollaboration,Search for production of vector-like quark pairs and of four top quarks in the lepton-plus-jets final state inpp collisions at√
s= 8 TeV with the ATLAS detector, JHEP 08 (2015) 105[arXiv:1505.04306] [INSPIRE].
[16] CMS collaboration, Search for vectorlike charge2/3tquarks in proton-proton collisions at
√s= 8TeV,Phys. Rev.D 93(2016) 012003.
[17] ATLAScollaboration,Search for pair production of vector-like top quarks in events with one lepton, jets and missing transverse momentum in√
s= 13TeVppcollisions with the ATLAS detector,JHEP 08(2017) 052[arXiv:1705.10751] [INSPIRE].
[18] ATLAS collaboration, Identification of boosted, hadronically-decaying W andZ bosons in
√s= 13TeV Monte Carlo Simulations for ATLAS, ATL-PHYS-PUB-2015-033(2015).
[19] ATLAS collaboration, Boosted hadronic top identification at ATLAS for early13TeV data, ATL-PHYS-PUB-2015-053(2015).
[20] ATLAScollaboration,The ATLAS experiment at the CERN Large Hadron Collider,2008 JINST 3S08003[INSPIRE].
[21] ATLAS collaboration, ATLAS insertable b-layer technical design report,ATLAS-TDR-19 (2010) [ATLAS-TDR-ADD-19].
[22] ATLAS collaboration, Early inner detector tracking performance in the 2015 data at
√s= 13TeV,ATL-PHYS-PUB-2015-051(2015).
[23] ATLAScollaboration,Performance of the ATLAS trigger system in 2015,Eur. Phys. J.C 77(2017) 317[arXiv:1611.09661] [INSPIRE].
[24] ATLAScollaboration,Luminosity determination inpp collisions at √
s= 8 TeV using the ATLAS detector at the LHC,Eur. Phys. J.C 76(2016) 653[arXiv:1608.03953] [INSPIRE].