EUROPEAN ORGANISATION FOR NUCLEAR RESEARCH (CERN)
JHEP 05 (2021) 093
DOI:10.1007/JHEP05(2021)093
CERN-EP-2021-001 31st May 2021
Search for new phenomena in final states with 𝒃 -jets and missing transverse momentum in √
𝒔 = 13 TeV 𝒑 𝒑 collisions with the ATLAS detector
The ATLAS Collaboration
The results of a search for new phenomena in final states with
𝑏-jets and missing transverse momentum using 139 fb
−1of proton–proton data collected at a centre-of-mass energy
√
𝑠 =
13 TeV by the ATLAS detector at the LHC are reported. The analysis targets final states produced by the decay of a pair-produced supersymmetric bottom squark into a bottom quark and a stable neutralino. The analysis also seeks evidence for models of pair production of dark matter particles produced through the decay of a generic scalar or pseudoscalar mediator state in association with a pair of bottom quarks, and models of pair production of scalar third-generation down-type leptoquarks. No significant excess of events over the Standard Model background expectation is observed in any of the signal regions considered by the analysis. Bottom squark masses below 1270 GeV are excluded at 95% confidence level if the neutralino is massless. In the case of nearly mass-degenerate bottom squarks and neutralinos, the use of dedicated secondary-vertex identification techniques permits the exclusion of bottom squarks with masses up to 660 GeV for mass splittings between the squark and the neutralino of 10 GeV. These limits extend substantially beyond the regions of parameter space excluded by similar ATLAS searches performed previously.
©2021 CERN for the benefit of the ATLAS Collaboration.
Reproduction of this article or parts of it is allowed as specified in the CC-BY-4.0 license.
arXiv:2101.12527v2 [hep-ex] 28 May 2021
1 Introduction
The possible existence of non-luminous matter in the universe, referred to as dark matter (DM), is supported by a wide variety of astrophysical and cosmological measurements [1–5]. However, the nature and properties of the DM remain largely unknown and represent one of the most important unanswered questions in physics.
A plausible candidate for cold dark matter [6, 7] is the stable lightest neutralino ( ˜
𝜒01
) in
𝑅-parity-conserving models [8] of electroweak scale supersymmetry (SUSY) [9–14]. In supersymmetric models that naturally address the gauge hierarchy problem [15–18], the scalar partners of the third-generation quarks are light [19, 20]. This may lead to the lighter bottom squark ( ˜
𝑏1
) and top squark (˜
𝑡1
) mass eigenstates
1being significantly lighter than the other squarks and gluinos. As a consequence, the ˜
𝑏1
and ˜
𝑡1
could be pair produced with relatively large cross-sections in
𝑝 𝑝collisions at the Large Hadron Collider (LHC [21]). In most SUSY models, the ˜
𝑏1
and the ˜
𝑡1
decay into final states incorporating third-generation quarks and invisible ˜
𝜒0 1particles.
More generically, the dark matter may be composed of weakly interacting massive particles (WIMPs, generically denoted by
𝜒in the rest of the paper) [22], of which the lightest supersymmetric particle (LSP) is one example. WIMPs can account for the measured relic density of dark matter in the early universe across a broad portion of parameter space [1, 2, 23]. WIMPs could be produced in pairs at the LHC through the decay of a new mediator particle coupling to Standard Model (SM) quarks [24–29]. Should this mediator preferentially couple to third-generation quarks then an excess of events containing such quarks along with invisible dark matter particles could be observed. Such events can be described in the framework of simplified DM models [28, 30, 31] with model assumptions described in Refs. [28, 29, 32, 33].
This paper describes a search for the production of invisible dark matter particles in association with bottom quarks. Signal regions (SRs) are developed which target the direct pair production of bottom squarks, each of which decays into a ˜
𝜒01
and a bottom quark, as shown in Figure 1(a). Additional signal regions target the pair production of DM particles through the decay of a generic scalar (
𝜙) or pseudoscalar (
𝑎) mediator state produced in association with a pair of bottom quarks (Figure 1(b)). The results of the analysis are also interpreted in the context of beyond-the-SM (BSM) scenarios incorporating pair-produced scalar third-generation down-type leptoquarks LQ
𝑑3[34–41] decaying to bottom quarks and neutrinos or top quarks and
𝜏-leptons (Figure 1(c)). These models are all characterised by events consisting of jets containing
𝑏-hadrons (referred to as
𝑏-jets), missing transverse momentum (
𝐸missT
), and no charged leptons.
Previous searches by ATLAS [42–45] and CMS [46, 47] using comparable or smaller datasets have targeted similar final states. This analysis extends the regions of parameter space probed by the LHC through the use of a larger dataset than in previous ATLAS searches, new boosted decision tree (BDT) discriminants, and also new selections maximising the efficiency for reconstructing
𝑏-jets with low transverse momentum generated by, for instance, SUSY models with small mass-splitting between ˜
𝑏1
and ˜
𝜒0 1.
Section 2 presents a brief overview of the ATLAS detector, Section 3 describes the data and simulation samples used in the analysis and Section 4 presents the methods used to reconstruct events. An overview of the analysis strategy, including background estimation, is presented in Section 5. The systematic uncertainties considered in the analysis are described in Section 6. Section 7 presents the results and interpretation thereof. The conclusions of the analysis are presented in Section 8.
1The scalar partners of the left-handed and right-handed chiral components of the bottom quark ( ˜𝑏
L, ˜𝑏
R) or top quark (˜𝑡
L, ˜𝑡
R) mix to form two mass eigenstates in each case, of which the ˜𝑏
1and the ˜𝑡
1are defined to be the lighter.
˜b
˜b p
p
˜ χ01 b
˜ χ01
b (a)
φ/a g
g
b χ χ b
(b)
LQd3
LQd3 p
p
ν, τ b, t
ν, τ
b, t (c)
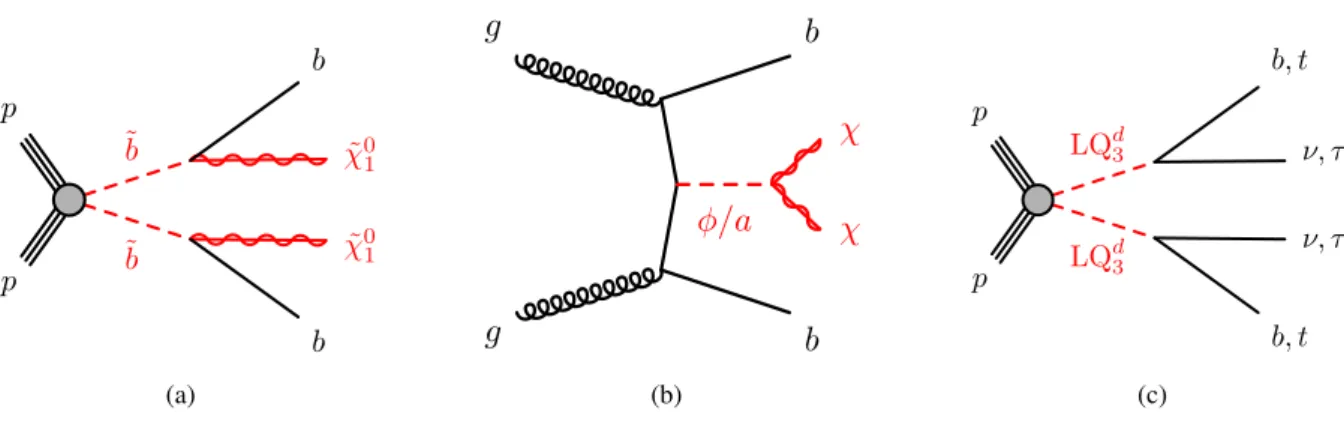
Figure 1: Diagrams illustrating the processes targeted by this analysis: (a) bottom squark pair production, (b) production of DM particles (indicated with𝜒) through the decay of a scalar or pseudoscalar mediator coupling to bottom quarks, and (c) pair production of scalar third-generation down-type leptoquarks decaying to bottom quarks and neutrinos or top quarks and𝜏-leptons. BSM particles are indicated in red, while SM particles are indicated in black.
2 ATLAS detector
The ATLAS detector [48–50] is a multipurpose detector with a forward–backward symmetric cylindrical geometry and nearly 4
𝜋coverage in solid angle.
2The inner detector (ID) tracking system consists of pixel and silicon microstrip detectors covering the pseudorapidity region
|𝜂|<2
.5, surrounded by a transition radiation tracker, which improves electron identification over the region
|𝜂| <2
.0. The ID is surrounded by a thin superconducting solenoid providing an axial 2 T magnetic field and by a fine-granularity lead/liquid-argon (LAr) electromagnetic calorimeter covering
|𝜂|<3
.2. A steel/scintillator-tile calorimeter provides hadronic coverage in the central pseudorapidity range (
|𝜂| <1
.7). The endcap and forward calorimeters (1
.5
< |𝜂| <4
.9) are made of LAr active layers with either copper or tungsten as the absorber material for electromagnetic and hadronic measurements. The muon spectrometer with an air-core toroid magnet system surrounds the calorimeters. Three layers of high-precision tracking chambers provide coverage in the range
|𝜂| <2
.7, while dedicated chambers allow triggering in the region
|𝜂| <2
.4.
3 Data collection and simulated event samples
The data analysed in this paper were collected between 2015 and 2018 at a centre-of-mass energy of 13 TeV with a 25 ns proton bunch crossing interval. The average number of
𝑝 𝑝interactions per bunch crossing (pile-up) ranged from 13 in 2015 to around 38 in 2017–2018. Application of beam, detector and data-quality criteria [51] results in a total integrated luminosity of 139 fb
−1. The uncertainty in the
2ATLAS uses a right-handed coordinate system with its origin at the nominal interaction point in the centre of the detector. The positive𝑥-axis is defined by the direction from the interaction point to the centre of the LHC ring, with the positive𝑦-axis pointing upwards, while the beam direction defines the𝑧-axis. Cylindrical coordinates(𝑟 , 𝜙)are used in the transverse plane, 𝜙being the azimuthal angle around the𝑧-axis. The transverse momentum𝑝
T, the transverse energy𝐸
Tand the missing transverse momentum are defined in the𝑥–𝑦plane unless stated otherwise. The pseudorapidity𝜂is defined in terms of the polar angle𝜃by𝜂=−ln tan(𝜃/2)and the rapidity is defined as𝑦=(1/2)ln[(𝐸+𝑝𝑧)/(𝐸−𝑝𝑧)]where𝐸is the energy and 𝑝𝑧the longitudinal momentum of the object of interest.
combined 2015–2018 integrated luminosity is 1.7% [52], obtained using the LUCID-2 detector [53] for the primary luminosity measurements and cross-checked by a suite of other systems.
Events are required to pass a missing transverse momentum trigger [54, 55] with an online threshold of 70–110 GeV, depending on the data-taking period. This trigger is found [55] to have an efficiency greater than 95% for events satisfying the offline selections of the analysis. Additional single-lepton triggers requiring the presence of electrons or muons are used in the two-lepton control regions defined in Section 5 to estimate the background originating from
𝑍+ jets production [56, 57]. These triggers yield an approximately constant efficiency in the presence of a single isolated electron or muon with transverse momentum (
𝑝T
) greater than 27 GeV.
Monte Carlo (MC) simulations are used to model SM background processes and the SUSY, dark matter and leptoquark signals considered in the analysis. Samples of bottom squark and dark matter signal events were generated with MadGraph5_aMC@NLO 2.6.2 [58] at leading order (LO) in the strong coupling constant (
𝛼S
), with the renormalisation and factorisation scales set to
𝐻genT /
2 (where
𝐻genT
is the scalar sum of the transverse momenta of the outgoing partons) and parton distribution function (PDF) NNPDF2.3 LO [59]. The matrix element (ME) calculations were performed at tree level and include the emission of up to two additional partons. Bottom squarks decayed directly into a ˜
𝜒01
and a bottom quark with 100% branching ratio, as is the case in
𝑅-parity-conserving models in which the lighter bottom squark is the next-to-lightest supersymmetric particle. Leptoquark signal events were generated at next-to-leading order (NLO) in
𝛼S
with MadGraph5_aMC@NLO 2.6.0 [58], using the leptoquark model of Ref. [60]
that adds parton showers to previous fixed-order NLO QCD calculations [61, 62], and the NNPDF3.0 NLO [63] PDF set with
𝛼S=
0
.118. In all cases, simulated signal events were passed to Pythia 8.230 [64]
for parton showering (PS) and hadronisation. ME–PS matching was performed following the CKKW-L prescription [65], with a matching scale set to one quarter of the mass of the bottom squark or leptoquark.
Bottom squark pair-production cross-sections were calculated at approximate next-to-next-to-leading-order (NNLO) accuracy in
𝛼S
, also adding contributions from the resummation of soft gluon emission at next-to- next-to-leading-logarithm accuracy (approximate NNLO+NNLL) [66–69]. The nominal cross-sections and their uncertainties were derived using the PDF4LHC15_mc PDF set, following the recommendations of Ref. [70]. For ˜
𝑏1
masses ranging from 400 GeV to 1.5 TeV, the cross-sections range from 2.1 pb to 0.26 fb, with uncertainties ranging from 7% to 17%. Leptoquark signal cross-sections were obtained from the calculation of direct top squark pair production, as this process has the same production modes, computed at approximate next-to-next-to-leading order (NNLO) in
𝛼S
with resummation of next-to-next-to-leading logarithmic (NNLL) soft gluon terms [66–69]. The cross-sections do not include lepton
𝑡-channel contributions, which are neglected in Ref. [60] and may lead to corrections at the percent level [71].
The production cross-sections for generic scalar and pseudoscalar mediators were evaluated including NLO QCD corrections assuming SM Yukawa couplings to quarks, in a five-flavour scheme, following the prescriptions of Ref. [72]. They were calculated with renormalisation and factorisation scales set to
𝐻genT /
3 and the jet
𝑝T
threshold (‘ptj’ in Ref. [72]) set to 20 GeV. They range from about 29 pb to about 1.5 fb for mediator masses between 10 GeV and 500 GeV.
The SM backgrounds considered in this analysis are:
𝑍+ jets production;
𝑊+ jets production;
𝑡𝑡¯ pair
production; single-top-quark production;
𝑡𝑡¯ production in association with electroweak or Higgs bosons
(
𝑡𝑡¯
+𝑋); and diboson production (
𝑊 𝑊,
𝑍 𝑍,
𝑍 𝑊,
𝑍 𝐻and
𝑊 𝐻). The events were simulated using different
MC generator programs depending on the process. Details of the generators, PDF set and underlying-event
tuned parameter set (tune) used for each process are listed in Table 1.
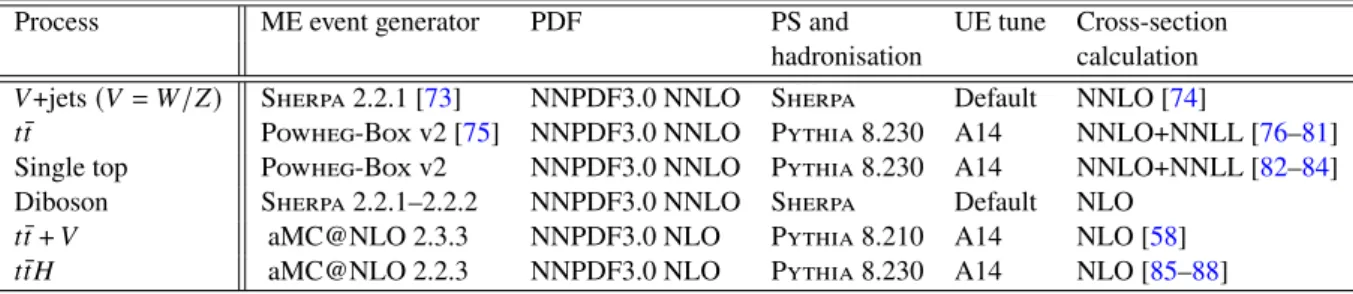
Table 1: The SM background MC simulation samples used in this paper. Generator, PDF set, parton shower, tune used for the underlying event (UE), and order in𝛼
Sof cross-section calculations used for yield normalisation, are shown for each process considered.
Process ME event generator PDF PS and UE tune Cross-section
hadronisation calculation 𝑉+jets(𝑉=𝑊/𝑍) Sherpa 2.2.1 [73] NNPDF3.0 NNLO Sherpa Default NNLO [74]
𝑡𝑡¯ Powheg-Box v2 [75] NNPDF3.0 NNLO Pythia 8.230 A14 NNLO+NNLL [76–81]
Single top Powheg-Box v2 NNPDF3.0 NNLO Pythia 8.230 A14 NNLO+NNLL [82–84]
Diboson Sherpa 2.2.1–2.2.2 NNPDF3.0 NNLO Sherpa Default NLO
𝑡𝑡¯+𝑉 aMC@NLO 2.3.3 NNPDF3.0 NLO Pythia 8.210 A14 NLO [58]
𝑡𝑡 𝐻¯ aMC@NLO 2.2.3 NNPDF3.0 NLO Pythia 8.230 A14 NLO [85–88]
The EvtGen v1.6.0 program [89] was used to describe the properties of the
𝑏- and
𝑐-hadron decays in the signal samples and in the background samples, except those produced with Sherpa. For all SM background samples, the response of the detector to particles was modelled with the full ATLAS detector simulation [90] based on Geant4 [91]. Signal samples were prepared using a fast simulation based on a parameterisation of showers in the ATLAS electromagnetic and hadronic calorimeters [92] coupled to Geant4 simulations of particle interactions elsewhere. All simulated events were overlaid with multiple
𝑝 𝑝collisions simulated with Pythia 8.186 using the A3 tune [93] and the NNPDF2.3 LO PDF set [59].
The MC samples were generated with variable levels of pile-up in the same and neighbouring collisions, and were reweighted to match the distribution of the mean number of interactions observed in data in 2015–2018.
4 Event reconstruction
The analysis identifies events with jets containing
𝑏-hadrons or secondary vertices corresponding to
𝑏-hadron decays, missing transverse momentum from the
𝜒or ˜
𝜒01
, and no charged leptons (electrons or muons). The last requirement is effective in suppressing SM backgrounds arising from
𝑊 →ℓ 𝜈decays, including events containing top quark production.
Events are required to have a primary vertex [94, 95] reconstructed from at least two tracks [96] with
𝑝T >0
.5 GeV. If more than one such vertex is found, the one with the largest sum of the squares of transverse momenta of associated tracks [95] is selected as the hard-scattering collision.
Jet candidates are reconstructed using the anti-
𝑘𝑡jet algorithm [97, 98] with radius parameter
𝑅=0
.4 [99]
using particle-flow objects (PFOs) [100] as inputs. PFOs are charged-particle tracks matched to the hard-scatter vertex with the requirement
|𝑧0
sin
𝜃| <2
.0 mm, where
𝑧0
is the longitudinal impact parameter,
3and calorimeter energy clusters surviving an energy subtraction algorithm that removes the calorimeter deposits of good-quality tracks from any vertex. Jet energy scale corrections, derived from MC simulation and data, are used to calibrate the average energies of jet candidates to the scale of their constituent particles [101]. Only corrected jet candidates with
𝑝T >
20 GeV and
|𝜂| <2
.8 are considered explicitly when selecting events in this analysis, although jet candidates lying within
|𝜂| ≤4
.5 are considered when calculating
𝐸missT
. A set of quality criteria is applied to identify jets which arise from non-collision sources
3The transverse impact parameter is defined as the distance of closest approach of a track to the beam-line, measured in the transverse plane. The longitudinal impact parameter corresponds to the𝑧-coordinate distance between the point along the track at which the transverse impact parameter is defined and the primary vertex.
or detector noise [102] and any event which contains a jet failing to satisfy these criteria is removed. Jets containing a large particle momentum contribution from pile-up vertices, as measured by the jet vertex tagger (JVT) discriminant [103] are rejected if they have
𝑝T∈ [
20
,60
]GeV,
|𝜂| <2
.4 and a discriminant value of JVT
<0
.5.
Selected jets are identified as
𝑏-jets if they lie within the ID acceptance of
|𝜂| <2
.5 and are tagged by a multivariate algorithm (
DL1r) which uses a selection of inputs including information about the impact parameters of ID tracks, the presence of displaced secondary vertices and the reconstructed flight paths of
𝑏- and
𝑐-hadrons inside the jet [104]. The
𝑏-tagging algorithm uses a working point with an efficiency of 77%, determined with a sample of simulated
𝑡𝑡¯ events. The corresponding misidentification (mis-tag) rate is 20% for
𝑐-jets and 0.9% for light-flavour jets. Differences in efficiency and mis-tag rate between data and MC simulation are taken into account with correction factors as described in Ref. [104].
To enhance sensitivity to models where low-
𝑝T
bottom quarks are present in the final state (e.g. bottom squark pair production with nearly mass-degenerate ˜
𝑏1
and ˜
𝜒01
), a dedicated secondary-vertex finding algorithm (TC-LVT) is used. Documented in Ref. [105], this algorithm reconstructs secondary vertices independently of the presence of an associated jet. A new loose working point, defined using the same track and vertex variables described in Ref. [106] for the medium and tight working points, was optimised for this analysis. The efficiency to correctly identify the secondary vertex associated with the decay of a
𝑏-hadron (
𝜖vtx) ranges from 5% for a
𝑏-hadron
𝑝T
of 5 GeV to 40% for a
𝑝T
of 15 GeV. The corresponding probability (
𝑓vtx) to obtain a vertex in an event without a
𝑏-hadron depends on the event topology and pile-up conditions, and is 1%–5%. Differences in
𝜖vtx(
𝑓vtx) between data and MC simulation are taken into account by using correction factors computed in dileptonic
𝑡𝑡¯ (
𝑊+ jets) production events. The correction factors are compatible with one for
𝜖vtxand range between 1.2 and 1.5 for
𝑓vtx.
Two different classes (‘baseline’ and ‘high-purity’) of reconstructed lepton candidates (electrons or muons) are used in the analyses presented here. When selecting samples for the search, events containing a
‘baseline’ electron or muon are rejected. When selecting events with leptons for the purpose of estimating
𝑊+ jets,
𝑍+ jets and top quark backgrounds, additional requirements are applied to leptons to ensure greater purity of these backgrounds. These leptons are referred to as ‘high-purity’ leptons in the following and form a subset of the baseline leptons.
Baseline muon candidates are formed by combining information from the muon spectrometer and ID as described in Refs. [107, 108] and are required to possess
𝑝T >
6 GeV and
|𝜂| <2
.7. Baseline muon candidates must additionally have a significance of the transverse impact parameter relative to the beam-line
|𝑑BL
0 |/𝜎(𝑑BL
0 ) <
3, and a longitudinal impact parameter relative to the primary vertex
|𝑧0
sin
(𝜃) |<0
.5 mm.
Furthermore, high-purity muon candidates must satisfy the Medium identification requirements described in Refs. [107, 108] and the FixedCutTightTrackOnly isolation requirements, which are described in the same references and use tracking-based variables to implement a set of
𝜂- and
𝑝T
-dependent criteria.
Baseline electron candidates are reconstructed from an isolated electromagnetic calorimeter energy deposit matched to an ID track [109] and are required to possess
𝑝T >
7 GeV and
|𝜂| <2
.47, and to satisfy the Loose likelihood-based identification criteria described in Refs. [109, 110]. High-purity electron candidates are also required to possess
|𝑑BL0 |/𝜎(𝑑BL
0 ) <
5 and
|𝑧0
sin
(𝜃) | <0
.5 mm, and to satisfy Tight isolation requirements [109, 110].
High-purity muon and electron candidates used to estimate backgrounds in this analysis are required to possess
𝑝T >
20 GeV in order to reduce the impact of misidentified or non-prompt leptons. In
addition, when using events selected with single-lepton triggers, the leading lepton is required to possess
𝑝T >27 GeV in order to ensure that events are selected in the trigger plateau.
After the selections described above, a procedure is applied to remove non-isolated leptons and avoid double counting of tracks and energy depositions associated with overlapping reconstructed jets, electrons and muons. The procedure applies the following actions to the event. First, baseline electrons are discarded if they share an ID track with a baseline muon. Next, any jet with
|𝜂| <2
.8 lying within a distance
Δ𝑅≡√︁(Δ𝑦)2+ (Δ𝜙)2=
0
.2 of a baseline electron is discarded and the electron is retained. Similarly, any jet with
|𝜂| <2
.8 satisfying
𝑁trk <
3 (where
𝑁trk
refers to the number of tracks with
𝑝T >
500 MeV that are associated with the jet) within
Δ𝑅≡√︁(Δ𝑦)2+ (Δ𝜙)2 =
0
.2 of a baseline muon is discarded and the muon is retained. Finally, baseline electrons or muons lying within a distance
Δ𝑅=min
(0
.4
,0
.04
+10 GeV
/𝑝𝑒/𝜇 T )
of a remaining jet are discarded.
Multiplicative scale factors are applied to simulated events to account for differences between data and simulation for the lepton trigger, reconstruction, identification and isolation efficiencies, and for the jet momentum scales and energy resolutions. Similar corrections are also applied to the probability of mis-tagging jets originating from the hard
𝑝 𝑝scattering as pile-up jets with the JVT discriminant.
The missing transverse momentum
pmissT
, whose magnitude is referred to as
𝐸missT
, is defined as the negative vector sum of the
𝑝T
of all selected and calibrated physics objects (electrons, muons, photons and jets) in the event, with an extra term added to account for energy in the event that is not associated with any of these objects [111]. This last ‘soft term’ contribution is calculated from the ID tracks with
𝑝T >
500 MeV associated with the primary vertex, thus ensuring that it is robust against pile-up contamination [111, 112].
Photons contributing to the
pmissT
calculation are required to satisfy
𝑝T >
25 GeV and
|𝜂|<2
.37 (excluding the transition region 1
.37
< |𝜂| <1
.52 between the barrel and endcap EM calorimeters), to pass photon shower shape and electron rejection criteria, and to be isolated [109, 113].
5 Analysis strategy
In total, four sets of SRs are defined to target bottom squark pair-production or generic WIMP production in association with
𝑏-jets and are labelled SRX with X = A to D. Each set of signal regions targets different values of
Δ𝑚(𝑏˜
1,𝜒
˜
01)
, the mass separation between the ˜
𝑏1
and ˜
𝜒01
, or low and high dark matter mediator masses. The event selections defined for these regions all require the absence of baseline leptons, and exploit different techniques to improve the sensitivity to the target signal models. SRA targets large values of
Δ𝑚(𝑏˜
1,𝜒
˜
01)
, and its definition resembles that used in Refs. [42, 43, 114–116]. SRB, whose selection is mutually exclusive with that of SRA, is designed to be optimal for 50 GeV
<Δ𝑚(𝑏˜
1,𝜒
˜
01) <
200 GeV, and uses a boosted decision tree (BDT) [117] as the final discriminant. SRC targets signals with
Δ𝑚(𝑏˜
1,𝜒
˜
01) <
50 GeV, and exploits the information from the TC-LVT algorithm about the presence of vertices associated with low-
𝑝T 𝑏
-hadrons produced by the bottom squark decays. When deriving mass exclusion limits on bottom squarks or leptoquarks, SRA and SRB are statistically combined, and the analysis yielding the better of the expected CL
Svalues [118] from the combined SRA/SRB and SRC is used for each signal point. Finally, SRD is optimised to target the dark matter models with scalar or pseudoscalar mediators by making use of a BDT.
For all signal regions, the SM background estimation is performed with a likelihood fit [119] where the
normalisation factors of the MC datasets corresponding to the SM processes expected to contribute the
most to the event yields in the SRs (
𝑍+ jets for all signal regions,
𝑊+ jets and
𝑡𝑡¯ for SRC) are left free to
float. To aid their determination, dedicated control regions (CR) select events containing either one or two leptons, and having kinematic properties similar to events in the signal regions, but with negligible expected signal contributions. The quality of the background estimation is verified in dedicated validation regions (VR), designed to select events as similar as possible to those populating the SRs, while keeping signal contributions low. The likelihood is built as the product of Poissonian terms for each CR and, when assessing the discovery and exclusion sensitivity to new phenomena, SR bins. The effect of systematic uncertainties on the Poissonian expectation values is included through nuisance parameters assumed to have Gaussian probability distributions, as described in Section 6.
5.1 Discriminating variables
Several kinematic variables built from the physics objects defined in the previous section are used to discriminate new physics from known SM background events. Variables which are used in many SRs are described here, while SR-specific variables are described in the corresponding SR sections below.
Wherever necessary, final-state objects are labelled following a descending
𝑝T
ordering.
•
min
[Δ𝜙(pjet1−𝑛
,pmiss
T )]
: The minimum
Δ𝜙between any of the leading
𝑛jets and
pmissT
. The background from multijet processes is characterised by small values of this variable.
• 𝐻
T;3
: It is defined as the scalar sum of the
𝑝T
of all jets excluding the leading two:
𝐻T;3=∑︁
𝑖≥3
(𝑝jet
T)𝑖.
The variable is used to reject events with extra-jet activity in signal regions targeting models characterised by small mass-splitting between the bottom squark and the neutralino.
• 𝑚
eff
: It is defined as the scalar sum of the
𝑝T
of the jets and the
𝐸miss T, i.e.:
𝑚eff =∑︁
𝑖
(𝑝jet
T )𝑖+𝐸miss
T .
The
𝑚eff
observable is correlated with the mass of the directly pair-produced SUSY particles and is employed as a discriminating variable, as well as in the computation of other composite observables.
• S
: The global
𝐸missT
significance, calculated including parameterisations of the resolutions of all selected objects [120]. It is defined as follows:
S= vt
|pmiss
T |2 𝜎2
L(
1
−𝜌2 LT).
Here
𝜎L
is the total momentum resolution after being rotated into the longitudinal (parallel to the
pmissT
) plane. The total momentum resolution of all jets and leptons, at a given
𝑝T
and
|𝜂|, is determined from parameterised Monte Carlo simulation in which the resolution measured in data is modelled well. The quantity
𝜌LT
is a correlation factor between the longitudinal and transverse momentum resolution (again with respect to the
pmissT
) of each jet or lepton. The significance
Sis used to discriminate between events where the
𝐸missT
arises from invisible particles in the final state and events where the
𝐸missT
arises from poorly measured particles (and jets).
• 𝑚𝑗 𝑗
: The invariant mass of the two leading jets. In events where at least one of the leading jets is
𝑏-tagged, this variable helps to reduce the contamination from
𝑡𝑡¯ events. It is referred to as
𝑚𝑏 𝑏when the two leading
𝑏-tagged jets are considered.
• 𝑚
T(pℓ
T
,pmiss
T )
: The transverse mass of the lepton and the missing transverse momentum is defined as:
𝑚T(pℓ
T,pmiss
T ) =
√︃
2p
ℓT𝐸miss T −2
pℓT·pmiss
T
and is used in the CRs to suppress the contribution from fake and non-prompt leptons, which are normally characterised by low
𝑚T(pℓ
T
,pmiss
T )
values in multijet production events.
• 𝑚
CT
: The contransverse mass [121] is the main discriminating variable in the SRA signal regions. It is used to measure the masses of pair-produced heavy particles decaying semi-invisibly. For identical decays of two heavy particles (e.g. the bottom squarks decaying exclusively as ˜
𝑏1 →𝑏𝜒
˜
0) into two visible particles
𝑣1
and
𝑣2
(the bottom quarks), and two invisible particles
𝑋1
and
𝑋2
(the ˜
𝜒0for the signal),
𝑚CT
is defined as
𝑚2CT(𝑣
1, 𝑣
2) =[𝐸
T(𝑣
1) +𝐸
T(𝑣
2)]2− [pT(𝑣
1) −pT(𝑣
2)]2,
with
𝐸T =
√︃
𝑝2
T+𝑚2
, and it has a kinematic endpoint at
𝑚max CT = (𝑚2𝐼 −𝑚2
𝑋)/𝑚𝐼
, where
𝐼is the initially pair-produced particle. This variable is extremely effective in suppressing the top quark pair production background (
𝐼 =𝑡 , 𝑋 =𝑊), for which the endpoint is at 135 GeV.
• 𝑚min
T (
jet
1−4,pmissT )
: This is the minimum of the transverse masses calculated using any of the leading four jets and the
pmissT
in the event. For signal scenarios with low values of
𝑚maxCT
, this kinematic variable is an alternative discriminating variable to reduce the
𝑡𝑡¯ background.
5.2 SRA definition
SRA targets bottom squark pair production with large values of
Δ𝑚(𝑏˜
1,𝜒
˜
01)
. The selection criteria are summarised in Table 2. Only events with
𝐸missT
>
250 GeV are retained to ensure full efficiency of the online trigger selection and comply with the expected signal topology. To discriminate against multijet production, events where
pmissT
originates from the mismeasurement of a jet are suppressed with selections on min
[Δ𝜙(pjet1−4,pmiss
T )]
and
𝐸miss T /𝑚eff
. The final state is expected to contain two
𝑏-jets from the two bottom squark decays. A veto on large hadronic activity (implemented by rejecting events with a fourth jet of significant
𝑝T
) is imposed to suppress mostly events from SM
𝑡𝑡¯ production. SM
𝑊+ jets and
𝑍+ jets production, where
𝑏-jets are produced mainly via gluon splitting, is suppressed by a selection on
𝑚𝑏 𝑏. Finally, selections on
𝑚eff
and
𝑚CT
are applied to maximise the sensitivity to the signal. When excluding specific models of bottom squark production, a two-dimensional binning in
𝑚CT
and
𝑚eff
is applied. Five mutually exclusive regions (
𝑚CT ∈ [
250
,350
), [350
,450
), [450
,550
), [550
,650
)and
[650
,∞), with all units in GeV) denoted by SRAmctX, where X is the bin lower bound, are used.
SRAmct250 is subdivided into five bins of
𝑚eff
, starting from
𝑚eff >
500 GeV and increasing in steps of 200 GeV, with the last bin including all events with
𝑚eff >
1300 GeV. SRAmct350 and SRAmct450 are both defined with two bins of
𝑚eff
(
[0
.5 TeV
,1 TeV
), [1 TeV
,∞)and
[1 TeV
,1
.5 TeV
), [1
.5 TeV
,∞)respectively). Due to the relatively small number of events selected by the highest two
𝑚CT
bins, a single selection
𝑚eff >
1
.0
(1
.5
)TeV is applied in SRAmct550 (SRAmct650) respectively. When assessing the model-independent discovery significance against the background-only hypothesis (see Section 7), five discovery regions, named SRAmctXi are defined by removing any binning in
𝑚eff
.
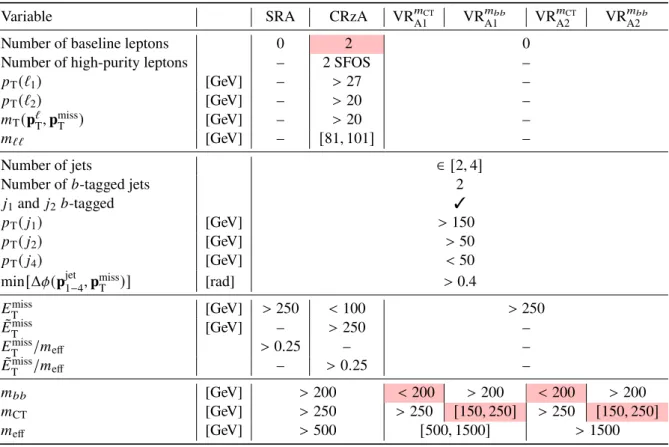
Table 2: SRA signal, control and validation region definitions. Pink cells for the control and validation regions’
columns indicate which selections ensure that the regions are orthogonal to the SR.
Variable SRA CRzA VR𝑚A1CT VRA1𝑚𝑏 𝑏 VRA2𝑚CT VR𝑚A2𝑏 𝑏
Number of baseline leptons 0 2 0
Number of high-purity leptons – 2 SFOS –
𝑝T(ℓ
1) [GeV] – >27 –
𝑝T(ℓ
2) [GeV] – >20 –
𝑚T(pℓ
T,pmiss
T ) [GeV] – >20 –
𝑚ℓ ℓ [GeV] – [81,101] –
Number of jets ∈ [2,4]
Number of𝑏-tagged jets 2
𝑗1and 𝑗
2𝑏-tagged 3
𝑝T(𝑗
1) [GeV] >150
𝑝T(𝑗
2) [GeV] >50
𝑝T(𝑗
4) [GeV] <50
min[Δ𝜙(pjet
1−4,pmiss
T )] [rad] >0.4
𝐸miss
T [GeV] >250 <100 >250
˜ 𝐸miss
T [GeV] – >250 –
𝐸miss
T /𝑚
eff >0.25 – –
˜ 𝐸miss
T /𝑚
eff – >0.25 –
𝑚𝑏 𝑏 [GeV] >200 <200 >200 <200 >200
𝑚CT [GeV] >250 >250 [150,250] >250 [150,250]
𝑚eff [GeV] >500 [500,1500] >1500
5.3 SRB definition If
Δ𝑚(𝑏˜
1,𝜒
˜
01) <
200 GeV, selections based on the
𝑚CT
and
𝑚𝑏 𝑏variables are no longer effective and a multivariate approach is preferred to separate the signal from SM production processes. A BDT is implemented by making use of the
XGBoost(XGB) framework [117]. The training procedure used events that pass the selection specified in Table 3 (with the exception of the BDT output score) and are classified in four different categories: three corresponding to the main backgrounds processes (
𝑡𝑡¯ ,
𝑍+ jets,
𝑊+ jets production), and one grouping together semi-compressed signal samples (
Δ𝑚(𝑏˜
1,𝜒
˜
01) ≤
200 GeV, where the event selection suppresses the acceptance for samples with
Δ𝑚(𝑏˜
1,𝜒
˜
01) ≤
30 GeV ), for scalar bottom squark masses
𝑚˜ 𝑏1
<
800 GeV. A one vs rest multi-classification procedure was used: for each classifier, the class is fitted against all the other classes producing output scores containing the predicted probability of an event being in each class. The output score
𝑤XGB
denotes the signal classifier output score and is used in the definition of the signal region. The rotational invariance of event topologies in the transverse plane is exploited by rotating the azimuthal angles of all final-state objects so that
𝐸missT
has
𝜙(pmissT ) =
0. The variables used in the training are the momentum vectors of the jets, the
𝑏-tagging information, and other event-level variables (
𝑚eff
,
S,
𝑚CT
,
𝑚minT (
jet
1−4,pmissT )
and
Δ𝑅(𝑏1, 𝑏
2)
). The highest-ranked variables after training are
𝑚minT (
jet
1−4,pmissT )
and the transverse momenta of the first three jets in the event.
The full selection of SRB is defined in Table 3. An upper bound on
𝑚CT
ensures that the selection is ortho-
gonal to SRA. When assessing the exclusion sensitivity for the signal-plus-background hypothesis for specific
BSM models, four
𝑤XGB
bins are used in the likelihood fit (
[0
.75
,0
.80
), [0
.80
,0
.85
), [0
.85
,0
.90
), [0
.90
,1
]).
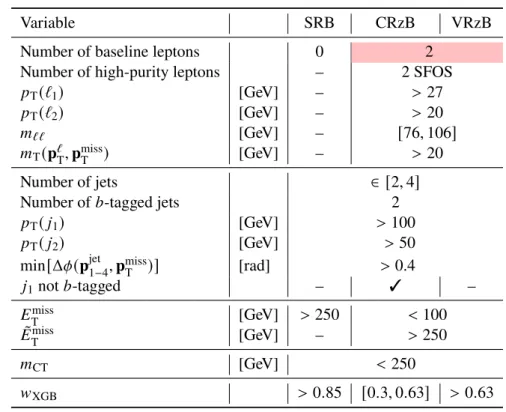
Table 3: SRB signal, control and validation region definitions. Pink cells for the control and validation regions’
columns indicate which selections ensure that the regions are orthogonal to the SR.
Variable SRB CRzB VRzB
Number of baseline leptons 0 2
Number of high-purity leptons – 2 SFOS
𝑝T(ℓ
1)
[GeV] –
>27
𝑝T(ℓ
2)
[GeV] –
>20
𝑚ℓ ℓ
[GeV] –
[76
,106
]𝑚T(pℓ
T
,pmiss
T )
[GeV] –
>20
Number of jets
∈ [2
,4
]Number of
𝑏-tagged jets 2
𝑝T(𝑗
1)
[GeV]
>100
𝑝T(𝑗
2)
[GeV]
>50
min
[Δ𝜙(pjet1−4,pmiss
T )]
[rad]
>0.4
𝑗1
not
𝑏-tagged –
3–
𝐸miss
T
[GeV]
>250
<100
˜
𝐸missT
[GeV] –
>250
𝑚CT
[GeV]
<250
𝑤XGB >
0
.85
[0
.3
,0
.63
] >0
.63
5.4 SRC definition
SRC targets events where a bottom squark pair is produced recoiling against a high-
𝑝T
initial-state-radiation (ISR) jet and
Δ𝑚(𝑏˜
1,𝜒
˜
01) <
50 GeV. In the boosted bottom squark decay, the boost is mostly transferred to ˜
𝜒01
because of its mass. It is because of such boost that the
𝐸missT
satisfies the trigger requirements, while the bottom quarks are instead expected to have low
𝑝T
. Three mutually exclusive signal regions, based on the number of
𝑏-tagged jets and TC-LVT-identified vertices (
𝑁vtx
), are defined: SRC-2b, two
𝑏-jets; SRC-1b1v, one
𝑏-jet and at least one TC-LVT vertex; and SRC-0b1v, no
𝑏-jets and at least one TC-LVT vertex. The three regions offer complementary sensitivity depending on
Δ𝑚(𝑏˜
1,𝜒
˜
01)
, and are statistically combined when stating the sensitivity for exclusion of bottom squark pair production models.
They all exploit the topological and kinematic features of the signal by requiring large
𝐸missT
and a high-
𝑝T
, non-
𝑏-tagged leading jet, and vetoing on additional hadronic activity by imposing an upper bound on
𝐻T;3
. The following variables are used to better extract the signal from the SM background:
•
The bottom quarks coming from the bottom squark decay are expected to be produced centrally in pseudorapidity, angularly close to each other and nearly back-to-back to the ISR jet. This is exploited in SRC-1b1v and SRC-0b1v with selections on the angular separation in the transverse plane between the leading jet and the
𝑏-jet or TC-LVT vertex, and on the pseudorapidity of the TC-LVT vertex,
𝜂vtx
.
•
The
𝑝T
of the leading ISR jet is expected to be significantly higher than that of the second jet, expected to come from the bottom squark decay. Therefore the variable
A = 𝑝
T(𝑗
1) −𝑝
T(𝑗
2) 𝑝T(𝑗
1) +𝑝
T(𝑗
2)
is expected to take values close to one for the signal, while it is expected to have a wider distribution for the background. This variable is not used in SRC-0b1v, where a jet coming from the bottom squark decay cannot be identified.
•
The vertex mass (
𝑚vtx
) and
𝑝T
(
𝑝vtxT
) are useful in rejecting events where the vertex is due to a
𝑐-hadron decay or to a random track crossing. For these fake vertices the values of both variables tend to be lower than for vertices originating from
𝑏-hadron decays.
The full list of selections applied to these variables and to other variables introduced in Section 5.1 is shown in Table 4. To further enhance the exclusion sensitivity, two different bins in
𝐸missT
are defined (
𝐸missT ∈ [
500 GeV
,650 GeV
), [650 GeV
,∞)for SRC-2b and
𝐸missT ∈ [
400 GeV
,600 GeV
), [600 GeV
,∞)for SRC-1b1v and SRC-0b1v).
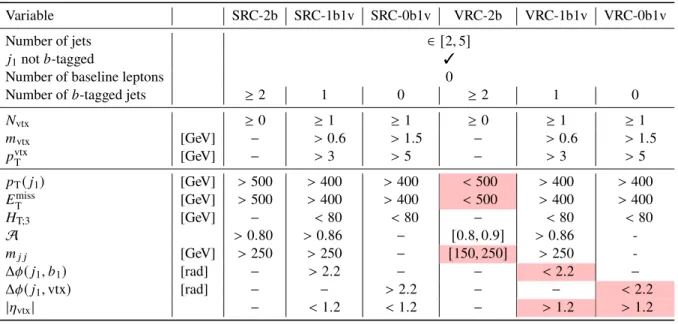
Table 4: SRC signal and validation region definitions. Pink cells for the validation regions’ columns indicate which selections ensure that they are orthogonal to the corresponding SR.
Variable SRC-2b SRC-1b1v SRC-0b1v VRC-2b VRC-1b1v VRC-0b1v
Number of jets ∈ [2,5]
𝑗1not𝑏-tagged 3
Number of baseline leptons 0
Number of𝑏-tagged jets ≥2 1 0 ≥2 1 0
𝑁vtx ≥0 ≥1 ≥1 ≥0 ≥1 ≥1
𝑚vtx [GeV] − >0.6 >1.5 − >0.6 >1.5
𝑝vtx
T [GeV] − >3 >5 − >3 >5
𝑝T(𝑗
1) [GeV] >500 >400 >400 <500 >400 >400
𝐸miss
T [GeV] >500 >400 >400 <500 >400 >400
𝐻T;3 [GeV] − <80 <80 − <80 <80
A >0.80 >0.86 − [0.8,0.9] >0.86 -
𝑚𝑗 𝑗 [GeV] >250 >250 − [150,250] >250 -
Δ𝜙(𝑗
1, 𝑏
1) [rad] − >2.2 − − <2.2 −
Δ𝜙(𝑗
1,vtx) [rad] − − >2.2 − − <2.2
|𝜂
vtx| − <1.2 <1.2 − >1.2 >1.2
5.5 SRD definition
Two signal regions target low- and high-mediator-mass dark matter signals, and are named SRD-low and SRD-high, respectively: SRD-low is optimised for mediator masses from 10 to 100 GeV, while SRD-high is optimised for mediator masses from 200 to 500 GeV. A common preselection is applied including the requirement of two
𝑏-jets in the final state. The thresholds for the missing transverse momentum and the
𝑝Tof the leading jet are kept as low as possible via a two-dimensional requirement selecting events on the trigger plateau, i.e.
(𝑝T(𝑗
1) −
20 GeV
) (𝐸missT −
160 GeV
) >5000 GeV
2. Then BDTs are trained to
discriminate between the three most relevant background processes (top pair production,
𝑊+ jets,
𝑍+ jets) and two sets of kinematically similar signal models which are characterised by either low or high mediator mass. This results in six BDT discriminants, denoted by
𝑤XY
, where X and Y are the background process and signal mass range used in the training, respectively. The BDT discriminants have ranges of
[−1
,1
]with the more positive values being more signal-like. In addition to some of the variables listed in Section 5.1, the following variables are used specifically in SRD:
• 𝐻
T
: the scalar sum of the jet transverse momenta. The ratio of the leading jet
𝑝T
to
𝐻T
is used in the signal region selection.
• 𝛿+
,
𝛿−: angular variables that exploit the topology of the event [44]. They are defined as two linear combinations of min
[Δ𝜙(pjet1−3
,pmiss
T )]
and the azimuthal separation between the
𝑏-jets,
Δ𝜙𝑏 𝑏.
𝛿−=min
[Δ𝜙(pjet1−3,pmiss
T )] −Δ𝜙𝑏 𝑏, 𝛿+=|
min
[Δ𝜙(pjet1−3
,pmiss
T )] +Δ𝜙𝑏 𝑏−𝜋|.
These variables are used in the training of the different BDTs together with the
𝑝T
of the leading
𝑏-jet and of the second and third jets in the event,
𝐸missT
,
S, min
[Δ𝜙(pjet1−3,pmiss
T )]
, and
𝑚CT
computed using the two leading jets. The most discriminating variables are min
[Δ𝜙(pjet1−3
,pmiss
T )]
and the ratio of the leading jet
𝑝T
to
𝐻T
. The signal region selections are detailed in Table 5. A final discriminating variable cos
𝜃∗𝑏 𝑏
[122] is considered: it is defined as
cos
𝜃∗𝑏 𝑏 =
tanh
Δ𝜂(𝑏
1, 𝑏
2)
2
.
When excluding models of DM production, the SRDs are further divided into five equal bins of width 0
.2 in the
[0
,1
]range of cos
𝜃∗𝑏 𝑏
. When assessing the model-independent discovery significance against the background-only hypothesis, a single bin in cos
𝜃∗𝑏 𝑏
defined by cos
𝜃∗𝑏 𝑏
>
0
.6
(0
.8
)is used in SRD-low (SRD-high).
5.6 Control and validation region definition
Event selections kinematically similar to those of the signal regions are defined for the control regions, which are characterised by negligible expected signal contributions for the BSM models considered.
Contrary to the SRs, such CRs rely on the presence of either one or two same-flavour opposite-sign (SFOS) high-purity electrons or muons (generically denoted by
ℓ), and are defined such that their event yield is dominated by one specific SM production process. They are part of the likelihood fit, where they are key to determining the value of the free-floating normalisation parameter associated with the MC prediction of the dominant background process.
The SM background yield is dominated in most signal regions by
𝑍+ jets production followed by
𝑍 →𝜈𝜈¯ . For each signal region, a corresponding control region (CRz) with two SFOS leptons is defined, with an invariant mass of the lepton pair close the
𝑍boson mass: the kinematic properties of the events populating such a control region are expected to be very similar to those of events in the signal region. The full definition of the control region selection needs to take into account the lower branching ratio of
𝑍 →ℓℓrelative to
𝑍 →𝜈𝜈¯ : the selection is therefore close, but not identical, to that of the signal region. After having rejected events with high
𝐸missT
values to suppress contributions from dileptonic
𝑡𝑡¯ production, the
𝑝Tof the leptons is added vectorially to the
pmissT
to mimic the expected missing transverse momentum
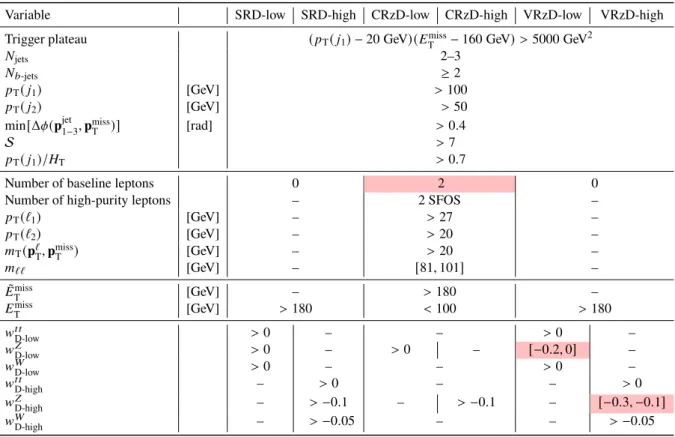
Table 5: SRD signal, control and validation region definitions. Pink cells for the control and validation regions’
columns indicate which selections ensure that they are orthogonal to the corresponding SR.
Variable SRD-low SRD-high CRzD-low CRzD-high VRzD-low VRzD-high
Trigger plateau (𝑝
T(𝑗
1) −20 GeV) (𝐸miss
T −160 GeV)>5000 GeV2
𝑁jets 2–3
𝑁𝑏
-jets ≥2
𝑝T(𝑗
1) [GeV] >100
𝑝T(𝑗
2) [GeV] >50
min[Δ𝜙(pjet
1−3,pmiss
T )] [rad] >0.4
S >7
𝑝T(𝑗
1)/𝐻
T >0.7
Number of baseline leptons 0 2 0
Number of high-purity leptons – 2 SFOS –
𝑝T(ℓ
1) [GeV] – >27 –
𝑝T(ℓ
2) [GeV] – >20 –
𝑚T(pℓ
T,pmiss
T ) [GeV] – >20 –
𝑚ℓ ℓ [GeV] – [81,101] –
˜ 𝐸miss
T [GeV] – >180 –
𝐸miss
T [GeV] >180 <100 >180
𝑤𝑡 𝑡
D-low >0 – – >0 –
𝑤𝑍
D-low >0 – >0 – [−0.2,0] –
𝑤𝑊
D-low
>0 – – >0 –
𝑤𝑡 𝑡
D-high – >0 – – >0
𝑤𝑍
D-high – >−0.1 – >−0.1 – [−0.3,−0.1]
𝑤𝑊
D-high – >−0.05 – – >−0.05
spectrum of
𝑍 →𝜈𝜈¯ events, and is denoted in the following by ˜
𝐸missT
. All variables constructed from
𝐸miss Tare recomputed using ˜
𝐸missT
instead, including the BDT scores used in regions B and D. The selections corresponding to the control regions associated with SRA and SRB, named CRzA and CRzB, are shown in Tables 2 and 3, respectively. Those corresponding to the control regions associated with SRD-low and SRD-high, named CRzD-low and CRzD-high, are shown in Table 5. In the case of SRC, one
𝑍+ jets control region is defined for each of SRC-2b, SRC-1b1v and SRC-0b1v: they are named CRzC-2b, CRzC-1b1v and CRzC-0b1v respectively, and their selection is shown in Table 6.
The production of
𝑊+ jets and, to a lesser extent, top quarks, also results in important backgrounds in SRC.
A set of control regions (CRt and CRw) is defined, all containing exactly one high-purity lepton in the final state. The zero-lepton signals considered for the signal region optimisation do not contaminate the one-lepton control regions. However, potential signal contributions from possible related BSM signal production (e.g. top squark pairs) or from third-generation leptoquarks are rejected by imposing an upper bound on the transverse mass of the lepton and the missing transverse momentum,
𝑚T(pℓ
T,pmiss
T )
. A common top control region containing two
𝑏-tagged jets and no TC-LVT vertex, named CRtC, and two
𝑊+ jets control regions containing at least one TC-LVT vertex and, respectively, one (CRwC-1b1v) and no (CRwC-0b1v)
𝑏-tagged jets are defined and summarised in Table 6. The definition of a
𝑊+ jets control region containing two
𝑏-tagged jets was considered, but it was found too difficult to obtain a satisfactory
𝑊+ jets purity because of contamination from top quark production.
Finally, a series of validation regions is defined, with the purpose of evaluating the quality of the background
Table 6: SRC control region definitions. Pink cells for the control regions’ columns indicate which selections ensure that they are orthogonal to the corresponding SR.
Variable CRtC CRwC-1b1v CRwC-0b1v CRzC-2b CRzC-1b1v CRzC-0b1v
𝑗1not𝑏-tagged 3
Number of high-purity leptons 1 2 SFOS
𝐻T;3 [GeV] <80
𝑝T(𝑗
1) [GeV] >400 >300 >400
𝑚T(pℓ
T,pmiss
T ) [GeV] [20,120] −
𝑚ℓ ℓ [GeV] − [81,101]
𝐸miss
T [GeV] >400 <100
˜ 𝐸miss
T [GeV] − >250 >400
A >0.5 >0.8 − >0.5 >0.8 −
𝑚𝑗 𝑗 [GeV] >250 >250 − − >250 −
𝑁𝑏
-jets ≥2 1 0 ≥2 1 0
𝑁vtx − ≥1 ≥1 − ≥1 ≥1
𝑚vtx [GeV] − >0.6 >1.5 − >0.6 >1.5
𝑝vtx
T [GeV] − >3 >5 − >3 >5
estimation after the likelihood fit. They are characterised by an expected signal contamination below 10%, and they are obtained by inverting one or more signal region variable selections. They are defined in Tables 2, 3, 4 and 5
6 Systematic uncertainties
The effects of several sources of systematic uncertainty on the signal and background estimates are introduced in the likelihood fit through nuisance parameters that affect the expectation values of the Poissonian terms for each CR and SR bin. Each nuisance parameter’s probability density function is described by a Gaussian distribution whose standard deviation corresponds to a specific experimental or theoretical modelling uncertainty. The preferred value of each nuisance parameter is determined as part of the likelihood fit. The fits performed do not significantly alter or constrain the nuisance parameter values relative to the fit input.
Jet energy scale and resolution uncertainties are derived as a function of the jet
𝑝T
and
𝜂, jet flavour, and pile-up conditions, using a combination of data and simulated events through measurements of jet response asymmetry for several processes, as detailed in Refs. [123, 124]. The impact of uncertainties on the efficiencies and mis-tag rates of the
𝑏-tagging algorithm is estimated by varying, as a function of
𝑝T
,
𝜂and jet flavour, the scale factors used to correct the MC simulation, within a range reflecting the uncertainty in their measurement [104]. Similarly, the impact of the uncertainty on the MC modelling of the efficiency and fake rate for the TC-LVT vertex reconstruction is estimated by varying the corresponding scale factors within the uncertainty associated with their determination (about 6% for the efficiency and 30% for the fake rate). Uncertainties connected with the lepton reconstruction and identification are included in the fit, and they are found to have a negligible impact. All uncertainties in the final-state object reconstruction are propagated to the reconstruction of the
𝐸missT
, including an additional one taking into account uncertainties
in the scale and resolution of the soft term.
Uncertainties in the modelling of the SM background processes from MC simulation are taken into account.
They are assumed to be fully correlated across signal regions, but uncorrelated between different processes.
An alternative correlation model, where the uncertainties are assumed to be uncorrelated across signal regions, leads to a small increase in the final yield uncertainty, but to no significant change in the mass and cross-section limits obtained.
Several contributions to the uncertainty in the theoretical modelling of
𝑡𝑡¯ and single top production are considered. The uncertainty due the choice of hard-scattering generator and matching scheme is evaluated by comparing the nominal sample with a sample generated with MadGraph5_aMC@NLO and a shower starting scale
𝜇q=𝐻gen
T /
2. The uncertainty due to the choice of parton shower and hadronisation model is evaluated by a comparison with a sample generated with Powheg-Box interfaced to Herwig 7 [125, 126], using the H7UE set of tuned parameters [126]. Variations of the renormalisation and factorisation scales, the initial- and final-state radiation parameters and PDF sets are also considered [127]. Uncertainties on the interference between the single top
𝑊 𝑡and
𝑡𝑡¯ production have negligible impact on the analysis results and are not included.
Uncertainties in the modelling of
𝑍+ jets and
𝑊+ jets [128] are evaluated by using 7-point variations of the renormalisation and factorisation scales by factors of 0.5 and 2. The matching scale between the matrix element and parton shower calculation, and the resummation scale for soft gluon emission, are also varied by factors of 0.5 and 2. As no Monte Carlo generator has been found to accurately describe
𝑍+𝑏𝑏¯ production in all observables [129], nor are these discrepancies accounted for by scale variations, an uncertainty due to the choice of generator is evaluated by comparing the nominal samples with those produced using aMC@NLO 2.3.3 + Pythia. After constraints from the control regions these variations are found to be relevant only in SRD, where modelling uncertainties dominate the systematic effect on the shape of the cos
𝜃∗𝑏 𝑏