EUROPEAN ORGANISATION FOR NUCLEAR RESEARCH (CERN)
Submitted to: Phys. Rev. C. 104 (2021) 014903 DOI:10.1103/PhysRevC.104.014903
CERN-EP-2020-246 20th July 2021
Two-particle azimuthal correlations in
photonuclear ultraperipheral Pb+Pb collisions at 5.02 TeV with ATLAS
The ATLAS Collaboration
Two-particle long-range azimuthal correlations are measured in photonuclear collisions using 1.7 nb−1of 5.02 TeV Pb+Pb collision data collected by the ATLAS experiment at the LHC.
Candidate events are selected using a dedicated high-multiplicity photonuclear event trigger, a combination of information from the zero-degree calorimeters and forward calorimeters, and from pseudorapidity gaps constructed using calorimeter energy clusters and charged- particle tracks. Distributions of event properties are compared between data and Monte Carlo simulations of photonuclear processes. Two-particle correlation functions are formed using charged-particle tracks in the selected events, and a template-fitting method is employed to subtract the non-flow contribution to the correlation. Significant nonzero values of the second- and third-order flow coefficients are observed and presented as a function of charged-particle multiplicity and transverse momentum. The results are compared with flow coefficients obtained in proton–proton and proton–lead collisions in similar multiplicity ranges, and with theoretical expectations. The unique initial conditions present in this measurement provide a new way to probe the origin of the collective signatures previously observed only in hadronic collisions.
©2021 CERN for the benefit of the ATLAS Collaboration.
Reproduction of this article or parts of it is allowed as specified in the CC-BY-4.0 license.
arXiv:2101.10771v2 [nucl-ex] 19 Jul 2021
Contents
1 Introduction 2
2 ATLAS detector and data sample 4
3 Monte Carlo simulation 5
4 Photonuclear event selection 6
4.1 Reconstruction and event selection 6
4.2 Event properties 8
5 Two-particle correlations 11
5.1 Non-flow subtraction 13
5.2 Factorization test 15
5.3 Physics backgrounds 19
6 Systematic uncertainties 19
7 Results and discussion 22
8 Conclusion 25
1 Introduction
In ultrarelativistic collisions of lead nuclei at the Large Hadron Collider (LHC), the typical processes studied are those for which the nuclei have an impact parameter less than twice their radius (𝑏 . 2𝑅𝐴).
Such lead–lead (Pb+Pb) collisions are understood to create a quark–gluon plasma and result in a large number of particles in the final state which participate in collective motion as a consequence of the plasma evolution [1–3]. In addition to the particles produced in Pb+Pb collisions, those produced in high-energy proton–proton (𝑝 𝑝) and proton–lead (𝑝+Pb) collisions also exhibit a collective behavior which manifests as an event-wide azimuthal variation persisting broadly in pseudorapidity, initially observed as a ‘ridge’ [4–7].
This behavior is characterized in terms of nonzero single-particle azimuthal anisotropies, given by𝑛th-order Fourier coefficients, and here referred to as flow coefficients𝑣𝑛. Nonzero𝑣𝑛values have also been observed in significantly lower-energy (19.6–200 GeV)𝑑+Au collisions at the Relativistic Heavy Ion Collider [8]. A natural question is whether such signatures persist in even smaller collision systems [9] and, if so, how this may influence the interpretation of these signatures in𝑝 𝑝or𝑝+Pb collisions.
In the prevailing paradigm, these observed anisotropies arise from the creation of a miniature region of quark–gluon plasma [10,11], in which a hydrodynamic-like expansion of the system converts spatial nonuniformities in the initial state of the system into momentum-space anisotropies of the final-state particles. However, momentum correlations already present in the initial state of the collision may also persist into the final state [12]. The relative importance of these two explanations can be tested in collision systems where one or both of the ‘beams’ has a significantly simpler initial state. Recently, studies were performed in archived𝑒+𝑒−collision data at
√
𝑠 =91 GeV from the ALEPH detector [13] and in archived 𝑒 𝑝collision data at
√
𝑠=316 GeV from the ZEUS detector [14] with a deep-inelastic-scattering selection
Nucleus intact No neutrons
Nucleus breaks up Multiple neutrons
Rapidity gap
No rapidity gap
Nucleus intact No neutrons
Nucleus breaks up Multiple neutrons Gap partially
filled
No rapidity gap
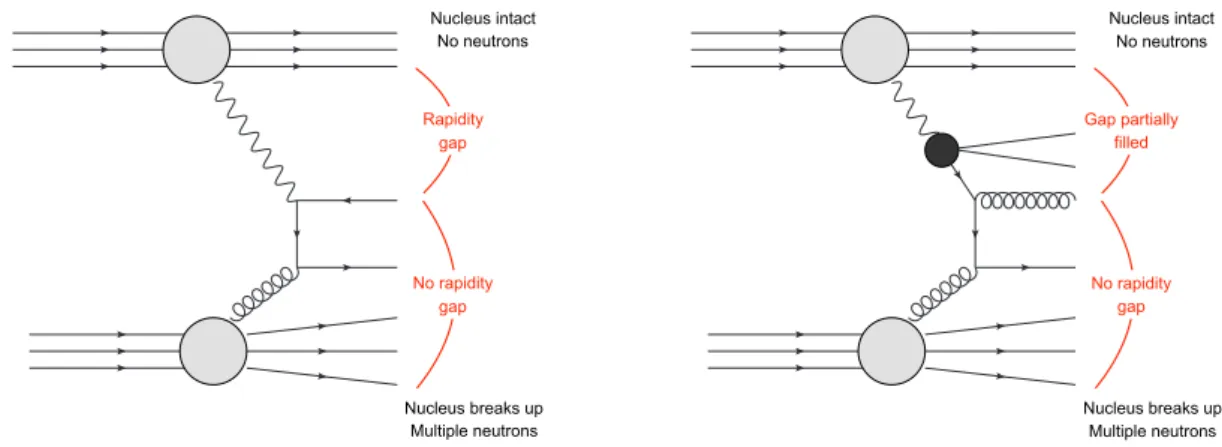
Figure 1: Diagrams representing different types of photonuclear collisions and the general features of their event topologies.Left:the direct process, in which the photon itself interacts with the nucleus.Right: the resolved process, in which the photon fluctuates into a hadronic state.
𝑄2 >1 GeV2. A ridge signature was not observed, and experimental upper limits were set on the possible magnitude of𝑣𝑛coefficients.
In addition to the hadronic Pb+Pb interactions described above, the strong electromagnetic (EM) fields of the fully ionized nuclei can induce interactions even when the nuclei have significantly larger impact parameters such that no hadronic interaction occurs (𝑏 & 2𝑅𝐴). In the equivalent photon approximation [15–17], these strong EM fields correspond to a flux of quasi-real, high-energy photons. These photons can be emitted coherently from the entire nucleus, producing a flux enhanced by a factor of𝑍2(𝑍 =82 for Pb) for photons up to 80 GeV at the LHC. These ultraperipheral collisions (UPC) [18,19] have appreciable rates and include photon–photon (𝛾 𝛾) and photonuclear (𝛾+A) interactions.
At the LHC, previous measurements of ultraperipheral processes in Pb+Pb collisions include light-by-light scattering (𝛾 𝛾 →𝛾 𝛾) [20–23], exclusive dilepton production (𝛾 𝛾→𝑒+𝑒−and𝛾 𝛾 →𝜇+𝜇−) [24–26], and the photonuclear production of various meson states (𝛾+A→ℎ+𝑋) [26–28]. In the photonuclear case, the photon may act as a point-like particle interacting with a parton in the nucleus (the ‘direct’ case). However, the vector-meson dominance picture [18,29] suggests that the photon often fluctuates into a vector-meson state such as a 𝜌 or𝜔 (the ‘resolved’ case). In this case, the interaction proceeds as a meson–nucleus collision at an energy lower than that of the associated nucleon–nucleon collision. Figure1illustrates the direct and resolved photonuclear interactions. The photon–nucleon collision energy and the boost of the center-of-mass relative to the nucleus–nucleus rest frame depends on the photon energy and thus varies event to event. For photons with energies at the upper boundary of the coherence region,𝐸 =80 GeV, the resulting photon–nucleon center-of-mass energy is approximately 900 GeV. Thus photonuclear collisions may be used to probe the dynamics of a system with a novel energy and geometry compared to𝑝 𝑝or 𝑝+A collisions at the LHC, and to𝑒+𝑒−or𝑒 𝑝collisions at LEP and HERA. Since photonuclear events are the photoproduction limit of deep inelastic scattering on nuclei, these measurements may also shed light on possible collective signatures at the future Electron Ion Collider [30,31].
This paper presents a measurement of azimuthal anisotropies obtained via two-particle correlations in photonuclear collisions, where such analyses have not previously been undertaken. The data were recorded using a trigger designed to select minimum-bias and high-multiplicity photonuclear events in 1.7 nb−1of Pb+Pb collisions at 5.02 TeV per nucleon pair delivered by the LHC in 2018. Photonuclear event candidates
are selected, and are distinguished from peripheral hadronic Pb+Pb events and other background events, using the topology of the distribution of particles in the event as measured in the zero-degree, forward, and barrel calorimeters, as well as the tracking systems through the reconstruction of pseudorapidity gaps [32,33]. Properties of the selected events are compared with the expectations from Monte Carlo (MC) simulations of photonuclear processes.
Two-particle correlations as a function of relative separation in azimuth (Δ𝜙) and pseudorapidity1(Δ𝜂) are constructed for different selections of event charged-particle multiplicity and charged-particle kinematics.
The non-flow contributions to the two-particle correlations (for example, jet correlations which give rise to aΔ𝜙correlation structure) are suppressed by studying the correlations at largeΔ𝜂, and the residual non-flow contribution is subtracted via the template-fitting method used extensively in prior ATLAS measurements [4,5,34]. In the template method, the correlation in high-multiplicity events is described as a combination of the correlation in lower-multiplicity events plus a component modulated by cos(2Δ𝜙) (and higher order) Fourier terms. The template method makes particular assumptions about how the non-flow component evolves with multiplicity. Although there are differences between the system explored in this measurement and those in previous two-particle correlation measurements, the sensitivity to the assumptions of the template method can be tested within the standard approach. A test of the template method in simulated photonuclear events which do not include flow or initial-state correlation mechanisms is performed in Section7. The resulting magnitudes of the two-particle correlations are interpreted as arising from the product of global𝑣
2and𝑣
3values for individual particles, and are reported as a function of the reconstructed charged-particle multiplicity (𝑁rec
ch ) and transverse momentum (𝑝
T). The results are compared with other small collision systems at the LHC, and theoretical expectations from initial- and final-state physics mechanisms are discussed.
2 ATLAS detector and data sample
The ATLAS detector [35] covers nearly the entire solid angle around the collision point. The detector systems used for the measurements presented in this paper include the inner tracking detector, the electromagnetic (EM) and hadronic calorimeters, the zero-degree calorimeter (ZDC), and the trigger and data acquisition systems. The detector halves at positive and negative𝑧-values are referred to as the A and C sides, respectively.
The inner-detector system is immersed in a 2 T axial magnetic field and provides charged-particle tracking in the range|𝜂|< 2.5. The high-granularity silicon pixel detector covers the vertex region and typically provides four measurements per track. The innermost layer, the insertable B-layer [36–38], has been operating as a part of the silicon pixel detector since 2015.
The pixel detector is followed by the silicon microstrip tracker (SCT) which usually provides four measurement points per track. These silicon detectors are complemented by the transition radiation tracker, which enables radially extended track reconstruction up to|𝜂|=2.0.
The calorimeter system covers the pseudorapidity range |𝜂| < 4.9. Within the region |𝜂| < 3.2, electromagnetic calorimetry is provided by barrel and endcap high-granularity lead/liquid-argon (LAr)
1ATLAS uses a right-handed coordinate system with its origin at the nominal interaction point (IP) in the center of the detector and the𝑧-axis along the beam pipe. The𝑥-axis points from the IP to the center of the LHC ring, and the𝑦-axis points upwards. Cylindrical coordinates(𝑟 , 𝜙)are used in the transverse plane,𝜙being the azimuthal angle around the𝑧-axis. The pseudorapidity is defined in terms of the polar angle𝜃as𝜂=−ln tan(𝜃/2).
calorimeters, with an additional thin LAr presampler covering |𝜂| < 1.8. Hadronic calorimetry is provided by a steel/scintillator-tile calorimeter, segmented into three barrel structures within|𝜂| < 1.7, and two copper/LAr hadronic endcap calorimeters. The solid angle coverage is extended with the forward calorimeter (FCal), composed of copper/LAr and tungsten/LAr modules optimized for EM and hadronic measurements, respectively. The FCal detectors cover the regions 3.2< |𝜂|< 4.9.
The minimum-bias trigger scintillator (MBTS) detects charged particles over 2.07< |𝜂| < 3.86 using two hodoscopes of 12 counters positioned at𝑧 =±3.6 m. The ZDC consists of EM and hadronic sections and plays a key role in identifying UPC events in heavy-ion collisions by primarily detecting neutrons resulting from the breakup of one or both nuclei. The ZDC modules are located at𝑧=±140 m from the IP. They measure neutral particles at pseudorapidities|𝜂| ≥8.3 and consist of layers of alternating quartz rods and tungsten plates.
A two-level trigger system [39] is used to select events. The first-level trigger (L1) is implemented in hardware and uses a subset of the detector information to restrict the accepted rate to at most 100 kHz.
This is followed by a software-based high-level trigger (HLT) stage that reduces the accepted event rate to 1–4 kHz depending on the data-taking conditions during 2018 Pb+Pb operations.
The measurements presented in this paper were performed using the√
𝑠NN =5.02 TeV Pb+Pb dataset collected with a variety of triggers in 2018, with a total integrated luminosity of 1.7 nb−1. Photonuclear candidate events were first selected by the trigger by requiring one ZDC side (referred to as the Pb-going side) to have a minimum amount of energy at L1,𝐸 >1 TeV, consistent with the presence of one or more neutrons. The other side (referred to as the photon-going side) was required to have an energy below a maximum-energy cutoff,𝐸 <1 TeV, consistent with no neutrons. The cut value of𝐸 =1 TeV is several multiples of the energy resolution away from the single-neutron peak at𝐸 =2.5 TeV [24]. Thus, the selected topology is referred to as “0nXn” in the figures in this paper. Events were also required to satisfy an upper bound of 200 GeV on the total transverse energy deposited in the calorimeter at L1, for further rejection of hadronic Pb+Pb events.
After these requirements at L1, events had to pass either a minimum-bias (MB) trigger or one of several high-multiplicity triggers (HMT) with further requirements at the HLT stage. The MB trigger was defined by requiring at least one reconstructed online track with 𝑝
T > 0.4 GeV. The HMTs were defined by requiring a larger number of tracks originating from the same vertex. The primary vertex, defined as the one with the largest scalar sum of𝑝2
Tvalues of associated tracks, was used. An HMT with a threshold of 15 tracks was defined by also requiring a hit in the MBTS at L1. Two HMTs with thresholds of 25 and 35 tracks were defined by requiring a minimum amount of energy in the calorimeter at L1. Finally, all HMTs had an additional HLT requirement of less than 5 GeV of transverse energy in the photon-going FCal, which rejected a large fraction of the 0nXn peripheral Pb+Pb background events. The 35-track HMT sampled the full luminosity of 1.7 nb−1during data-taking. The 25-track HMT, 15-track HMT, and the MB trigger were configured with increasingly larger prescale factors, sampling 1.6 nb−1, 0.13 nb−1, and 1.0𝜇b−1of data respectively.
3 Monte Carlo simulation
Monte Carlo (MC) simulations of the relevant physics processes were used to understand the performance of the detector, and provide distributions to be compared with the data. For all the generators and
configurations listed below, the simulated events were passed through a Geant4 simulation [40,41] of the detector and reconstructed under the same conditions as the data.
A sample of one million peripheral Pb+Pb events was generated using Hijing v1.383 [42] with impact parameters in the range 10< 𝑏 <20 fm. These events were used to determine the charged-particle tracking efficiencies for the measurement, and to model the event properties of low-multiplicity, hadronic Pb+Pb events.
Several generators were used to simulate photonuclear interactions. For each of the cases below, events were generated with different minimum requirements on𝑁rec
ch to provide good statistical coverage over the𝑁rec
ch range accessed in data. First, the distribution of photon flux for208Pb beams at the LHC was calculated using STARlight [43]. The flux distribution was passed to a multipurpose generator based on the Dual Parton Model (DPM) and referred to as DPMJET-III [44,45], which simulated direct and resolved photon–lead (𝛾+Pb) interactions at the generator level, followed by a full Geant4 simulation of the ATLAS detector. Thirteen million𝛾+Pb events were simulated in this way. Additionally, the flux from STARlight was used to simulate two million𝛾+𝑝events using DPMJET-III, where the energy of the proton was set equal to the energy per nucleon in the Pb beams. Finally, for an alternative description of these processes, Pythia 8.240 [46] configured with the NNPDF23LO parton distribution functions [47]
and A14 set of tuned parameters [48] was used to generate twelve million𝛾+𝑝events. The photon flux in Pythia was reweighted at the event level to match that calculated by STARlight, and the simulation was configured to include both the direct and resolved photon interactions.
4 Photonuclear event selection
4.1 Reconstruction and event selection
Given the low particle multiplicities of UPC events, the charged-particle track and calorimeter energy- cluster reconstruction procedures follow those optimized for 𝑝 𝑝 data-taking [49, 50]. Reconstructed charged-particle tracks are used in the analysis if they satisfy quality criteria as outlined in Ref. [51]. These include criteria for the minimum number of hits in the pixel and SCT detectors. Tracks are further required to have𝑝
T > 0.4 GeV,|𝜂| < 2.5, and distances of closest approach to the primary reconstructed vertex in the longitudinal and transverse directions of less than 1.5 mm each. Clusters in the range|𝜂| < 4.9 are constructed from topologically connected groups of calorimeter cells [52]. They are required to have 𝑝T > 0.2 GeV and to meet the significance criteria for the measured energy as outlined in Ref. [32] to suppress the contribution from electronic noise fluctuations.
Events are required to have a reconstructed primary vertex within |𝑧| < 90 mm. Events compatible with multiple in-time interactions are tagged by the presence of multiple reconstructed vertices. These comprise less than 1% of the sample and are rejected. Events must pass a version of the ZDC-based energy selection described in Section2which uses the same threshold but an improved calibration for the ZDC energies determined after data-taking. Events are further characterized by their charged-particle multiplicity,𝑁rec
ch, which is defined as in previous ATLAS measurements of correlations in small systems [4, 5,7] as the total number of reconstructed tracks, without efficiency correction, with 𝑝
T >0.4 GeV and
|𝜂| < 2.5. For the correlation analysis described in Section5, events with a given𝑁rec
ch were included in the analysis if they were selected by any of the HMTs which was more than 80% efficient for events with this 𝑁rec
ch value. For the study of event properties in Section4.2, each𝑁rec
ch range was only populated by the
1 10 102
103
104
105
0 1 2 3 4 5
η
γ∆ Σ 20
40 60 80 100 120
rec Nch140 ATLAS
Pb+Pb, 1.0 µb-1 = 5.02 TeV, 0nXn sNN
MB trigger
102
103
104
0 1 2 3 4 5
η
γ∆ Σ 0
1 2 3 4
η∆ΣA 5 ATLAS Pb+Pb, 1.0 µb-1 = 5.02 TeV, 0nXn sNN
10, MB trigger
ch ≥ Nrec
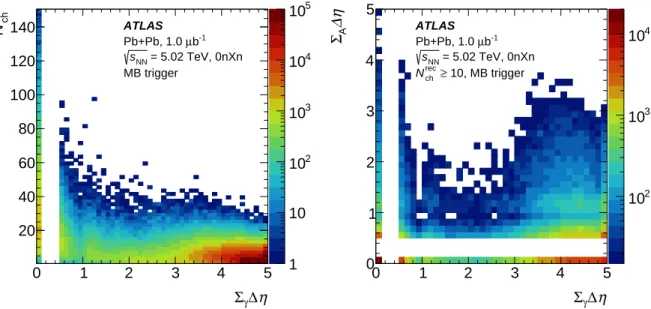
Figure 2: Left: Correlation of𝑁rec
ch andΣ𝛾Δ𝜂for events selected by the MB trigger before application of gap-based event selection. Right: Correlation ofΣ𝛾Δ𝜂andΣ𝐴Δ𝜂for events selected by the MB trigger, with𝑁rec
ch >10.
highest-sampled-luminosity HMT which was more than 99% efficient over the entire𝑁rec
ch range. In either case, events with𝑁rec
ch
< 15 were populated only by the MB trigger.
Reconstructed pseudorapidity gap quantities, constructed using the tracks and clusters in each event, are used to distinguish between different physics processes such as photonuclear collisions, low-activity (peripheral) hadronic Pb+Pb collisions, and𝛾 𝛾→𝑋 processes. The requirement of a rapidity gap above a minimum value in the photon-going direction can efficiently remove peripheral Pb+Pb events. Rather than the traditional pseudorapidity gap quantity [32], which determines the pseudorapidity difference between the edge of the detector and closest particle, an alternative ‘sum-of-gaps’ definition is used, which adds together contiguous gaps separated by particle production concentrated in a narrow pseudorapidity regions.
This alternative definition is used to retain a large selection efficiency for resolved photon events which may break up a large gap with a hadronic fragment localized in pseudorapidity (see Figure1). The quantities Σ𝛾Δ𝜂andΣ𝐴Δ𝜂correspond to the sum-of-gaps calculated in the photon-going and nucleus-going halves of the detector, respectively. They are calculated by first sorting the tracks and clusters in𝜂. The differences in𝜂between adjacent particles,Δ𝜂, are included in the sum if they are larger than 0.5. The value of 0.5 was observed in simulation to retain good efficiency for resolved photon events. The position at𝜂=0 is treated as if it were a particle which ends the sum-of-gaps calculation. Thus,Σ𝛾Δ𝜂andΣ𝐴Δ𝜂range from 0 to 4.9.
In addition to the sum-of-gaps quantities defined above, the traditional edge gap quantity, constructed using clusters,Δ𝜂cluster
edge , is defined as the pseudorapidity difference between the edge of the detector on the photon-going side, at𝜂 =+4.9, and the first reconstructed cluster. In the mixed-event construction discussed in Section5, events are classified by theirΔ𝜂cluster
edge as a way to characterize their overall topology without using charged-particle tracks.
0 20 40 60 80 100
rec
Nch
1 10 102
103
104
105
Events
- 1.7 nb-1
106 ATLAS
-1 µb Pb+Pb, 1.0
= 5.02 TeV, 0nXn sNN
> 2.5 η
γ∆ Σ
0 20 40 60 80 100 120
rec
Nch
−10
10
−9
10
−8
10
−7
10
−6
10
−5
10
−4
10
−3
10
−2
10
−1
10 1 )rec chN/devtN) (devtN(1/
ATLAS
- 1.7 nb-1
b-1
µ Pb+Pb, 1.0
= 5.02 TeV, 0nXn sNN
> 2.5 η
γ∆ Σ
< 1 η
γ∆ Σ
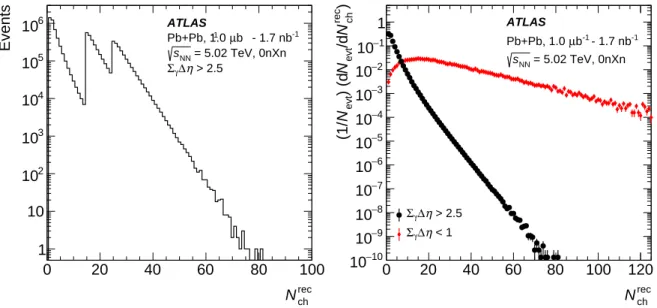
Figure 3: Left: Distribution of event charged-particle multiplicity,𝑁rec
ch, for the photonuclear event selection from multiple triggers, without prescale correction. Right: Distribution of event charged-particle multiplicity,𝑁rec
ch, for the photonuclear event selection (black) with corrections for trigger efficiency and prescale factors, and an alternative selection intended to select hadronic Pb+Pb events (red, see text).
4.2 Event properties
Figure2(left) shows the distribution ofΣ𝛾Δ𝜂and𝑁rec
ch values for events recorded with the MB trigger. The Σ𝛾Δ𝜂can have a value of zero or fall into the range 0.5≤Σ𝛾Δ𝜂 ≤4.9, with the lower value determined by the minimum gap size included in the sum. Events resulting from hadronic Pb+Pb collisions are at small Σ𝛾Δ𝜂and have a broad multiplicity distribution, whereas events from photon-induced processes are at largeΣ𝛾Δ𝜂and have an𝑁rec
ch distribution that falls steeply. Figure2(right) shows the distribution ofΣ𝛾Δ𝜂 andΣ𝐴Δ𝜂values. Most hadronic Pb+Pb collisions have a broad pseudorapidity distribution of particles and hence have both smallΣ𝛾Δ𝜂and smallΣ𝐴Δ𝜂. In contrast, the photonuclear events have largeΣ𝛾Δ𝜂 but smaller values ofΣ𝐴Δ𝜂. There is no significant yield of events with a large sum-of-gaps on both sides, which could signal the presence of photon–photon hadronic process backgrounds. The signal events for photonuclear collisions are defined byΣ𝛾Δ𝜂> 2.5. No event selection is made onΣ𝐴Δ𝜂.
Figure3 summarizes the multiplicity distribution observed in data after the event selection described above. The𝑁rec
ch distribution for events passing the photonuclear event selection is shown in the left panel of Figure3. The sawtooth pattern arises from the inclusion of the HMTs at different𝑁rec
ch thresholds as described above. In each𝑁rec
ch range, the selected photonuclear events have a steeply falling multiplicity distribution. The𝑁rec
ch distribution for photonuclear events, fully corrected for the different luminosities sampled by the triggers and the𝑁rec
ch -dependent trigger efficiency, is shown using black circles in the right panel of Figure3. It is compared with the distribution from events withΣ𝛾Δ𝜂 <1, which mostly selects Pb+Pb hadronic events, which are backgrounds in this analysis. The selected photonuclear events have a significantly more steeply falling multiplicity distribution.
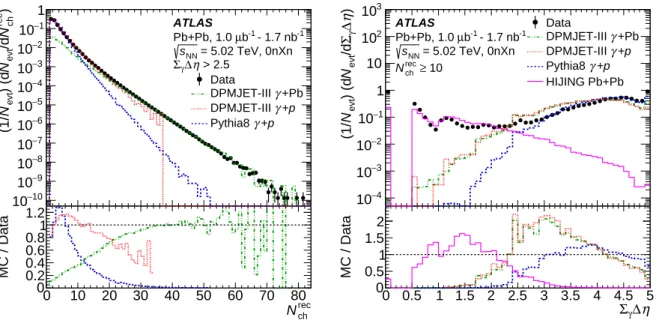
Figure4compares the multiplicity and sum-of-gap distributions in data and simulation. The left panel of Figure4shows the total𝑁rec
ch distribution, corrected for the trigger efficiency and the different integrated luminosities sampled by the HMTs. This is compared with three distributions from MC generators, with
0 10 20 30 40 50 60 70 80
rec
Nch
0.20 0.40.6 0.81 1.2
MC / Data
0 10 20 30 40 50 60 70 80
rec
Nch
−10
10
−9
10
−8
10
−7
10
−6
10
−5
10
−4
10
−3
10
−2
10
−1
10
rec )N/dN) (dN(1/evtevtch 1
ATLAS
- 1.7 nb-1
b-1
µ Pb+Pb, 1.0
= 5.02 TeV, 0nXn sNN
> 2.5 η
γ∆ Σ
Data
γ+Pb DPMJET-III
γ+p DPMJET-III
γ+p Pythia8
0 0.5 1 1.5 2 2.5 3 3.5 4 4.5 5 η
γ∆ Σ 0
0.5 1 1.5
2
MC / Data
0 0.5 1 1.5 2 2.5 3 3.5 4 4.5 5
η
γ∆ Σ
−4
10
−3
10
−2
10
−1
10 1 10 102
103
)η∆γΣ/devtN) (devtN(1/
ATLAS
- 1.7 nb-1
b-1
µ Pb+Pb, 1.0
= 5.02 TeV, 0nXn sNN
≥ 10
rec
Nch
Data
γ+Pb DPMJET-III
γ+p DPMJET-III
γ+p Pythia8 HIJING Pb+Pb
Figure 4: Left: 𝑁rec
ch distribution in data, corrected for trigger and reconstruction efficiency and normalized per event (black points), compared with that in DPMJET-III𝛾+Pb (dot-dashed green histogram), DPMJET-III𝛾+𝑝 (dotted red histogram), and Pythia𝛾+𝑝(dashed blue histogram). The bottom panel shows the ratios of the MC distributions to the data distributions. Right: Σ𝛾Δ𝜂distribution in data for𝑁rec
ch ≥10 (black points), normalized per event, and compared with that in DPMJET-III𝛾+Pb (dot-dashed green histogram), Pythia𝛾+𝑝(dashed blue histogram), peripheral Hijing Pb+Pb (solid magenta histogram), and DPMJET-III𝛾+𝑝(dotted red histogram).
the same gap-based selection requirements as the data. The ZDC selection is applied to data but not to the MC samples as the generators do not model the nuclear-breakup processes relevant for forward neutron spectators. Including a ZDC requirement in MC events may thus impact the distributions if particle production in the detector is correlated with the nuclear fragmentation in the forward region. Despite the limitations in the modeling of forward neutrons, a generator-level check requiring neutrons in the ZDC acceptance was performed and found not to impact the level of agreement between data and DPMJET-III.
The distributions in Pythia and DPMJET-III𝛾+𝑝are normalized to have the same integral as the data over the full𝑁rec
ch range. The models show good agreement with the data at low𝑁rec
ch, but systematically predict too low a relative yield at higher𝑁rec
ch. DPMJET-III𝛾+Pb does not describe the full distribution, but has been normalized to have the same integral as the data in𝑁rec
ch
> 35 to highlight its good agreement in this region over many orders of magnitude. With this normalization, DPMJET-III𝛾+Pb systematically predicts too low a relative yield for𝑁rec
ch
< 15. This comparison either suggests the presence of other, non-photonuclear, processes in data at such low𝑁rec
ch
< 10 values, or points to the need for improved modeling of this region in the simulation.
The right panel of Figure4shows the reconstructedΣ𝛾Δ𝜂distributions in data and simulation for selected events with𝑁rec
ch
> 10, without theΣ𝛾Δ𝜂 >2.5 requirement. Structures in the distributions correspond to transitions between detector subsystems and the change in the detector response as a function of𝜂. At largeΣ𝛾Δ𝜂values≥2.5, the shape of the distribution in data is qualitatively similar to that in DPMJET-III 𝛾+Pb and Pythia𝛾+𝑝simulation. However, the distributions in the simulated photonuclear events decrease at smallerΣ𝛾Δ𝜂values, while the distribution in data rises. At lowΣ𝛾Δ𝜂, the shape in data is qualitatively similar to that in peripheral Hijing Pb+Pb events. This comparison suggests that the trigger-selected events contain a mixture of peripheral Pb+Pb events and genuine photonuclear events, with the latter dominant
−2 −1 0 1 2 η 0
0.1 0.2 0.3 0.4 0.5 0.6 0.7 )η/dchN) (dchN(1/
ATLAS
- 1.7 nb-1
b-1
µ Pb+Pb, 1.0
= 5.02 TeV, 0nXn sNN
> 2.5 η
γ∆ Σ
< 5.0 GeV pT
0.4 <
≤ 5
rec
Nch
1 <
≤ 9
rec
Nch
5 <
≤ 14
rec
Nch
9 <
≤ 20
rec
Nch
14 <
≤ 25
rec
Nch
20 <
≤ 30
rec
Nch
25 <
≤ 37
rec
Nch
30 <
≤ 60
rec
Nch
37 <
2.5 −2 −1.5 −1 −0.5 0 0.5 1 1.5 2 2.5
η
1 2 3 4 5 6 7 8 9 )η/dN) (dN(1/evtch 10
ATLAS
- 1.7 nb-1
b-1
µ Pb+Pb, 1.0
= 5.02 TeV, 0nXn sNN
≥ 10
rec
Nch
> 2.5, η
γ∆ Σ
< 5.0 GeV pT
0.4 <
Data
γ+Pb DPMJET-III
γ+p DPMJET-III
γ+p Pythia8 HIJING Pb+Pb
−2.5 −2−1.5 −1−0.5 0 0.5 1 1.5 2 2.5 η 0.5
1 1.5
2 2.5 0
MC / Data
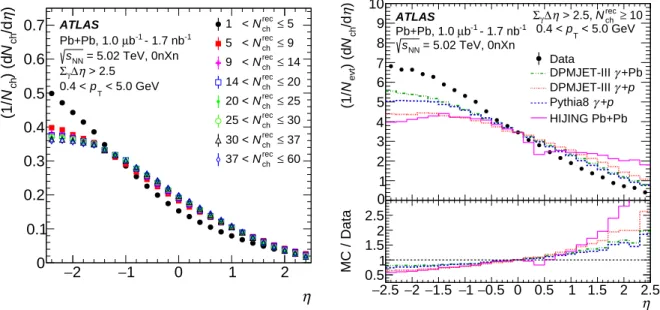
Figure 5: Left: Charged-particle pseudorapidity distribution,𝑑𝑁ch/𝑑 𝜂, in selected𝑁rec
ch ranges. The distributions are normalized to the same integral and are shown in arbitrary units. Here, positive and negative𝜂denote the photon-going and nucleus-going directions, respectively. Right:𝑑𝑁
ch/𝑑 𝜂distribution in data for𝑁rec ch
>10 (black points), normalized per event, and compared with that in DPMJET-III𝛾+Pb (dot-dashed green histogram), Pythia 𝛾+𝑝(dashed blue histogram), peripheral Hijing Pb+Pb (solid magenta histogram), and DPMJET-III𝛾+𝑝(dotted red histogram) with the same reconstruction-level selection as the data. All distributions have been normalized to have the same value as DPMJET-III𝛾+Pb at𝜂=0.
atΣ𝛾Δ𝜂 >2.5. The possible impact of residual peripheral Pb+Pb events in the set of selected events is discussed in Section6.
Figure 5 compares the charged-particle pseudorapidity distribution, 𝑑𝑁
ch/𝑑 𝜂, in data and simulation.
The left panel shows the 𝑑𝑁
ch/𝑑 𝜂 in data, for charged particles with 0.4 < 𝑝
T < 5 GeV, for multiple 𝑁rec
ch selections in photonuclear events. The distributions are corrected for tracking efficiency on a per-track basis, which ranges from 0.7–0.9 depending on track𝜂and𝑝
T. To compare the relative shapes between𝑁rec
ch selections, the distributions are each normalized to have an integral of one. In all cases, the pseudorapidity distributions are strongly asymmetric, peaking at𝜂=−2.5 (the nucleus-going direction) and then monotonically decreasing until𝜂=+2.5 (the photon-going direction). This overall shape is even more asymmetric than that observed in, for example,𝑝+Pb collisions at the LHC [53]. The𝑑𝑁
ch/𝑑 𝜂shape remains similar over a wide range of multiplicities (𝑁rec
ch
> 10). The selection with𝑁rec
ch
< 5 results in an even more strongly asymmetric𝑑𝑁
ch/𝑑 𝜂shape, suggesting that it may include photonuclear events at significantly lower energies or other processes. Additionally, as discussed above, the region𝑁rec
ch
< 10 is not well described by simulation, and may contain a significant contribution from background events.
On the basis of these observations, the two-particle correlation analysis is performed using events with 𝑁rec
ch ≥10. Additionally, an upper bound of𝑁rec
ch =60 is used to remove the region with very few events.
The right panel in Figure5compares the pseudorapidity distribution of particles with 0.4< 𝑝
T < 5 GeV in data for 𝑁ch
rec ≥ 10 with the four sets of simulated events, which have the same reconstruction-level selections as the data. While all three generators considered here systematically fail to predict a steep enough slope for the𝑑𝑁
ch/𝑑 𝜂distribution, the distribution for DPMJET-III𝛾+Pb events is the most similar to that observed in data.
0 10 20 30 40 50 60 70 80
rec
Nch
1 10 102
[GeV]γE
−10
10
−8
10
−6
10
−4
10
−2
10 -1rec2]) [GeVEdN / dN) (dN(1/γch
102
103
[GeV]NγW
Simulation ATLAS
γ+Pb DPMJET-III
> 2.5 η
γ∆ Σ
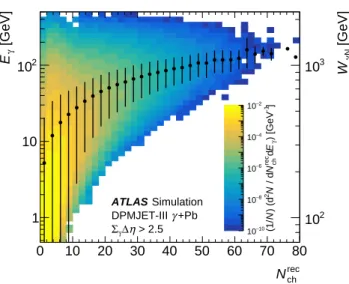
Figure 6: Correlation between photon energy𝐸𝛾 and event multiplicity𝑁rec
ch in simulated DPMJET-III𝛾+Pb events.
The right-hand axis shows the center-of-mass energy𝑊for the photon–nucleon collision system. The markers and vertical errors bars show the mean and standard deviation, respectively, of𝐸𝛾as a function of𝑁rec
ch.
In general, no single generator is able to quantitatively describe in detail all of the features observed in data. The results here may be used to benchmark future developments in the modeling of photonuclear collisions. The two-particle correlation analysis described in Section5, due its data-driven nature, does not rely on a detailed description of photonuclear events in simulation and therefore its results are not sensitive to this mismodeling.
Since the DPMJET-III𝛾+Pb simulation and the data agree qualitatively in the𝑁rec
ch andΣ𝛾Δ𝜂distributions, the simulated events provide an estimate of what ranges of photon energy in the laboratory frame,𝐸𝛾, and photon–nucleon center-of-mass energy,𝑊𝛾
N, are selected for analysis by choosing various𝑁rec
ch orΣ𝛾Δ𝜂 values. These ranges are shown in Figure6as a function of𝑁rec
ch. In DPMJET-III, photonuclear events with a larger𝑁rec
ch have a larger average𝐸𝛾and𝑊𝛾
N. At𝑁rec
ch =10, the mean values are 𝐸𝛾
=26.8 GeV and
𝑊𝛾
N
=519 GeV, rising to 𝐸𝛾
=123 GeV and 𝑊𝛾
N
=1.11 TeV at𝑁rec
ch =60. However, even a narrow range of𝑁rec
ch values selects events with a broad distribution of𝐸𝛾 and𝑊𝛾
N. At lower values of 𝑁rec
ch
< 10, the mean photon energy decreases rapidly and the range of photon energies increases, supporting the data-driven minimum value of𝑁rec
ch determined above.
5 Two-particle correlations
This section describes the two-particle correlation and template fit procedures used to extract the azimuthal anisotropies,𝑣𝑛. These procedures have been used in previous analyses of two-particle correlations in small systems [4,5,34,54,55], and are summarized here.
Correlations between pairs of charged particles are reported as a function of the pair’s relative separation in pseudorapidity,Δ𝜂=𝜂𝑎−𝜂𝑏, and azimuth,Δ𝜙=𝜙𝑎−𝜙𝑏. The labels𝑎and𝑏denote kinematic selections on the first and second particle, which are generally different. If two particles each meet selections𝑎and𝑏, the pair is tabulated twice, once for each possible assignment. By convention, the distributions inΔ𝜂and
Δ𝜙,𝑌(Δ𝜙,Δ𝜂), are averaged over events by normalizing them by the total yield of particles in selection𝑎, 𝑁𝑎,
𝑌(Δ𝜙,Δ𝜂) = 1 𝑁𝑎
𝑑2𝑁
pair
𝑑Δ𝜙·𝑑Δ𝜂 .
To correct for the charged-particle reconstruction efficiency, entries in the distribution are weighted by the product of the inverse efficiencies evaluated for the kinematics of the two particles. These efficiencies are derived from the Hijing simulation described in Section3. In this analysis, all charged-particle tracks within|𝜂|< 2.5 are considered, except the tracks which lie in the region𝜂 >4.9−Σ𝛾Δ𝜂(with positive𝜂 defined as the photon-going direction), if the sum-of-gaps extends into the tracker. There are two reasons to exclude these tracks. First, in simulations of photonuclear events, such particles are typically fragments of resolved photons, and not the bulk particles produced in the𝛾+Pb interaction which are being measured for possible collective signatures. Second, since these tracks are typically near the edge of the inner detector’s acceptance, the|Δ𝜂|restriction described below would result in a small number of tracks being paired many times, and thus making an disproportionately large contribution to the correlation function.
The one-dimensionalΔ𝜙normalized pair yields,𝑌(Δ𝜙), are constructed by integrating over a restricted
|Δ𝜂|range, typically 2.0 to 5.0, designed to suppress the contributions to the correlation from non-flow effects (such as jets, particle decays, and resonances), as:
𝑌(Δ𝜙)=
∫ |Δ𝜂|=5.0
|Δ𝜂|=2.0
𝑌(Δ𝜙,|Δ𝜂|) 𝑑|Δ𝜂|.
In principle, due to finite coverage and detection efficiency introduced by a real detector,𝑌may contain acceptance effects that do not reflect physical particle pair correlations. To account for this, a mixed-event technique may be applied [56], in which particles𝑎and𝑏are taken from different events that have similar overall characteristics. The two events are required to have a ZDC signature on the same side (i.e. same directions of the photon and nucleus), and a similar charged-particle multiplicity, primary vertex position, and cluster edge gapΔ𝜂cluster
edge . The mixed-event distribution𝑑2𝑁
mixed/(𝑑Δ𝜙 𝑑Δ𝜂)contains the effects of the pair acceptance but not the physical correlations.
The acceptance effects can be corrected for by dividing the same-event pair distribution by the mixed-event ones. The two-dimensional (2-D) correlation function corrected for acceptance effects is
𝐶(Δ𝜙,Δ𝜂) = 1 𝑁𝑎
𝑑2𝑁
pair
𝑑Δ𝜙 𝑑Δ𝜂 ,
1 𝑁mixed
pair
𝑑2𝑁
mixed
𝑑Δ𝜙 𝑑Δ𝜂 ,
where𝑁𝑎 is the total yield of particles with selection𝑎,𝑁
mixedis the yield in mixed events, and𝑁mixed
pair
is the total integral of the mixed-event distribution𝑑2𝑁
mixed/(𝑑Δ𝜙 𝑑Δ𝜂). Without the mixing correction, the 2-D𝑌(Δ𝜙,Δ𝜂) distributions have an artificial triangular shape inΔ𝜂, reflecting the convolution of the single-particle acceptances
𝜂𝑎, 𝜂𝑏
<2.5. This effect is removed by the mixing correction, and theΔ𝜂 dependence of structures in the 2-D𝐶(Δ𝜙,Δ𝜂)distributions become more evident.
Correlation functions are constructed for various selections on𝑁rec
ch and 𝑝𝑎
T, with the 𝑝
T of particle 𝑏 always in the range 0.4< 𝑝𝑏
T < 2 GeV. All events are given an equal statistical weight, and no corrections for the trigger efficiency or differences in sampled luminosity (for𝑁rec
ch ranges that span contributions
from multiple triggers) are performed. Although the mixed-event correction is necessary to properly construct the two-dimensional correlation functions presented below, it was found to ultimately have only a minor effect on the projected, one-dimensional𝑌(Δ𝜙)distributions, producing compatible results but with increased statistical uncertainty. Thus the mixing correction is not applied for the nominal𝑣
2and𝑣
3results.
Instead, it is used in the determination of systematic uncertainties associated with the pair acceptance of the detectors as described in Section6.
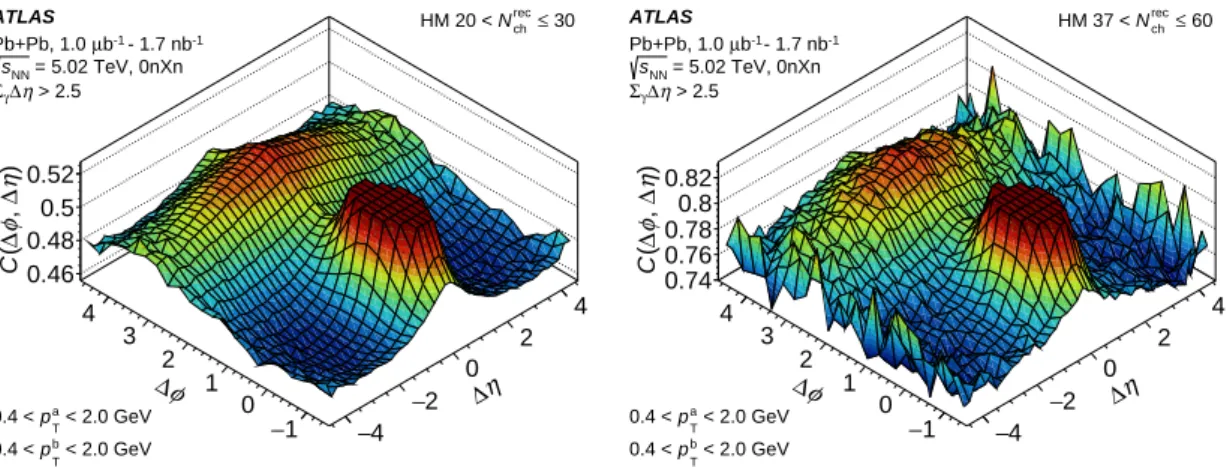
Examples of two-dimensional𝐶(Δ𝜙,Δ𝜂) correlation functions are presented in Figure7and Figure8.
In Figure7, particles𝑎and𝑏are required to have 0.4 < 𝑝𝑎
T < 2 GeV , and two example𝑁rec
ch selections are shown. In Figure8, correlation functions are presented for 20 < 𝑁rec
ch
< 60, with two example 𝑝
T
selections for particle𝑎shown. The two-dimensional correlation functions have features which are broadly similar to those observed in𝑝 𝑝collisions. There is a localized ‘near-side’ peak at(Δ𝜙,Δ𝜂) ≈ (0,0)from correlations between jet fragments, and an extended ‘away-side’ ridge atΔ𝜙≈ 𝜋which extends over a large Δ𝜂range from correlations between fragments of azimuthally opposite jets. A quantitative analysis and non-flow subtraction are necessary to discern if there are additional ridge structures, as detailed below.
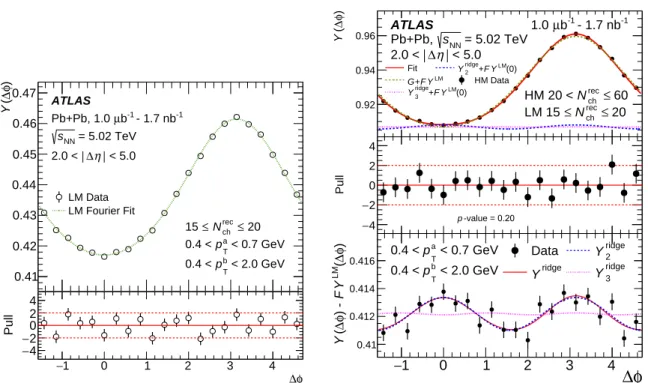
5.1 Non-flow subtraction
To remove the contribution to the correlation function from non-flow effects that persist as long-range contributions on the away side (Δ𝜙∼ 𝜋), a template fit procedure is employed. To perform the fit procedure, samples corresponding to events with low multiplicity (LM) and high multiplicity (HM) are selected. The shape of the non-flow contribution is assumed in the template procedure to be the same in the LM and HM samples. In this analysis, the LM events are chosen to have 15≤ 𝑁rec
ch ≤20.
The𝑌(Δ𝜙) in HM events is parameterized as the sum of an azimuthally modulated pedestal (which expresses the azimuthal anisotropy) and a non-flow component, as follows:
𝑌HM(Δ𝜙) =𝐹𝑌LM(Δ𝜙) +𝐺
1+2
∑︁4
𝑛=2
𝑣𝑛, 𝑛cos(𝑛Δ𝜙)
=𝐹𝑌LM(Δ𝜙) +𝑌ridge(Δ𝜙). (1)
Above,𝑌LM(Δ𝜙)is the correlation function in LM events, which is parameterized as a truncated Fourier series up to the fourth order (with coefficients𝑐𝑛for𝑛=0, . . . ,4). The values of𝐹and𝐺, the three𝑣𝑛, 𝑛 values, and the five parameters𝑐𝑛, describing the LM reference, are free parameters in the fit, but𝐹and 𝐺are constrained such that the integrals of both sides of Eq. (1) are the same. Modulation terms up to fourth order (𝑣
2,2,𝑣
3,3, and𝑣
4,4) are considered in the fit, in order to best describe the HM data. By fitting 𝑌LM(Δ𝜙) and𝑌HM(Δ𝜙) simultaneously, the extracted uncertainty in𝐹,𝐺, and𝑣𝑛, 𝑛correctly accounts for the statistical uncertainty of both the LM and HM samples. An example of the simultaneous fit of the HM selection and LM reference is shown in Figure9. Examples of the template fit in additional HM and 𝑝𝑎
T selections are shown in Figure10. In the bottom panels of Figs.9and10, the𝑝-values are defined following the procedure described below.
The template fit is performed by minimizing the standard𝜒2between the data points and the functional form.
However, the data points within the correlation functions contain nontrivial point-to-point correlations, since a single particle𝑏may be used in combination with multiple particles of type𝑎. The minimum of the
−4
−2 0
2 4
∆η
−1 0 1 2 3 4
∆φ 0.46 0.48 0.5 )η∆, φ∆(C0.52
ATLAS
Pb+Pb, 1.0 µb-1 - 1.7 nb-1 = 5.02 TeV, 0nXn sNN
> 2.5 η
γ∆ Σ
< 2.0 GeV
a
pT
0.4 <
< 2.0 GeV
b
pT
0.4 <
≤30
rec
Nch
HM 20 <
−4
−2 0
2 4
∆η
−1 0 1 2 3 4
∆φ 0.74 0.76 0.78 0.8 )η∆, φ∆(C0.82
ATLAS
Pb+Pb, 1.0 µb-1 - 1.7 nb-1 = 5.02 TeV, 0nXn sNN
> 2.5 η
γ∆ Σ
< 2.0 GeV
a
pT
0.4 <
< 2.0 GeV
b
pT
0.4 <
≤60
rec
Nch
HM 37 <
Figure 7: Two-dimensional normalized particle pair distributions in photonuclear events, corrected for acceptance effects with the mixed-event distribution, and presented as a function ofΔ𝜂andΔ𝜙. The peak at(Δ𝜙,Δ𝜂)=(0,0)is truncated to better show the structure of the correlation function. Each panel represents a different charged-particle multiplicity𝑁rec
ch range for the selection 0.4<(𝑝𝑎
T, 𝑝𝑏
T)<2.0 GeV.
−4
−2 0
2 4
∆η
−1 0 1 2 3 4
∆φ 0.5 0.52 0.54
)η∆, φ∆(C
ATLAS
Pb+Pb, 1.0 µb-1 - 1.7 nb-1 = 5.02 TeV, 0nXn sNN
> 2.5 η
γ∆ Σ
< 0.7 GeV
a
pT
0.4 <
< 2.0 GeV
b
pT
0.4 <
≤60
rec
Nch
HM 20 <
−4
−2 0
2 4
∆η
−1 0 1 2 3 4
∆φ 0.5 0.55 )η∆, φ∆(C 0.6
ATLAS
Pb+Pb, 1.0 µb-1 - 1.7 nb-1 = 5.02 TeV, 0nXn sNN
> 2.5 η
γ∆ Σ
< 3.0 GeV
a
pT
2.0 <
< 2.0 GeV
b
pT
0.4 <
≤60
rec
Nch
HM 20 <
Figure 8: Two-dimensional normalized particle pair distributions in photonuclear events, corrected for acceptance effects with the mixed-event distribution, and presented as a function ofΔ𝜂andΔ𝜙. The peak at(Δ𝜙,Δ𝜂)=(0,0)is truncated to better show the structure of the correlation function. Each panel represents a different𝑝𝑎
Trange for the selection 20< 𝑁rec
ch <60 and 0.4< 𝑝𝑏
T<2.0 GeV.
𝜒2statistic, when calculated in the traditional way, is found at the appropriate values of the fit parameters.
However, the𝑝-value and the uncertainty in the parameter values, if also determined in the standard way, would be inaccurate. In order to properly account for these correlations and determine the parameter value uncertainties, a bootstrapping procedure was applied. Pseudo-experiments were generated by giving a random Poisson weight (with a mean of one) to individual events. These pseudo-experiments are independent sets of events drawn from the observed set of events with the same statistics and correlations as the real data. The parameters values extracted in the pseudo-experiments agreed with those in data and followed Gaussian distributions. The standard deviations of the parameters values extracted from the pseudo-experiments were used to set the statistical uncertainties in the final results, which are 10–30%
−1 0 2 3
φ
∆ 0.41
0.42 0.43 0.44 0.45 0.46 0.47
)φ∆(Y
LM Data LM Fourier Fit
−1 0 1 2 3 4
φ
∆
−42
−0 2 4
Pull
ATLAS
Pb+Pb, 1.0 µb-1 - 1.7 nb-1 = 5.02 TeV sNN
< 5.0 η
∆ 2.0 <
≤20
rec
Nch
≤ 15
< 0.7 GeV
a
pT
0.4 <
< 2.0 GeV
b
pT
0.4 <
−1 0 1 2 3 4
0.92 0.94 0.96
)φ∆(Y
HM Data Fit
YLM F + G
LM(0) Y F ridge+ Y2 LM(0) Y F ridge+ Y3
−1 0 1 2 3 4
−4
−2 0 2 4
Pull
p -value = 0.20
−1 0 1 2 3 4
φ
∆
0.41 0.412 0.414 0.416 )φ∆(LM YF) - φ∆(Y
Data
ridge
Y
ridge
Y2 ridge
Y3
- 1.7 nb-1
b-1
µ 1.0 ATLAS
= 5.02 TeV sNN
Pb+Pb, < 5.0
∆η 2.0 <
≤ 60
rec
Nch
HM 20 <
≤ 20
rec
Nch
≤ LM 15
< 0.7 GeV
a
pT
0.4 <
< 2.0 GeV
b
pT
0.4 <
Figure 9: An example of the template-fitting procedure for a selected𝑝
Trange. The left plot displays the LM data with open markers and the simultaneous fit in the green dotted line. The lower panel displays the pull distribution. In the top panel of the right plot, the solid red line shows the total fit to the HM data in black markers. The dashed green line shows the scaled LM plus pedestal, while the dashed blue and dotted magenta lines indicate the two flow contributions to the fit,𝑌ridge
2 =𝐺[1+2𝑣
2,2cos(2Δ𝜙)]and𝑌ridge
3 =𝐺[1+2𝑣
3,3cos(3Δ𝜙)], shifted upwards by𝐹𝑌LM(0)for visibility. The middle-right panel shows the pull distribution for the template fit in the top panel.
The bottom-right panel shows the same set of data and fit components, where the scaled LM distribution has been subtracted to better isolate the modulation.
larger than if they were estimated in the naïve way without taking the point-to-point correlations into account. The 𝑝-values from the bootstrapping experiment are presented in the template fit plots that follow.
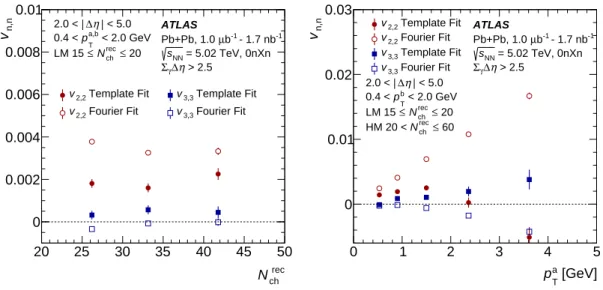
The full set of𝑣
2,2and𝑣
3,3values are shown in Figure11. The filled points show the non-flow subtracted results according to the template fit procedure in Eq. (1). The open points show the𝑣𝑛, 𝑛values that would be obtained if instead a direct Fourier decomposition of𝑌HM were performed, without any attempt to account for the non-flow contribution. For most of the selections considered here, the non-flow subtraction has a significant effect on the extracted𝑣
2,2and𝑣
3,3values. The resulting𝑣𝑛, 𝑛values are positive in all selections, with one exception: in the𝑝𝑎
T-dependent results with a single HM selection, the𝑣
2,2value for 3< 𝑝
T < 5 GeV is negative. Additionally, the𝑣
2,2value for 2< 𝑝
T <3 GeV is significantly lower than that for 1.2< 𝑝
T <2 GeV. In these selections, the𝑣
3,3values also rise significantly. The template fits to these selections are shown in Figure12, and are discussed further below.
5.2 Factorization test
In the flow paradigm, a two-particle azimuthal modulation characterized by a𝑣𝑛, 𝑛value arises from the product of nonzero azimuthal anisotropies,𝑣𝑛, for each particle. These are related via𝑣𝑛, 𝑛(𝑝𝑎
T
, 𝑝𝑏
T) =