EUROPEAN ORGANISATION FOR NUCLEAR RESEARCH (CERN)
Eur. Phys. J. C 81 (2021) 600
DOI:10.1140/epjc/s10052-021-09344-w
CERN-EP-2020-228 30th August 2021
Search for squarks and gluinos in final states with one isolated lepton, jets, and missing transverse
momentum at √
𝒔 = 13 TeV with the ATLAS detector
The ATLAS Collaboration
The results of a search for gluino and squark pair production with the pairs decaying via the lightest charginos into a final state consisting of two
𝑊bosons, the lightest neutralinos ( ˜
𝜒01
), and quarks, are presented: the signal is characterised by the presence of a single charged lepton (
𝑒±or
𝜇±) from a
𝑊boson decay, jets, and missing transverse momentum. The analysis is performed using 139 fb
−1of proton–proton collision data taken at a centre-of-mass energy
√
𝑠 =
13 TeV delivered by the Large Hadron Collider and recorded by the ATLAS experiment.
No statistically significant excess of events above the Standard Model expectation is found.
Limits are set on the direct production of squarks and gluinos in simplified models. Masses of gluino (squark) up to 2.2 TeV (1.4 TeV) are excluded at 95% confidence level for a light ˜
𝜒01
.
©2021 CERN for the benefit of the ATLAS Collaboration.
Reproduction of this article or parts of it is allowed as specified in the CC-BY-4.0 license.
arXiv:2101.01629v2 [hep-ex] 27 Aug 2021
1 Introduction
The Standard Model (SM) has proven to be a very successful theory. The discovery of the Higgs boson boson [1–4] by the ATLAS and CMS collaborations confirmed the predicted electroweak symmetry breaking, but also highlighted the hierarchy problem [5–8]. Supersymmetry (SUSY) [9–14] is a theoretical framework which assumes supersymmetric particles differing from their SM partners by a half unit of spin.
By introducing a new fermionic (bosonic) supersymmetric partner for each boson (fermion) in the SM, SUSY provides a possible solution to the hierarchy problem. In SUSY models conserving R-parity [15], SUSY particles are produced in pairs. The lightest supersymmetric particle (LSP) has to be stable and is possibly weakly interacting, constituting a viable dark-matter candidate [16, 17].
The partner particles of the SM fermions (quarks and leptons) are the scalar squarks ( ˜
𝑞) and sleptons ( ˜
ℓ).
In the boson sector, the supersymmetric partners of the gluons are the fermionic gluinos ( ˜
𝑔). The fermionic supersymmetric partners of the Higgs scalars (higgsinos) and of the electroweak gauge bosons (winos and bino) mix to form charged mass eigenstates (charginos) and neutral mass eigenstates (neutralinos). In the minimal supersymmetric extension of the Standard Model (MSSM) [18, 19], two scalar Higgs doublets along with their higgsino partners are necessary, resulting in two charginos ( ˜
𝜒±1,2
) and four neutralinos ( ˜
𝜒01,2,3,4
).
Squarks and gluinos, in R-parity-conserving scenarios, are produced in pairs through the strong interaction.
If strongly interacting gluinos or squarks are present at the TeV scale, they should be produced copiously in the 13 TeV
𝑝 𝑝collisions at the Large Hadron Collider (LHC). With the recorded integrated luminosity and the predicted cross-sections for squark and gluino production, the searches are expected to be sensitive to sparticle masses of a few TeV.
This paper targets two simplified SUSY models [20, 21] describing gluino and first two generation squark ( ˜
𝑢𝐿,𝑑˜
𝐿,𝑐˜
𝐿,𝑠˜
𝐿) production processes and decays. These models, introduced in Ref. [22], serve as benchmarks. In the models, referred to as the gluino and squark one-step models, gluinos or squarks are produced in pairs: gluinos subsequently decay via a virtual squark into a ˜
𝜒±1
and two light quarks, while squarks decay into a ˜
𝜒±1
and one light quark (
𝑞 ∈ {𝑢, 𝑑 , 𝑠, 𝑐}). The ˜
𝜒±1
then decay into a
𝑊±boson and a
˜
𝜒01
. The corresponding diagrams are shown in Figure 1. It is further assumed that ˜
𝜒±1
is wino-like and the ˜
𝜒01
is bino-like. In both models, the branching fractions for SUSY particles are assumed to be 100%
for the aforementioned processes squark/gluino decay into ˜
𝜒±1
and quarks, and ˜
𝜒±1 → 𝜒
˜
01𝑊±
. The SM particles are assumed to decay following their known branching fractions. All other sparticles, which do not explicitly appear in the decay chains, are set to be kinematically inaccessible and decoupled.
In this search, two different types of mass spectra are considered. In the first one, the ˜
𝜒±1
mass is set to be exactly midway between the masses of the gluino (squark) and the ˜
𝜒01
, so that the relative mass splitting
𝑥=(𝑚(𝜒˜
±1) −𝑚(𝜒
˜
01))/(𝑚(𝑔
˜
/𝑞˜
) −𝑚(𝜒˜
01))
is equal to 1/2. In the second mass spectrum, the ˜
𝜒01
mass is set to be 60 GeV while the gluino (squark) mass and the relative mass splitting are free parameters.
The experimental signature of interest consists of a single charged lepton (electron or muon) produced by the leptonic decay of one of the
𝑊bosons, at least two jets, and large missing transverse momentum (
𝐸missT
, defined in Section 4) from the undetected neutrino and the two neutralinos. The sparticle masses
determine the energy available in their decays, so the number of jets and their kinematic properties depend
on the mass spectrum chosen. To provide sensitivity to a broad range of mass spectra in the gluino and
squark one-step models, four signal regions with differing jet multiplicity requirements from
≥2 to
≥6
are defined. Furthermore, the signal regions are categorised by allowing or forbidding the presence of jets
˜ g
˜ g
˜ χ
±1˜ χ
±1p
p
q q ¯
0˜ χ
01W
±¯ q
0q
˜ χ
01W
±˜ q
˜ q
˜ χ
±1˜ χ
±1p
p
q
0˜ χ
01W
±q
0˜ χ
01W
±Figure 1: Diagrams for (a) gluino and (b) squark pair production with subsequent decays into quarks and a ˜𝜒±
1. The
˜ 𝜒±
1 decays into a ˜𝜒0
1 and aWboson. This analysis targets final states in which oneWdecays leptonically and the other hadronically.
originating from
𝑏quarks (
𝑏-tag and
𝑏-veto signal regions, respectively) to be sensitive to a wider class of decay processes, e.g. gluino decays producing top quarks.
The results presented in this paper are based on the ATLAS data collected in proton–proton collisions at the LHC during 2015–2018 at a centre-of-mass energy of 13 TeV, corresponding to an integrated luminosity of 139 fb
−1. This analysis supersedes the previous ATLAS search with an integrated luminosity of 36.1 fb
−1[23]. Similar searches for gluinos and squarks with decays via intermediate supersymmetric particles were performed by the CMS Collaboration [24, 25].
2 ATLAS detector
The ATLAS detector [26–28] is a multipurpose particle detector with nearly 4
𝜋coverage in solid angle.
1It consists of an inner tracking detector surrounded by a thin superconducting solenoid providing a 2 T axial magnetic field, electromagnetic and hadron calorimeters, and a muon spectrometer. The inner tracking detector covers the pseudorapidity range
|𝜂| <2
.5. It consists of silicon pixel, silicon microstrip, and transition radiation tracking detectors. Lead/liquid-argon (LAr) sampling calorimeters provide electromagnetic (EM) energy measurements with high granularity. A steel/scintillator-tile hadron calorimeter covers the central pseudorapidity range (
|𝜂| <1
.7). The endcap and forward regions are instrumented with LAr calorimeters for EM and hadronic energy measurements up to
|𝜂|=4
.9. The muon spectrometer surrounds the calorimeters and is based on three large air-core toroidal superconducting magnets with eight coils each. The field integral of the toroids ranges between 2.0 and 6.0 Tm across most of the detector. The muon spectrometer includes a system of precision tracking chambers and fast detectors for triggering. A two-level trigger system [29] is used to select events. The first-level trigger is implemented in hardware and uses a subset of the detector information to keep the accepted rate below
1ATLAS uses a right-handed coordinate system with its origin at the nominal interaction point in the centre of the detector. The positive𝑥-axis is defined by the direction from the interaction point to the centre of the LHC ring, with the positive𝑦-axis pointing upwards, while the beam direction defines the𝑧-axis. Cylindrical coordinates(𝑟 , 𝜙)are used in the transverse plane,𝜙 being the azimuthal angle around the𝑧-axis. The pseudorapidity𝜂is defined in terms of the polar angle𝜃by𝜂=−ln tan(𝜃/2). Rapidity is defined as𝑦= 0.5 ln[(𝐸+𝑝𝑧)/(𝐸−𝑝𝑧)]where𝐸denotes the energy and𝑝𝑧is the component of the momentum along the beam direction. The angular distanceΔ𝑅is defined as
√︁(Δ𝑦)2+ (Δ𝜙)2.
100 kHz. This is followed by a software-based trigger that reduces the accepted event rate to 1 kHz on average.
3 Dataset and simulated events
The search is performed using 139 fb
−1of LHC
𝑝 𝑝collision data collected between 2015 and 2018 by the ATLAS detector, with a centre-of-mass energy of 13 TeV and a 25 ns proton bunch crossing interval.
The average number of interactions per bunch crossing (pile-up) evolved over the data-taking period from
h𝜇i =13 in 2015, to
h𝜇i=25 in 2016,
h𝜇i =38 in 2017, and
h𝜇i=36 in 2018. The uncertainty in the combined 2015–2018 integrated luminosity is 1.7% [30], obtained using the LUCID-2 detector [31] for the primary luminosity measurements.
The SM background modelling, signal selection efficiencies, and signal event yield are evaluated using Monte Carlo (MC) simulated event samples. All the samples are produced by a fast simulation [32]
procedure that combines a parameterisation of the calorimeter response with a Geant4 [33] simulation of the other detector systems implemented in the ATLAS simulation infrastructure [34].
To model the pile-up observed in data, inelastic
𝑝 𝑝events were generated with Pythia 8.186 [35] using the NNPDF2.3LO set of parton distribution functions (PDF) [36] and a set of tuned parameters called the A3 tune [37]. These events were overlaid on all simulated hard-scatter events to model the additional proton–proton interactions in the same and nearby bunch crossings. The pile-up overlay was reweighted to match the observed distribution in data. The simulated events are reconstructed with the same algorithms as used for data.
Signal gluino (squark) pair production samples were produced with MadGraph5_aMC@NLO v2.6.2 [38]
at next-to-leading order for the hard-scattering matrix element and Pythia 8.212 (Pythia 8.230) for underlying event, parton shower and hadronization. Signal cross-sections are calculated to approximate next-to-next-to-leading order in the strong coupling constant, adding the resummation of soft gluon emission at next-to-next-to-leading-logarithm accuracy (approximate NNLO+NNLL) [39–46]. The nominal cross- section and its uncertainty are derived using the PDF4LHC15_mc PDF set, following the recommendations of Ref. [47]. A typical cross-section for gluino production with
𝑚˜
𝑔 =
2000 GeV, and
𝑚𝜒˜01 =
200 GeV is 1
.01
±0
.20 fb, while for squarks with
𝑚˜
𝑞 =
1200 GeV and
𝑚𝜒˜01 =
200 GeV a typical cross-section is 6
.8
±0
.9 fb when the four partners of the left-handed first two generation quarks ( ˜
𝑢L
, ˜
𝑑L
, ˜
𝑠L
, and ˜
𝑐L
) are assumed to be mass-degenerate. A ‘single squark flavour’ limit is also given assuming that only one such left-handed first and second generation quarks is kinematically accessible.
All relevant SM backgrounds are considered:
𝑡𝑡¯ pair production; single-top production (
𝑠-channel,
𝑡-channel, and associated
𝑊 𝑡production);
𝑊/𝑍+jets production;
𝑡𝑡¯ production with an electroweak boson (
𝑡𝑡¯
+𝑉); and diboson (
𝑊 𝑊,
𝑊 𝑍,
𝑍 𝑍) production. Different MC event generators were used to produce the background samples, depending on their production process. The MC-produced events are then normalised to data using the corresponding theoretical cross-sections. The event generators, the routines for parton showering and hadronisation, and the parameter tunes and parton distribution functions for all background processes produced are summarised in Table 1.
The
𝑊+jets events were generated using Sherpa: the generation process includes up to two partons at NLO
and four partons at LO using Comix [48] and OpenLoops [49, 50]. The matrix element was merged with
the Sherpa parton shower [51] according to the ME+PS@NLO prescription [52–55] using the set of tuned
Table 1: Overview of MC generators used for different simulated event samples for background.
Process Generator Parton shower and Tune PDF Cross-section
hadronisation
𝑡¯𝑡 Powheg-Box v2 [58–61] Pythia 8.230 [62] A14 [63] NNPDF2.3LO [36] NNLO+NNLL [64]
Single top Powheg-Box v2 [65–67] Pythia 8.230 A14 NNPDF2.3LO NLO+NNLL [68]
𝑊/𝑍+jets Sherpa 2.2.1 [69] Sherpa 2.2.1 Sherpa default NNPDF3.0NNLO NNLO [70]
Diboson Sherpa 2.2.1 & 2.2.2 Sherpa 2.2.1 & 2.2.2 Sherpa default NNPDF3.0NNLO NLO
𝑡¯𝑡+𝑉 MG5_aMC@NLO v2.3.3 Pythia 8.210 A14 NNPDF2.3LO NLO [71]
parameters developed by the Sherpa authors. To simulate the properties of the bottom- and charm-hadron decays, the EvtGen v1.2.0 [56] program was used for all samples showered with Pythia.
Systematic uncertainties, for both signal and background samples, derived from the MC generator configuration are evaluated using samples produced without detector simulation. The uncertainties account for variations of the renormalisation and factorisation scales, the CKKW-L [57] matching scale, as well as different PDF sets and fragmentation/hadronisation models. Details of the MC modelling uncertainties are discussed in Section 7.
4 Object reconstruction
Each event is required to have at least one reconstructed interaction vertex with a minimum of two associated tracks, each having
𝑝T >
500 MeV. In events with multiple vertices, the one with the highest sum of squared transverse momenta of associated tracks is chosen as the primary vertex (PV) [72]. Baseline quality criteria are applied to reject events with non-collision backgrounds or detector noise [73].
Two levels of object definition for leptons and jets are used: ‘baseline’ and ‘signal’. Loose quality requirements define baseline objects, which are used in the calculation of missing transverse momentum and in the overlap removal procedure described below. Signal objects, obtained by applying more selective identification criteria to objects passing the baseline requirements, are used as input for the actual search region definitions. Isolation criteria applied to a set of track-based and calorimeter-based variables, are used to discriminate between signal leptons and semileptonic heavy-flavour decays, photon conversions as well as jets misidentified as leptons.
Energy deposits in the electromagnetic (EM) calorimeter that are matched to charged-particle tracks in the inner detector (ID) [74] provide electron candidates. The
𝑝T
of electron is calculated based on the energy deposited in the EM calorimeter. Baseline electrons must have
𝑝T >
7 GeV and
|𝜂| <2
.47 and must satisfy the Loose working point provided by a likelihood-based algorithm, described in Ref. [74]. The longitudinal impact parameter
2𝑧0
relative to the PV is required to satisfy
|𝑧0
sin
𝜃| <0
.5 mm. The number of hits on the track is used to discriminate between electrons and converted photons. Signal electron candidates are required to satisfy the Tight likelihood operating point and the requirement
|𝑑0/𝜎(𝑑
0) | <
5.
The Loose and HighPtCaloOnly isolation working points, described in Ref. [74], are applied to signal electrons having
𝑝T <
200 GeV and
𝑝T >
200 GeV, respectively.
2The longitudinal impact parameter𝑧
0corresponds to the𝑧-coordinate distance between the point along the track at which the transverse impact parameter is defined and the primary vertex. The transverse impact parameter𝑑
0is defined as the distance of closest approach in the transverse plane between a track and the beam-line. The uncertainty in𝑑
0is denoted𝜎(𝑑
0).
Signal electrons with
𝑝T<
200 GeV are refined using the Loose isolation working point, while those with larger
𝑝T
are required to pass the HighPtCaloOnly isolation working point, as described in Ref. [74].
Muon candidates are reconstructed from matching tracks in the ID and muon spectrometer, refined through a global fit using the hits from both subdetectors [75]. Baseline muons are required to satisfy
𝑝T >
6 GeV and
|𝜂| <2
.7. They are identified using the Medium identification criteria [75]. As with the electrons, baseline muons are required to satisfy
|𝑧0
sin
𝜃| <0
.5 mm. Signal muon candidates must also satisfy tighter pseudorapidity and transverse impact parameter requirements,
|𝜂|<2
.5 and
|𝑑0/𝜎(𝑑
0) | <
3, and the FixedCutLoose isolation working point requirements.
Jet candidates are reconstructed from three-dimensional topological energy clusters in the calorimeters using the anti-
𝑘𝑡algorithm [76] with a radius parameter
𝑅=0
.4 [77]. Baseline jets must have
|𝜂| <4
.5 and
𝑝T >
20 GeV. To suppress pile-up interactions, those jets having
|𝜂| <2
.8 and
𝑝T <
120 GeV are required to pass the Medium working point of the jet vertex tagger (JVT), a multivariate algorithm that identifies jets originating from the PV using track information [78, 79]. Signal jets must also have
|𝜂| <2
.8 and
𝑝T >
30 GeV.
Jets with
𝑝T >
20 GeV in the region
|𝜂| <2
.5 that contain
𝑏-hadrons can be ‘
𝑏-tagged’ with high efficiency by the MV2c10 [80], which is a boosted decision tree with improved light-flavour jet and
𝑐-jet rejection. The
𝑏-tagging working point provides an efficiency of 77% for jets containing
𝑏-hadrons in simulated
𝑡𝑡¯ events, with rejection factors of 110 and 4.9 for light-flavour jets and jets containing
𝑐-hadrons, respectively [81].
Signal
𝑏-jets should also have
𝑝T >
30 GeV.
An overlap removal procedure is applied to the baseline objects defined above to resolve reconstruction ambiguities between electrons, muons and jets. First, any electron sharing the same ID track with a muon is rejected. If two electrons share the same ID track, the one with lower
𝑝T
is discarded. Next, jets are rejected if they lie within
Δ𝑅=0
.2 of an electron and then electrons are removed if they are within a cone of
𝑝T
-dependent size
Δ𝑅=min
(0
.4
,0
.04
+10 GeV
/𝑝T)
around a jet. Subsequently, jets are rejected if they are within
Δ𝑅=0
.2 of a muon or if the muon is matched to the jet through ghost association [82]. Finally, muons within a cone, defined in the same way as for electrons, around any remaining jet are removed.
The missing transverse momentum,
𝒑missT
, with magnitude,
𝐸missT
, is calculated as the negative vectorial sum of the transverse momenta of all reconstructed baseline objects (electrons, muons, jets and photons [83]) and a soft term. The soft term includes all selected tracks associated with the PV but not matched to any reconstructed baseline object. To suppress contributions from pile-up and improve the
𝐸missT
resolution, tracks not associated with the PV are excluded from the
𝐸missT
calculation [84, 85].
The efficiency differences in the trigger, lepton identification and reconstruction between data and simulated events are closely evaluated in independent measurements, and are accounted for by applying the corresponding corrections to the simulation in this analysis.
5 Event selection
To retain acceptance for soft leptons, events satisfying the
𝐸missT
trigger selection were recorded [86] and used in the search. The trigger efficiency is higher than 98% for offline
𝐸missT
values above 250 GeV.
To target the signal-like events, selected events are required to have exactly one signal lepton, either an
electron or a muon. Events with additional baseline leptons are rejected to suppress dilepton
𝑡𝑡¯ , single-top
(
𝑊 𝑡-channel),
𝑍+jets and diboson backgrounds. The following observables are used to further reduce background contributions and increase the sensitivity for signal:
•
The transverse mass,
𝑚T
, is defined from the lepton transverse momentum
𝒑ℓT
and
𝒑missT
as
𝑚T =
√︃
2
𝑝ℓT
𝐸miss
T
1
−cos
[Δ𝜙(𝒑ℓT
, 𝒑miss
T )]
,
where
Δ𝜙(𝒑ℓT
, 𝒑miss
T )
is the azimuthal angle between
𝒑ℓT
and
𝒑missT
. It has an upper endpoint at the
𝑊boson mass for
𝑊+jets events and for semileptonic
𝑡𝑡¯ events. The
𝑚T
distribution for signal events extends significantly beyond that endpoint.
•
The effective mass,
𝑚eff
, is the scalar sum of the
𝑝T
of the signal lepton and all signal jets and
𝐸miss T:
𝑚eff = 𝑝ℓ
T+
𝑁jet
∑︁
𝑗=1
𝑝T, 𝑗 +𝐸miss
T .
The effective mass provides good discrimination against background events, especially for the signal scenarios with energetic jets. It can also help to distinguish between different signal channels. For example gluino production shows higher jet multiplicity than squark production. High-mass gluinos and squarks are expected to produce harder jets than low-mass ones. Thus, the optimal
𝑚eff
value depends on the different signal scenarios. To achieve a wide-range sensitivity to various SUSY models with a limited number of signal regions, multiple intervals in
𝑚eff
are used in the final model-dependent signal regions.
•
The aplanarity is a variable designed to provide more global information about the full momentum tensor of the event. It is constructed from the lepton and the jets, and is defined as
(3
/2
) ×𝜆3
, where
𝜆3is the smallest eigenvalue of the sphericity tensor [87]. Typical measured aplanarity values lie in the range 0–0.3, with values near zero indicating highly planar background-like events. Strongly produced SUSY signals tend to have high aplanarity values, since they are more spherical than background events due to the multiple objects emitted in the gluino/squark decay chains.
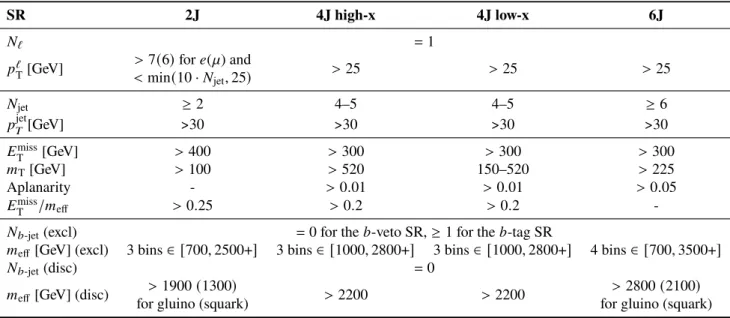
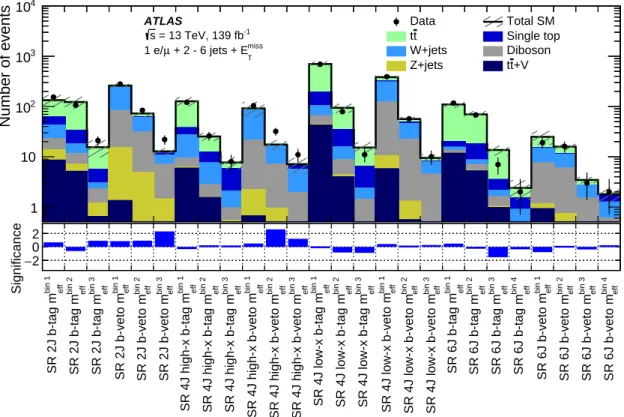
Four mutually exclusive signal regions (SRs) are designed to enhance the signal sensitivity. The selection criteria for the four SRs are summarised in Table 2. Each SR is optimised for specific SUSY scenarios, as discussed below. They are labelled by the minimum required number of jets and, where relevant, the characteristics of the targeted supersymmetric mass spectrum:
2J,
4J high-x,
4J low-x, and
6J. When setting model-dependent exclusion limits (‘excl’), each SR is divided in
𝑚eff
intervals and in
𝑏-veto/
𝑏-tag categories, and a simultaneous fit is performed across all bins of the four SRs. This choice enhances the sensitivity to a range of new-physics scenarios with or without
𝑏-quarks in the final states, and with different mass splittings. For model-independent limits and null-hypothesis tests (‘disc’ for discovery), the event yield in each SR is used to search for an excess over the SM background using an optimised minimum
𝑚effvalue. The discovery SRs require the
𝑏-veto and are separately optimised for gluino and squark cases.
The systematic uncertainties, fits, and results discussed in the following sections for the simplfied models are based on the exclusion SRs, while the model-independent results are based on the discovery SRs.
The
2JSR targets compressed scenarios where differences between
𝑚˜ 𝑔/𝑞˜
,
𝑚𝜒˜±1
, and
𝑚𝜒˜01
are small and the decay products tend to have low
𝑝T
. Thus, events are required to have one low-
𝑝T
lepton and at least two jets. The lower
𝑝ℓT
bound is 7
(6
)GeV for the electron (muon), and the upper
𝑝ℓT
bound increases with the jet multiplicity up to 25 GeV. The upper
𝑝ℓT
requirement ensures the orthogonality between the
2JSR and other signal regions. The jet multiplicity dependence maintains the balance between background rejection and signal acceptance: the leptons are more energetic for signals with increasing mass splittings.
Stringent requirements are placed on
𝐸missT
and on
𝐸miss T /𝑚eff
to enhance the signal sensitivity by selecting signal events with boosted final-state neutralinos recoiling against energetic initial-state radiation (ISR) jets.
Compared to other SRs, a less stringent lower bound on
𝑚eff
is preferred.
The
4J high-xSR provides sensitivity to the models with a fixed
𝑚𝜒˜01
of 60 GeV and a high
𝑥value, i.e.
when
𝑚𝜒˜±1
and
𝑚˜
𝑔/𝑞˜
are relatively close. Events with four or five jets are selected for this scenario. The mass-splitting between
𝑚𝜒˜±1
and
𝑚𝜒˜01
is large enough to produce a boosted
𝑊boson that decays into a high-
𝑝T
lepton and a neutrino. Large
𝑚T
is thus the most distinguishing characteristic of this SR. Relatively soft jets are expected to be emitted from the gluino or squark decays. The SM background is further suppressed by tight requirements on
𝐸missT
, aplanarity, and
𝐸miss T /𝑚eff
. Compared to the
2JSR, a tighter
𝑚effselection is applied due to higher jet activity.
The
4J low-xSR is optimised for the models where
𝑚𝜒˜01
is fixed to 60 GeV and
𝑥 ≈0, i.e.
𝑚𝜒˜±1
is close to
𝑚𝜒˜01
. The jet multiplicity requirement is the same as in the
4J high-xSR. In contrast to the high-
𝑥scenarios, the small mass-splitting between
𝑚𝜒˜±1
and
𝑚𝜒˜01
tends to produce an off-shell
𝑊boson, leading to small
𝑚T
. To keep this SR orthogonal to the
4J high-xSR, an upper bound is applied to
𝑚T
. Other than that, the requirements on
𝑚eff
,
𝐸missT
, aplanarity, and
𝐸miss T /𝑚eff
are identical to the ones used in the
4J high-xSR.
The
6JSR targets signal scenarios with high gluino/squark mass, and is optimised for models with
𝑥 ≈1
/2.
Events with one high-
𝑝T
lepton and at least six jets are selected. Large aplanarity is required, reflecting the heavy gluino/squark produced in the targeted signature. Tight requirements on
𝑚T
and
𝐸missT
are imposed to reduce the SM background. To achieve high sensitivity for a wide range of
𝑚˜
𝑔/𝑞˜
, four exclusive bins are defined in
𝑚eff
and used in the fit. The lowest mass bin starts from 700 GeV, and the highest from 2800 GeV.
Table 2: Overview of the selection criteria for the signal regions used for gluino/squark one-step models. The requirements that only apply to the exclusion (discovery) SRs are marked with ‘excl’ (‘disc’). The𝑚effbins are of even width and the ‘+’ indicates that overflow events are included in the last bin.
SR 2J 4J high-x 4J low-x 6J
𝑁ℓ =1
𝑝ℓ
T[GeV]
>7(6)for𝑒(𝜇) and >25 >25 >25
<min(10·𝑁
jet,25)
𝑁jet ≥2 4–5 4–5 ≥6
𝑝jet
𝑇[GeV] >30 >30 >30 >30
𝐸miss
T [GeV] >400 >300 >300 >300
𝑚T[GeV] >100 >520 150–520 >225
Aplanarity - >0.01 >0.01 >0.05
𝐸miss
T /𝑚
eff >0.25 >0.2 >0.2 -
𝑁𝑏
-jet(excl) =0 for the𝑏-veto SR,≥1 for the𝑏-tag SR
𝑚eff [GeV] (excl) 3 bins∈ [700,2500+] 3 bins∈ [1000,2800+] 3 bins∈ [1000,2800+] 4 bins∈ [700,3500+]
𝑁𝑏
-jet(disc) =0
𝑚eff [GeV] (disc)
>1900(1300)
>2200 >2200
>2800(2100)
for gluino (squark) for gluino (squark)
6 Background estimation
Robust prediction of the SM background event yields in SRs is important in any search like the one presented in this paper. Different approaches for calculating the SM event yields in the SRs are used depending on the background process of interest. The yields of
𝑡𝑡¯ , single-top, and
𝑊+jets processes are estimated from data using a set of dedicated control regions (CRs), while contributions from
𝑍+jets,
𝑡𝑡¯ produced in association with a
𝑊or
𝑍boson, and dibosons (
𝑊 𝑊,
𝑊 𝑍,
𝑍 𝑍) are evaluated from MC simulation. The details are described below.
Three sets of CRs,
2J,
4J,
6J, are defined for estimating the backgrounds in
2J,
4J high-x,
4J low-xand
6Jsignal regions. The CRs satisfy the criteria of high purity for the targeted background process and low signal contamination from the model of interest. The purity varies from 57% to 88% for the top backgrounds (
𝑡𝑡¯ and single top) in top CRs and from 73% to 92% for
𝑊+jets in
𝑊+jets CRs. Each of the CRs is defined with kinematic boundaries close to the corresponding SR in order to reduce the theoretical and detector uncertainties from the extrapolation. The contributions of the top and
𝑊+jets backgrounds in the SRs are evaluated with a fit based on the profile likelihood method. The normalised background predictions are obtained from a simultaneous fit across all control regions, as described in Section 8. The control regions for top and
𝑊+jets are presented in Table 3. Events in the top control region require at least one
𝑏-tagged signal jet in the event, while
𝑊+jets control regions are defined by vetoing all events containing any
𝑏-tagged signal jets. The CRs are crafted in the same way as signal regions, thus each CR is defined as a function of
𝑚eff
, with the same binning as the corresponding SR. This permits extrapolation from each
𝑏-tag/
𝑏-veto and
𝑚eff
bin in CRs to the corresponding bin in the SRs. The extrapolation from CRs to SRs is performed via the
𝑚T
variable, which is found to be well modelled in simulation as shown in Figure 2.
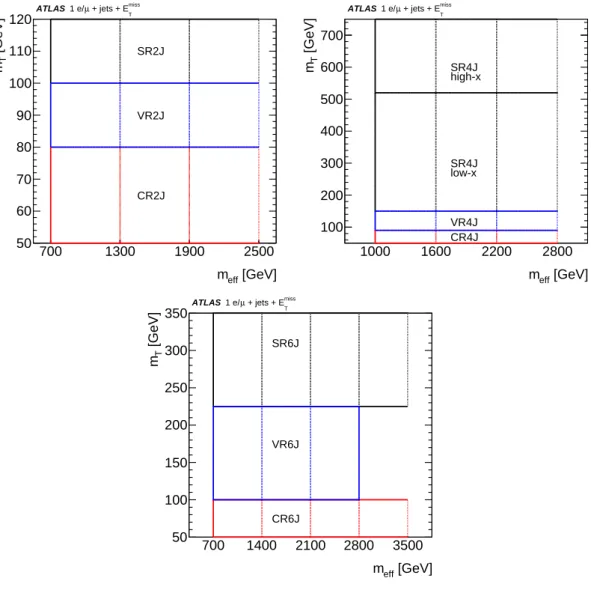
In order to validate the background fit results, cross-checks of the background estimates are performed in validation regions (VRs) situated between the SRs and the CRs in
𝑚T
, while remaining orthogonal to both regions. The VRs are also defined as functions of
𝑚eff
in the same way as the corresponding CRs and SRs, to ensure an
𝑚eff
-dependent validation. The highest
𝑚eff
bin in the
6JVR is not used because its signal contamination would be too large. Similar to the control regions, events in the top VRs require a
𝑏-tag, while events in the
𝑊+jets VRs require a
𝑏-veto. The VRs are not used to constrain the fit; they serve only to verify that the normalised background predictions agree with the observed data. The VR definitions and their graphical representation are shown in Table 4 and Figure 3.
The background contributions from
𝑍+jets,
𝑡𝑡¯
+𝑉and diboson events are evaluated from simulation. The simulated event samples are normalised to the relevant theoretical cross-sections. No dedicated control regions for the diboson background are used, as the modelling of this background by simulation is found to be sufficiently good when compared with the data in the validation regions. The data and MC predictions yield, obtained from the overall background estimate, differ in all validation regions by less than two standard deviations. The background originating from misidentified leptons, real leptons coming from jets produced by heavy-flavour quarks or photons converted to electrons is evaluated using both MC and data-driven methods, and it is found to be negligible within the statistical error of the data due to the stringent requirements on
𝐸missT
.
obs_x_SR2JNm1BVEM_mt
−1
10 1 10 102
103
104
105
106
Events / 20 GeV
= 13 TeV, 139 fb-1
s ATLAS SR 2J N-1 b-veto
Data Total SM
t t Single top
W+jets Diboson Z+jets
+V t t
)=(900,860,820) GeV 1
χ∼0 1, χ∼± , g~ m(
)=(600,575,550) GeV 1
χ∼0 1, χ∼± , q~ m(
50 110 170 230 290 350 410 [GeV]
mT
0 1 2
Data / SM
obs_x_SR2JNm1BTEM_mt
−1
10 1 10 102
103
104
105
106
Events / 20 GeV
= 13 TeV, 139 fb-1
s ATLAS SR 2J N-1 b-tag
Data Total SM
t t Single top
W+jets Diboson Z+jets
+V t t
)=(900,860,820) GeV 1
χ∼0 1, χ∼± , g~ m(
)=(600,575,550) GeV 1
χ∼0 1, χ∼± , q~ m(
50 110 170 230 290 350 410 [GeV]
mT
0 1 2
Data / SM
obs_x_SR4JNm1BVEM_mt
−1
10 1 10 102
103
104
105
106
Events / 20 GeV
= 13 TeV, 139 fb-1
s ATLAS SR 4J N-1 b-veto
Data Total SM
t t Single top
W+jets Diboson Z+jets
+V t t
)=(1600,660,60) GeV 1
χ∼0 , 1 χ∼± , g~ m(
)=(1400,1260,60) GeV 1
χ∼0 1, χ∼± , g~ m(
50 290 530 770 1010
[GeV]
mT
0 1 2
Data / SM
obs_x_SR4JNm1BTEM_mt
−1
10 1 10 102
103
104
105
106
Events / 20 GeV
= 13 TeV, 139 fb-1
s ATLAS SR 4J N-1 b-tag
Data Total SM
t t Single top
W+jets Diboson Z+jets
+V t t
)=(1600,660,60) GeV 1
χ∼0 , 1 χ∼± , g~ m(
)=(1400,1260,60) GeV 1
χ∼0 1, χ∼± , g~ m(
50 290 530 770 1010
[GeV]
mT
0 1 2
Data / SM
obs_x_SR6JNm1BVEM_mt
−1
10 1 10 102
103
104
105
Events / 20 GeV
= 13 TeV, 139 fb-1
s ATLAS SR 6J N-1 b-veto
Data Total SM
t t Single top
W+jets Diboson Z+jets
+V t t
)=(1800,1100,400) GeV 1
χ∼0 1, χ∼± , g~ m(
)=(1000,512,24) GeV 1
χ∼0 1, χ∼± , q~ m(
50 290 530 770 1010
[GeV]
mT
0 1 2
Data / SM
obs_x_SR6JNm1BTEM_mt
−1
10 1 10 102
103
104
105
106
Events / 20 GeV
= 13 TeV, 139 fb-1
s ATLAS SR 6J N-1 b-tag
Data Total SM
t t Single top
W+jets Diboson Z+jets
+V t t
)=(1800,1100,400) GeV 1
χ∼0 1, χ∼± , g~ m(
)=(1000,512,24) GeV 1
χ∼0 1, χ∼± , q~ m(
50 290 530 770 1010
[GeV]
mT
0 1 2
Data / SM
Figure 2: The𝑚
Tdistributions in the signal regions after all of the selection requirements other than the𝑚
Tcut (noted as ‘N-1’ in the figures). Due to the removal of the𝑚
Trequirement, these plots effectively show the CRs, VRs and SRs for each jet multiplicity. The uncertainty bands include all statistical and systematic uncertainties. Overflow events are included in the last bin. The dashed lines represent benchmark signal points for gluino and squark pair production.
Table 3: Overview of the control region selection criteria. The top and𝑊+jets control regions are defined by the 𝑏-tag and𝑏-veto requirements, respectively. The𝑚
eff bins are of even width and the ‘+’ indicates that overflow events are included in the last bin.
CR 2J 4J 6J
𝑁ℓ =1
𝑝ℓ
T[GeV]
>7(6)for𝑒(𝜇) and >25 >25
<min(10·𝑁
jet,25)
𝑁jet ≥2 4–5 ≥6
𝐸miss
T [GeV] >400 >300 >250
𝑚T[GeV] 50–80 50–90 50–100
Aplanarity - >0.01 >0.05
𝐸miss
T /𝑚
eff >0.25 >0.2 -
𝑚eff[GeV] 3 bins∈ [700,2500+] 3 bins∈ [1000,2800+] 4 bins∈ [700,3500+]
𝑁𝑏
-jet ≥1 for the top CR;=0 for the𝑊+jets CR
Table 4: Overview of the validation region selection criteria. The top and𝑊+jets validation regions are defined by the𝑏-tag and𝑏-veto requirements, respectively. The𝑚
eff bins are of even width and the ‘+’ indicates that overflow events are included in the last bin.
VR 2J 4J 6J
𝑁ℓ =1
𝑝ℓ
T[GeV]
>7(6)for𝑒(𝜇) and
>25 >25
<min(10·𝑁jet,25)
𝑁jet ≥2 4–5 ≥6
𝐸miss
T [GeV] >400 >300 >250
𝑚T[GeV] 80–100 90–150 100–225
Aplanarity - >0.01 >0.05
𝐸miss
T /𝑚
eff >0.25 >0.2 -
𝑚eff[GeV] 3 bins∈ [700,2500+] 3 bins∈ [1000,2800+] 3 bins∈ [700,2800+]
𝑁𝑏-jet ≥1 for the top VR;=0 for the𝑊+jets VR
As a representative example, the
𝑚eff
distributions in the
6J top and
𝑊+jets control regions are shown in Figure 4 before and after a fit which constrains only the control regions. The fit strategy is discussed in Section 8. A trend is observed, as it was in previous similar searches [23], whereby the MC overestimates the expected yields at large values of
𝑚eff
. This is accounted for by applying different normalisation parameter values for each
𝑚eff
bin in the corresponding fit, which effectively corrects the mismodelling. In
the post-fit distributions, the data and the background expectation agree well within the uncertainties.
700 1300 1900 2500 [GeV]
meff
50 60 70 80 90 100 110 120 [GeV]Tm
SR2J
CR2J VR2J
ATLAS miss
+ jets + ET
µ 1 e/
1000 1600 2200 2800
[GeV]
meff
100 200 300 400 500 600 700
[GeV]Tm SR4J
high-x
SR4Jlow-x
CR4J VR4J
ATLAS miss
+ jets + ET
µ 1 e/
700 1400 2100 2800 3500
[GeV]
meff
50 100 150 200 250 300 350 [GeV]Tm
SR6J
CR6J VR6J
ATLAS miss
+ jets + ET
µ 1 e/
Figure 3: Graphical illustration of the control and validation region configuration corresponding to the2J(top left),4J(top right), and6J(bottom) regions. The variables shown on the horizontal and vertical axes indicate the selections that differ between the corresponding control regions, validation regions and signal regions. The dotted lines show the boundaries of the𝑚
effbinning of the exclusion SRs.
obs_x_TR6JEM_meffInc30
−1
10 1 10
102
103
104
105
106
Events / 700 GeV
= 13 TeV, 139 fb-1
s ATLAS TR 6J preFit
Data Total SM
t t Single top
W+jets Diboson Z+jets
+V t t
700 1400 2100 2800 3500
[GeV]
meff
0 1 2
Data / SM
obs_x_WR6JEM_meffInc30
−1
10 1 10
102
103
104
105
Events / 700 GeV
= 13 TeV, 139 fb-1
s ATLAS WR 6J preFit
Data Total SM
t t Single top
W+jets Diboson Z+jets
+V t t
700 1400 2100 2800 3500
[GeV]
meff
0 1 2
Data / SM
obs_x_TR6JEM_meffInc30
−1
10 1 10
102
103
104
105
106
Events / 700 GeV
= 13 TeV, 139 fb-1
s ATLAS
TR 6J
Data Total SM
t t Single top
W+jets Diboson Z+jets
+V t t
700 1400 2100 2800 3500
[GeV]
meff
0 1 2
Data / SM
obs_x_WR6JEM_meffInc30
−1
10 1 10
102
103
104
105
Events / 700 GeV
= 13 TeV, 139 fb-1
s ATLAS
WR 6J
Data Total SM
t t Single top
W+jets Diboson Z+jets
+V t t
700 1400 2100 2800 3500
[GeV]
meff
0 1 2
Data / SM
Figure 4: The𝑚
effdistribution in6J top (left, labelled as ‘TR’) and𝑊+jets (right, labelled as ‘WR’) control regions before (top) and after (bottom) the fit. The uncertainty bands include all statistical and systematic uncertainties.
Overflow events are included in the last bin.
7 Systematic uncertainties
The expected yields for both the signal and background events are subject to theoretical and experimental systematic uncertainties. The theoretical uncertainties for the backgrounds normalised to data influence only the transfer factors from CR(s) to VR(s) and from CR(s) to SR(s), while for the other backgrounds, the uncertainties affect the inclusive cross-section of each process and the acceptance of the analysis selection.
Following the procedure described in Section 6, both the experimental and the theoretical uncertainties are computed separately for each
𝑚eff
bin. Both theoretical and experimental uncertainties are correlated across all
𝑚eff
bins. For the single-top and
𝑡𝑡¯ backgrounds, the theoretical uncertainties due to parton shower and
hadronisation/fragmentation are estimated by comparing the predictions obtained with the Powheg-Box
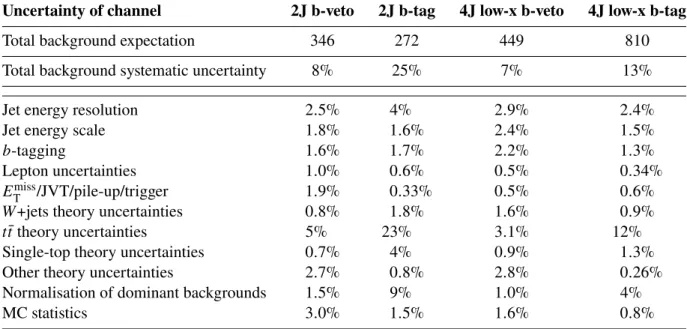
Table 5: Breakdown of the dominant systematic uncertainties in the background estimates in the various signal regions. The numbers are a yield weighted average over the bins. The individual uncertainties can be correlated and do not necessarily add in quadrature to the total background uncertainty. The percentages show the size of the uncertainty relative to the total expected background.
Uncertainty of channel 2J b-veto 2J b-tag 4J low-x b-veto 4J low-x b-tag
Total background expectation 346 272 449 810
Total background systematic uncertainty 8% 25% 7% 13%
Jet energy resolution 2
.5% 4% 2
.9% 2
.4%
Jet energy scale 1
.8% 1
.6% 2
.4% 1
.5%
𝑏
-tagging 1
.6% 1
.7% 2
.2% 1
.3%
Lepton uncertainties 1
.0% 0
.6% 0
.5% 0
.34%
𝐸miss
T
/JVT/pile-up/trigger 1
.9% 0
.33% 0
.5% 0
.6%
𝑊
+jets theory uncertainties 0
.8% 1
.8% 1
.6% 0
.9%
𝑡𝑡
¯ theory uncertainties 5% 23% 3
.1% 12%
Single-top theory uncertainties 0
.7% 4% 0
.9% 1
.3%
Other theory uncertainties 2
.7% 0
.8% 2
.8% 0
.26%
Normalisation of dominant backgrounds 1
.5% 9% 1
.0% 4%
MC statistics 3
.0% 1
.5% 1
.6% 0
.8%
generator interfaced with two different parton shower generators, Pythia 8 and Herwig 7 [88], while those due to the hard-scattering are evaluated by a Powheg-Box + Pythia 8 to MG5_aMC@NLO + Pythia 8 comparison. Diagram removal (DR) and diagram subtraction (DS) samples, modelled by Powheg-Box + Pythia 8, are used to determine the impact of the interference between single-top
𝑊 𝑡and
𝑡𝑡¯ production [89].
In order to evaluate the impact of the uncertainties coming from the emission of initial- and final-state radiation, the renormalisation, and factorisation scales and showering are varied.
Uncertainties for
𝑡𝑡¯
+𝑉,
𝑊/𝑍+jets and dibosons coming from scale variations are evaluated by considering the envelope of the seven-point variations of the renormalisation and factorisation scales. The resummation and the CKKW matching variations for
𝑊/𝑍+jets are estimated by varying the corresponding scale parameters up and down by a factor of two relative to the nominal value for each region. The PDF uncertainties for
𝑊/𝑍+jets are considered following the recommendation in PDF4LHC15 [47], while those for
𝑡𝑡¯ were found to be negligible in all the regions. Systematic uncertainties of 5% and 6% are assigned to the inclusive cross-sections of the
𝑡𝑡¯
+𝑉and diboson processes [90], respectively. For the other background processes such as
𝑍+jets, a systematic uncertainty in the inclusive cross-section is included at the 5% level.
The theoretical uncertainties in the expected yields for the two signal models are considered and estimated using MG5_aMC@NLO + Pythia 8 samples by varying the parameters corresponding to the factorisation, renormalisation and CKKW-L matching scales.
Detector-related systematic uncertainties include uncertainties from jet energy scale (JES), jet energy resolution (JER), lepton reconstruction and identification,
𝑏-tagging,
𝐸missT
modelling, pile-up, and the trigger efficiency. The dominant experimental systematic uncertainties stem from the JES and JER uncertainties. They are derived as a function of
𝑝T
and
𝜂of the jet, the pile-up conditions and the jet
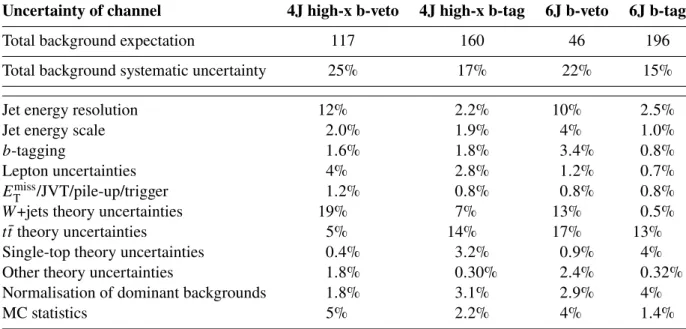
Table 6: Breakdown of the dominant systematic uncertainties in the background estimates in the various signal regions. The numbers are a yield weighted average over the bins. The individual uncertainties can be correlated and do not necessarily add in quadrature to the total background uncertainty. The percentages show the size of the uncertainty relative to the total expected background.
Uncertainty of channel 4J high-x b-veto 4J high-x b-tag 6J b-veto 6J b-tag
Total background expectation 117 160 46 196
Total background systematic uncertainty 25% 17% 22% 15%
Jet energy resolution 12% 2
.2% 10% 2
.5%
Jet energy scale 2
.0% 1
.9% 4% 1
.0%
𝑏
-tagging 1
.6% 1
.8% 3
.4% 0
.8%
Lepton uncertainties 4% 2
.8% 1
.2% 0
.7%
𝐸miss
T
/JVT/pile-up/trigger 1
.2% 0
.8% 0
.8% 0
.8%
𝑊
+jets theory uncertainties 19% 7% 13% 0
.5%
𝑡𝑡
¯ theory uncertainties 5% 14% 17% 13%
Single-top theory uncertainties 0
.4% 3
.2% 0
.9% 4%
Other theory uncertainties 1
.8% 0
.30% 2
.4% 0
.32%
Normalisation of dominant backgrounds 1
.8% 3
.1% 2
.9% 4%
MC statistics 5% 2
.2% 4% 1
.4%
flavour composition [91]. The uncertainties due to the lepton identification, momentum/energy scale and resolution are estimated from samples of
𝑍 → ℓ+ℓ−,
𝐽/𝜓 → ℓ+ℓ−and
𝑊 →ℓ 𝜈decays [74, 75]. The
𝐸missT