A TLAS-CONF-2016-029 15 June 2016
ATLAS NOTE
ATLAS-CONF-2016-029
14th June 2016
Search for new light resonances decaying to jet pairs and produced in association with a photon in proton-proton collisions at √
s = 13 TeV with the ATLAS detector
The ATLAS Collaboration
Abstract
This note describes a search for new resonances decaying to pairs of jets in 3.2 fb
−1of proton-proton collisions with a centre-of-mass energy of
√ s = 13 TeV recorded during 2015
by the ATLAS detector at the Large Hadron Collider. The search requires the new resonance
would be produced in association with a high- p
Tphoton, such as a photon radiated from the
colliding partons, in order to efficiently trigger on events containing light resonances. The
distribution of the invariant mass of the two leading jets is examined for local excesses above
a data-derived estimate of the smoothly falling background. No evidence of anomalous
phenomena is observed in the data, which are used to exclude effective cross-sections of
processes with Gaussian-shaped contributions to the observed dijet mass distribution and
regions of the parameter space of a lepto-phobic axial-vector Z
0benchmark model. These
results extend the limits on light dijet resonances obtained at lower centre-of-mass energies.
1 Introduction
Searches for resonance peaks in the two-jet invariant mass distribution are an essential part of the physics program at the energy frontier. Many theoretical models predict resonances with significant couplings to quarks and gluons, including resonances which also couple to dark matter particles. From the experimental perspective, the search can be done with minimal model dependence and provides substantial gains in sensitivity with increasing of centre-of-mass energy.
These gains are especially important to searches for heavy hypothetical resonances, whose sensitivity is limited by the centre-of-mass energy and the fraction of that energy contained in the interacting partons.
In the Large Hadron Collider (LHC) era, the power to discover or exclude such hadronic resonances has been extended into the TeV range, though no evidence of statistically significant excesses has been seen [1–11].
Sensitivity to light resonances is controlled by more mundane factors, such as immense background rates that would swamp the trigger and data acquisition systems. Recording full events at these high rates demands minimum transverse momentum, p
minT
, thresholds for the jets which creates a lower bound on the sensitivity at a mass of approximately M = 2 p
minT
where p
minT
is typically several hundred GeV.
Consequently, recent searches for light dijet resonances have poor sensitivity for masses well below 1 TeV.
No experiment at a hadron collider has placed new constraints using the dijet final state on resonance masses below 300 GeV in the past two decades. In terms of the coupling between quarks and the resonance, limits in this light-resonance region are weaker than limits in heavy-resonance regions [12].
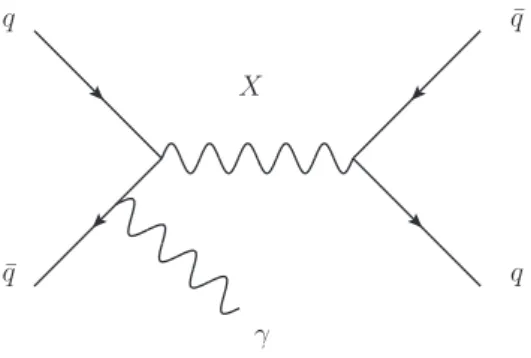
In this note, we present a search using an alternative approach [13, 14] in which the trigger threshold limitations are avoided by examining data where the light resonance (denoted X ) is boosted in the transverse direction via recoil from high- p
Tinitial-state radiation (ISR) of a photon; see Figure 1. Requiring a hard ISR object in the final state comes at the cost of reduced signal production rates, but allows highly-efficient triggering at much lower masses than typically possible when triggering directly on the resonance decay products. The search is performed in a range of dijet masses from 250 GeV to 1.5 TeV.
A complementary search, recording only partial event data in order to efficiently trigger on dijet events without requiring an ISR object, has been performed in parallel and also focuses on light resonances with dijet masses of 425 GeV–1.05 TeV. It is described separately in Ref. [15]. Another complementary search for resonances with masses of 600 GeV and above decaying to heavy-flavour jets is described in Ref. [16].
q
¯
q q
¯ q X
γ
Figure 1: Diagram for the production of a new resonance X recoiling against an ISR photon.
2 ATLAS detector
The ATLAS experiment [17] at the LHC is a multi-purpose particle detector with a forward-backward symmetric cylindrical geometry with layers of tracking, calorimeter, and muon detectors over nearly the entire solid angle around the pp collision point. The directions1 and energies of high transverse momentum ( p
T) particles are measured using silicon tracking detectors and straw tubes detecting transition radiation, finely segmented hadronic and electromagnetic calorimeters, and a muon spectrometer. The inner tracking detector (ID) covers the pseudorapidity range |η| < 2 . 5. It consists of silicon pixel, silicon micro- strip, and transition radiation tracking (TRT) detectors. Lead/liquid-argon (LAr) sampling calorimeters provide electromagnetic (EM) energy measurements with high granularity. A hadron (iron/scintillator- tile) calorimeter covers the central pseudorapidity range ( |η | < 1 . 7). The end-cap and forward regions are instrumented with LAr calorimeters for both EM and hadronic energy measurements up to |η | = 4 . 9. The first-level trigger is implemented in hardware and uses a subset of the detector information to reduce the accepted rate to 100 kHz. This hardware trigger is followed by a software-based trigger that reduces the rate of events recorded to 1 kHz.
3 Data
The data were collected in pp collisions at
√ s = 13 TeV during 2015. Collision events are recorded with a trigger requiring at least one photon candidate with an online p
Tthreshold of 120 GeV passing "loose"
identification requirements based on the shower shapes in the EM calorimeter as well as on the energy leaking into the hadronic calorimeter from the EM calorimeter [18].
Only data satisfying beam, detector and data quality criteria are considered. The data used for the analysis correspond to an integrated luminosity of 3.2 fb
−1. The uncertainty in the integrated luminosity is ± 5%.
It is derived following a methodology similar to that detailed in Ref. [19] from a preliminary calibration of the luminosity scale using x – y beam-separation scans performed in August 2015.
4 Simulated samples
Samples of simulated events are used to characterise the hypothetical resonances as well as to study the kinematic distributions of background processes. However, these samples are not used to estim- ate the background contributions, except to validate the data-driven background estimate (described in Section 7).
Samples of backgrounds containing a photon with associated jets are simulated by Sherpa 2.1.1 [20], generated in several bins of photon p
Tfrom 35 GeV up to larger than 4 TeV. The matrix elements are calculated at leading-order (LO) with up to three partons for photon p
T< 70 GeV or four partons for higher photon p
T. These are merged with the Sherpa parton shower [21] using the ME+PS@LO
1
ATLAS uses a right-handed coordinate system with its origin at the nominal interaction point (IP) in the centre of the detector
and the z -axis along the beam pipe. The x -axis points from the IP to the centre of the LHC ring, and the y -axis points
prescription [22]. The CT10 set of parton distribution functions (PDFs) [23] is used in conjunction with the dedicated parton shower tuning developed by the Sherpa authors.
As a benchmark signal, samples with a lepto-phobic Z
0resonance are generated as in Refs. [10, 24]. This Z
0has axial-vector couplings to quarks and to a fermion dark matter candidate. The coupling of the Z
0to quarks, g
q, is set to be universal in quark flavour. The mass of the dark matter fermion is set to a value much heavier than the Z
0, such that the decay width to dark matter is zero. The total width Γ
Z0is computed as the minimum width allowed given the coupling and mass m
Z0; this width is 3 . 6–4 . 2% of the mass for m
Z0= 250 GeV–1 . 5 TeV and g
q= 0 . 3. Mixing of this benchmark model with the Standard Model Z boson is assumed to be negligible. A set of samples are generated with m
Z0between 250 GeV and 1.5 TeV and with g
q= 0 . 3 using the MadGraph5_aMC@NLO v2.2.3 [25] program with the NNPDF3.0 LO parton distribution function [26] in conjunction with PYTHIA 8.186 [27] and the A14 set of tuned parameters [28]. For efficient population of the kinematic phase space of the analysis, a photon with at least 100 GeV of transverse momentum is required in the generation phase.
5 Object Reconstruction
Photons are reconstructed from clusters of energy deposits in the electromagnetic calorimeter measured in projective towers. The photon energy is corrected by applying the energy scales measured with Z → e
+e
−decays. The trajectory of the photon is reconstructed using the longitudinal (shower depth) segmentation of the calorimeters and a constraint from the average collision point of the proton beams. Identification requirements are applied to reduce the contamination from π
0or other neutral hadrons decaying to two photons. The photon identification is based on the profile of the energy deposits in the first and second layers of the electromagnetic calorimeter. Candidate photons are required to have p
T> 130 GeV, to ensure the photon trigger is fully efficient. Photons used in the event selection must satisfy the "tight"
identification criteria defined in Ref. [29], be within |η | < 2 . 37 excluding the region 1 . 37 < |η | < 1 . 52, and be isolated as follows. The energy in the calorimeters in a cone of size ∆R = p
( ∆η )
2+ ( ∆φ)
2= 0 . 4 around the cluster barycentre excluding the energy associated with the photon cluster is required to be less than 2 . 45 GeV + 0 . 022 p
γT
, where p
γT
is the p
Tof the photon candidate. This cone energy is corrected for the leakage of the photon energy from the central core and for the effects of additional pp interactions occurring within the same bunch crossing (pile-up) [30].
Clusters without matching tracks are classified as unconverted photon candidates. A photon is considered as a converted photon candidate if it is matched to one track or a pair of tracks that pass a requirement on TRT hits [31]. Pairs of tracks must form a vertex in the ID which is consistent with originating from a massless particle. The position of this conversion vertex is used when computing the photon trajectory if tracks from the conversion have hits in the silicon detectors. A single-track photon candidate must include tracking measurements in the TRT and at least one measurement in the silicon detector after the innermost layer of the pixel detector.
The combination of the above requirements selects a sample of photons that is greater than 90% (80%) pure for unconverted (converted) candidates. The efficiency of the photon selection is roughly 95% for photons with p
T> 130 GeV.
Jets are reconstructed using the anti- k
talgorithm [32, 33] with a radius parameter R = 0 . 4 from clusters
of energy deposits in the calorimeters[34]. A correction used to calibrate jet energy measurements to the
scale of the constituent particles of the jet [35, 36] is then applied. Jets with 25 GeV < p
T< 60 GeV and
|η | < 2 . 4 are required to originate from the primary interaction as determined by a jet vertex tagger [37].
The energies of selected jets are corrected for contributions from pile-up interactions [35].
Quality requirements are applied to photon candidates to reject events containing photons arising from instrumental problems or from non-collision background [31]. In addition, quality requirements are applied to remove events containing jets mis-construed from detector noise and out-of-time energy deposits in the calorimeter from cosmic rays or other non-collision sources [38]. Events are required to have a reconstructed primary vertex, defined as the highest sum p
2T
vertex with at least two tracks.
6 Event Selection
The search uses a sample of events which contain at least one photon with p
T> 130 GeV as well as at least two jets. Jets are required to have p
T> 25 GeV and |η| < 2 . 8. In addition, half the difference in rapidity y of the leading two jets,
y
∗= y
j1− y
j22
is required to satisfy | y
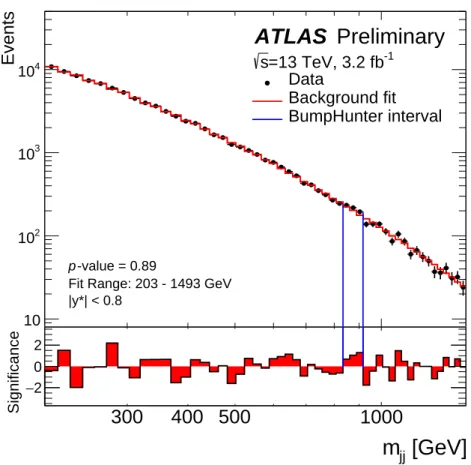
∗| < 0 . 8 to reduce the backgrounds from processes that yield an ISR photon and a non-resonant jet pair from QCD processes, which tend to have higher-rapidity separation. To suppress such jets surviving the photon isolation criterion, and to further suppress background from fragmentation photons where the photon is inside or near a jet, the selected photon is required to be separated from the closest jet by ∆R > 0 . 85. Figure 2 shows the m
j jdistribution of events satisfying these criteria.
7 Background Estimation
To estimate the background contribution, a parametric function,
f ( z) = p
1( 1 − z)
p2z
p3+p4lnz(1) where z ≡ m
j j/ √
s , is fit to the m
j jdistribution shown in Figure 2 to obtain the parameters p
i. The fit range is 203 GeV–1.493 TeV. The dijet searches of the CDF, CMS, and ATLAS experiments, such as those described in Refs. [1, 4, 5, 8, 10, 39], have found that expressions similar to Equation 1 successfully model dijet mass distributions observed at
√ s = 13 TeV and lower collision energies. This ansatz also describes the Sherpa simulation of Standard Model processes that yield a jet pair and ISR photon, described above.
A log-likelihood-ratio statistic employing Wilks’s theorem [40] was used to determine if the background
estimation would be significantly improved by an additional degree of freedom. With the current dataset,
Equation 1 was found to be sufficient, using the same criteria as Ref. [10]. The lower bound of the fit
range, 203 GeV, was chosen high enough to exclude kinematic bias from the p
Trequirement of the photon
trigger. The fit is performed on the binned data, with bins of widths varying proportionate to the detector
m
j jresolution. The resolution varies from approximately 6% at m
j j= 250 GeV to 2.7% at m
j j= 1 . 5 TeV.
[TeV]
Reconstructed m
jj10
2×
3 4 × 10
210
3Events
10 10
210
310
4|y*| < 0.8
Fit Range: 203 - 1493 GeV -value = 0.89
p
× 50 σ = 0.30), Z' (g
q[GeV]
m jj
300 400 500 1000
Significance
− 2 0 2
ATLAS Preliminary
=13 TeV, 3.2 fb
-1s
Data
Background fit BumpHunter interval
= 300 GeV Z', m
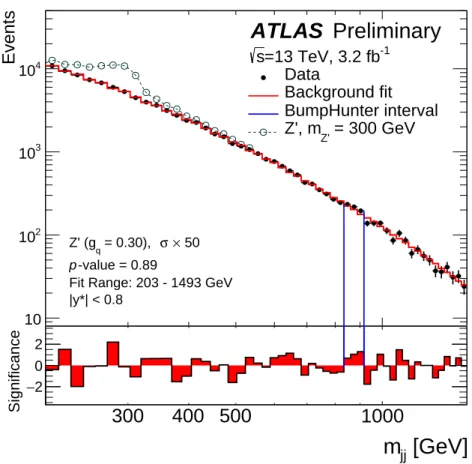
Z'Figure 2: The reconstructed dijet mass distribution (filled points) for events containing a photon with p
T> 130 GeV and two jets with p
T> 25 GeV and | y
∗| < 0 . 8 and satisfying the other selection criteria described in the text.
The solid line depicts the fit to Equation 1. Predictions for a lepto-phobic Z
0of mass 300 GeV and coupling g
q= 0 . 3 are shown above the fit, normalized to 50 times the predicted cross-section to render it visible. The vertical lines indicate the most discrepant interval identified by the BumpHunter algorithm. The lower panel shows the bin-by-bin significances of the data–fit differences, considering only statistical uncertainties.
8 Results
Figure 2 shows the result of the fit of the background model, Equation 1, to the data. The model agrees with the observed data with a p -value of 0.73, using a Poisson likelihood test statistic. The lower panel of the figure shows the significances of bin-by-bin differences between the data and the model. These Gaussian significances are calculated from the Poisson probability, considering only statistical uncertainties. The data has been overlaid with an example of the signal described in Section 4.
The statistical significance of any localised excess in the m
j jdistribution is quantified using the Bump-
Hunter algorithm [41, 42]. The algorithm compares the binned m
j jdistribution of the data to the fitted
background estimate, considering contiguous mass intervals in all possible locations, from intervals of
width of two bins to widths of half of the distribution. For each interval in the scan, it computes the
significance of any excess found. The algorithm identifies the interval 834 GeV–917 GeV, indicated by the
two vertical lines in Figure 2, as the most discrepant interval. The statistical significance of this outcome is
evaluated using the ensemble of possible outcomes across all intervals scanned by applying the algorithm
to many pseudo-data samples drawn randomly from the background fit. Without including systematic
uncertainties, the probability that fluctuations of the background model would produce an excess at least
as significant as the one observed in the data, anywhere in the distribution, is 0.89. Thus, there is no evidence of a localised contribution to the mass distribution from new phenomena.
A Bayesian method [5] is applied to the m
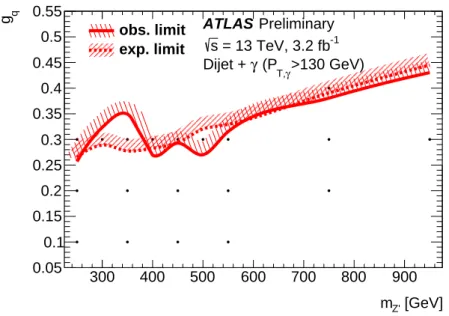
j jdata and simulation of signals at a series of discrete masses to set 95% credibility-level (CL) upper limits on the cross-section times acceptance for the signals described above. The limits are obtained for a discrete set of points in the g
q– m
Z0plane. The method uses a constant prior for the signal cross-section and Gaussian priors for nuisance parameters corresponding to systematic uncertainties. The expected limits are calculated using pseudo-experiments generated from the maximum-likelihood values for parameters of the background-only model in Equation 1 using the systematic uncertainties in both the signal and background models. The limits on the coupling g
qare obtained from the cross-section limits on nearby discrete model points using the fact that the signal cross-section scales with g
2q. The resulting limits are shown in Figure 3.
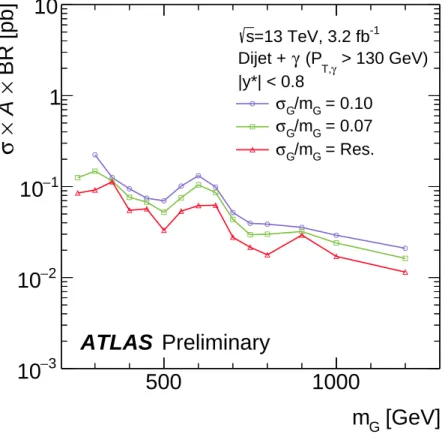
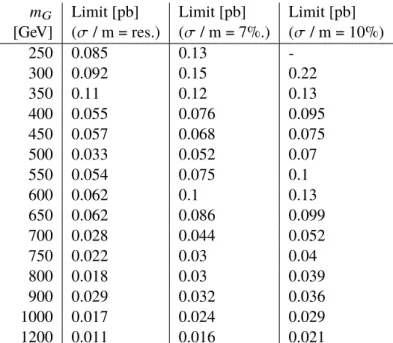
A similar procedure is used for a model in which the signal is assumed to have a Gaussian distribution with one of several widths, ranging from the detector mass resolution (for an intrinsically narrow resonance) to a width of 10% of the mean of the signal mass distribution; see Figure 4. This places 95% CL upper limits on the cross-section times acceptance (visible cross-section) for new processes producing a photon and a resonance jet pair. As the width increases, the expected signal contribution is distributed across more bins. Therefore wider signals are affected less than narrower signals by statistical fluctuations of the data in a single bin and have a reduced sensitivity compared to narrower signals.
In each set of limits, systematic uncertainties used for the signal samples include uncertainties on the acceptance due to uncertainties on the PDFs (1%), the jet energy resolution (2%), and the photon identification, energy scale and resolution (3%). The uncertainties on the jet energy scale are obtained, for the Z
0signals, by varying four nuisance parameters accounting for contributions to the total jet energy scale uncertainty [43, 44]. For the Gaussian-shaped signals, the jet energy scale uncertainties are ≈ 1%, the relative change in mean mass observed in the Z
0signals.
The uncertainty on the background prediction arising from statistical uncertainties on the values of
the parameters in Equation 1 is evaluated by fitting the parameters to pseudo-data drawn via Poisson
fluctuations around the nominal background model. The uncertainty in the prediction in each m
j jbin is
taken to be the standard deviation of the function value for all pseudo-experiments in that bin. To estimate
the uncertainty on the background prediction due to the choice of the background parameterization, a
parameterization with one additional degree of freedom, z
p5ln2z, is compared to the nominal background
model. The difference is taken as an uncertainty. The prediction of the m
j jdistribution does not involve
simulated collisions and thus is not affected by theoretical or experimental uncertainties. The resulting
total background uncertainty is 2% or less for m
j j< 1 TeV.
[GeV]
m
Z'300 400 500 600 700 800 900
q
g
0.05 0.1 0.15
0.2 0.25 0.3 0.35 0.4 0.45 0.5 0.55
>130 GeV)
γ
(P
T,γ Dijet +
= 13 TeV, 3.2 fb
-1s
Preliminary ATLAS
obs. limit exp. limit
Figure 3: The 95% CL upper limits obtained on coupling g
qas a function of the resonance mass m
Z0for the
lepto-phobic Z
0model, as described in the text. Coupling values above the solid curve are excluded. The expected
limit is indicated by a dotted curve. The limits shown are interpolated between limits derived from simulation
at discrete points in the parameter space. The small markers indicate the simulated points. Ref. [15] provides
additional constraints that do not appear on this plot. For 450 GeV < m
Z0< 950 GeV, it places an upper limit on
g
qfrom 0.08–0.13, depending on m
Z0.
[GeV]
m G
500 1000
BR [pb] × A × σ
− 3
10
− 2
10
− 1
10 1 10
ATLAS Preliminary
=13 TeV, 3.2 fb
-1s
> 130 GeV)
γ
(P
T,γ Dijet +
|y*| < 0.8
= 0.10 /m
Gσ
G= 0.07 /m
Gσ
G= Res.
/m
Gσ
GFigure 4: The 95% CL upper limits obtained on cross-section times acceptance times branching ratio to a photon
and two jets, σ × A × BR, corrected for experimental inefficiencies, for a hypothetical signal with a cross-section
σ that produces a Gaussian contribution to the observed m
j jdistribution, as a function of the mean mass of the
Gaussian distribution, m
G. Limits are obtained for three different widths, from a width equal to the detector mass
resolution (“Res.”) to 10% of the mean of the Gaussian mass distribution. Signals with the given reconstructed
width are excluded for visible cross-sections above the corresponding curve.
9 Conclusion
No evidence of phenomena beyond the Standard Model was uncovered in this search using 3.2 fb
−1of proton-proton collisions at
√ s = 13 TeV recorded during 2015 by the ATLAS detector at the LHC. The dijet invariant mass distribution of selected events exhibits no significant local excesses atop a data-derived estimate of the smoothly falling distribution predicted by the Standard Model. The analysis excludes at 95% CL lepto-phobic axial-vector Z
0bosons for g
qabove 0.26 at mass m
Z0= 250 GeV and g
qabove 0.43 at m
Z0= 950 GeV. It also sets 95% CL upper limits on the visible cross-section for new processes that would produce a photon and a Gaussian contribution to the dijet mass distribution. The limits on the visible cross-section range from approximately 100 fb at a mean mass of 250 GeV to 10–20 fb at 1.2 TeV.
These results extend the limits on light dijet resonances obtained at lower centre-of-mass energies.
References
[1] ATLAS Collaboration, Search for new particles in two-jet final states in 7 TeV proton-proton collisions with the ATLAS detector at the LHC , Phys. Rev. Lett. 105 (2010) 161801,
arXiv: 1008.2461 [hep-ex] .
[2] CMS Collaboration, Search for dijet resonances in 7 TeV pp collisions at CMS , Phys. Rev. Lett. 105 (2010) 211801, arXiv: 1010.0203 [hep-ex] .
[3] CMS Collaboration, Measurement of dijet angular distributions and search for quark compositiveness in pp Collisions at √
s = 7 TeV , Phys. Rev. Lett. 106 (2011) 201804, arXiv: 1102.2020 [hep-ex] .
[4] CMS Collaboration,
Search for resonances in the dijet mass spectrum from 7 TeV pp collisions at CMS , Phys. Lett. B 704 (2011) 123, arXiv: 1107.4771 [hep-ex] .
[5] ATLAS Collaboration, Search for new physics in dijet mass and angular distributions in pp collisions at √
s = 7 TeV measured with the ATLAS detector , New J. Phys. 13 (2011) 053044, arXiv: 1103.3864 [hep-ex] .
[6] ATLAS Collaboration, Search for new physics in the dijet mass distribution using 1 fb
−1of pp collision data at √
s = 7 TeV collected by the ATLAS detector , Phys. Lett. B 708 (2012) 37, arXiv: 1108.6311 [hep-ex] .
[7] ATLAS Collaboration, ATLAS search for new phenomena in dijet mass and angular distributions using pp collisions at √
s = 7 TeV , JHEP 1301 (2013) 029, arXiv: 1210.1718 [hep-ex] .
[8] ATLAS Collaboration, Search for new phenomena in the dijet mass distribution using pp collision data at √
s = 8 TeV with the ATLAS detector , Phys. Rev. D 91 (2015) 052007, arXiv: 1407.1376 [hep-ex] .
[9] CMS Collaboration,
Search for narrow resonances using the dijet mass spectrum in pp collisions at √
s = 8 TeV , Phys. Rev. D 87 (2013) 114015, arXiv: 1302.4794 [hep-ex] .
[10] ATLAS Collaboration, Search for new phenomena in dijet mass and angular distributions from pp collisions at √
s = 13 TeV with the ATLAS detector , Phys. Lett. B 754 (2016) 302,
arXiv: 1512.01530 [hep-ex] .
[11] CMS Collaboration,
Search for narrow resonances decaying to dijets in proton-proton collisions at √
(s) = 13 TeV , Phys. Rev. Lett. 116 (2016) 071801, arXiv: 1512.01224 [hep-ex] .
[12] B. A. Dobrescu and F. Yu, Coupling-mass mapping of dijet peak searches , Phys. Rev. D 88 (2013) 035021, arXiv: 1306.2629 [hep-ph] .
[13] H. An, R. Huo and L.-T. Wang, Searching for Low Mass Dark Portal at the LHC , Phys. Dark Univ. 2 (2013) 50, arXiv: 1212.2221 [hep-ph] .
[14] C. Shimmin and D. Whiteson, Boosting low-mass hadronic resonances , 2016, arXiv: 1602.07727 [hep-ph] .
[15] ATLAS Collaboration, Search for light dijet resonances with the ATLAS detector using a Trigger-Level Analysis in LHC pp collisions at √
s = 13 TeV , ATLAS-CONF-2016-030, 2016.
[16] ATLAS Collaboration, Search for resonances below 1.2 TeV from the mass distribution of b-jet pairs in proton-proton collisions at √
s=13 TeV with the ATLAS detector , ATLAS-CONF-2016-031, 2016.
[17] ATLAS Collaboration, The ATLAS Experiment at the CERN Large Hadron Collider , JINST 3 (2008) S08003.
[18] ATLAS Collaboration, 2015 start-up trigger menu and initial performance assessment of the ATLAS trigger using Run-2 data , ATL-DAQ-PUB-2016-001, 2016,
url: http://cds.cern.ch/record/2136007 .
[19] ATLAS Collaboration, Improved luminosity determination in pp collisions at √
s = 7 TeV using the ATLAS detector at the LHC , Eur. Phys. J. C 73 (2013) 2518, arXiv: 1302.4393 [hep-ex] . [20] T. Gleisberg et al., Event generation with SHERPA 1.1 , JHEP 0902 (2009) 007,
arXiv: 0811.4622 [hep-ph] . [21] S. Schumann and F. Krauss,
A parton shower algorithm based on Catani-Seymour dipole factorisation , JHEP 03 (2008) 038, arXiv: 0709.1027 [hep-ph] .
[22] S. Hoeche et al., QCD matrix elements and truncated showers , JHEP 05 (2009) 053, arXiv: 0903.1219 [hep-ph] .
[23] H.-L. Lai et al., New parton distributions for collider physics , Phys. Rev. D 82 (2010) 074024, arXiv: 1007.2241 [hep-ph] .
[24] D. Abercrombie et al., Dark matter benchmark models for early LHC Run-2 searches: report of the ATLAS/CMS Dark Matter Forum , 2015, arXiv: 1507.00966 [hep-ex] .
[25] J. Alwall et al., The automated computation of tree-level and next-to-leading order differential cross sections, and their matching to parton shower simulations , JHEP 1407 (2014) 079, arXiv: 1405.0301 [hep-ph] .
[26] R. D. Ball et al., Parton distributions with LHC data , Nucl. Phys. B 867 (2013) 244, arXiv: 1207.1303 [hep-ph] .
[27] T. Sjöstrand, S. Mrenna and P. Skands, A brief introduction to Pythia 8.1 ,
Comput. Phys. Commun. 178 (2008) 852, arXiv: 0710.3820 [hep-ph] .
[29] ATLAS Collaboration, Measurements of the photon identification efficiency with the ATLAS detector using 4.9 fb
−1of pp collision data collected in 2011 , ATLAS-CONF-2012-123, 2011, url: http://cds.cern.ch/record/1473426 .
[30] ATLAS Collaboration,
Electron and photon energy calibration with the ATLAS detector using LHC Run 1 data , Eur. Phys. J. C 74 (2014) 3071, arXiv: 1407.5063 [hep-ex] .
[31] ATLAS Collaboration, Measurement of the photon identification efficiencies with the ATLAS detector using LHC Run-1 data , (2016), arXiv: 1606.01813 [hep-ex] .
[32] M. Cacciari, G. Salam and G. Soyez, The anti-k
Tjet clustering algorithm , JHEP 0804 (2008) 063, arXiv: 0802.1189 [hep-ph] .
[33] M. Cacciari and G. Salam, Dispelling the N
3myth for the k
tjet-finder , Phys. Lett. B 641 (2006) 57, arXiv: hep-ph/0512210 .
[34] ATLAS Collaboration,
Topological cell clustering in the ATLAS calorimeters and its performance in LHC Run 1 , 2016, arXiv: 1603.02934 [hep-ex] .
[35] ATLAS Collaboration,
Jet energy measurement with the ATLAS detector in proton-proton collisions at √
s = 7 TeV , Eur. Phys. J. C 73 (2013) 2304, arXiv: 1112.6426 [hep-ex] .
[36] ATLAS Collaboration, Single hadron response measurement and calorimeter jet energy scale uncertainty with the ATLAS detector at the LHC , Eur. Phys. J. C 73 (2013) 2305,
arXiv: 1203.1302 [hep-ex] .
[37] ATLAS Collaboration, Tagging and suppression of pileup jets with the ATLAS detector , ATLAS-CONF-2014-018, 2014, url: http://cds.cern.ch/record/1700870 . [38] ATLAS Collaboration,
Selection of jets produced in proton-proton collisions with the ATLAS detector using 2011 data , ATLAS-CONF-2012-020, 2012, url: http://cds.cern.ch/record/1430034 .
[39] CDF Collaboration, T. Aaltonen et al.,
Search for new particles decaying into dijets in proton-antiproton collisions at √
s = 1 . 96 TeV , Phys. Rev. D 79 (2009) 112002, arXiv: 0812.4036 [hep-ex] .
[40] S. S. Wilks, The large-sample distribution of the likelihood ratio for testing composite hypotheses , Ann. Math. Statist. 9 (1938) 60.
[41] CDF Collaboration, T. Aaltonen et al., Global search for new physics with 2.0 fb
−1at CDF , Phys. Rev. D 79 (2009) 011101, arXiv: 0809.3781 [hep-ex] .
[42] G. Choudalakis, On hypothesis testing, trials factor, hypertests and the BumpHunter , 2011, arXiv: 1101.0390 [physics.data-an] .
[43] ATLAS Collaboration, A method for the construction of strongly reduced representations of ATLAS experimental uncertainties and the application thereof to the jet energy scale , ATL-PHYS-PUB-2015-014, 2015, url: http://cds.cern.ch/record/2037436 .
[44] ATLAS Collaboration, Jet calibration and systematic uncertainties for jets reconstructed in the ATLAS detector at √
s = 13 TeV , ATL-PHYS-PUB-2015-015, 2015,
url: http://cds.cern.ch/record/2037613 .
[GeV]
m
Z'300 400 500 600 700 800 900
∈ × A
0 0.05 0.1 0.15
0.2 0.25 0.3 0.35 0.4 0.45 0.5
0.1 0.2 0.3
0.4
= 13 TeV s
Simulation,
Preliminary ATLAS
Figure 5: A summary of the signal acceptance (ratio of generated events passing kinematic selection to generated events with photon p
T> 100 GeV) times efficiency for the various signal mass points and couplings considered.
The four sets of points correspond to different choices of coupling value g
q.
Appendix: Additional Information for Re-interpretation
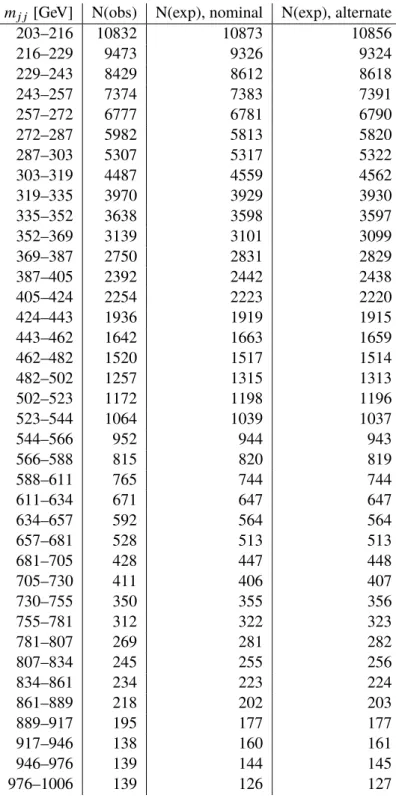
This section contains additional information for the convenience of reinterpreting these results in the context of models not considered here. Integrated data and Monte Carlo (MC) yields after each stage of the selection are presented in Table 1. Counts of the observed data and background predictions in each bin, taken from Figure 2 are given in Tables 2 and 3. The binning of the m
j jdistribution is also defined in these tables. Table 7 provides the numeric values of the limits on Gaussian contributions from Figure 4.
Selection Data Sherpa γ + j j MC m
Z0= 300 GeV m
Z0= 500 GeV
Pre-selection 1972534 1702760 1627 661
Photon p
T> 130 GeV 783004 873246 1252 538
| y
∗| < 0 . 8 521380 559731 937 391
∆R > 0 . 85 492378 525987 880 355
m
j j> 200 GeV 96550 96568 642 312
Table 1: Event yields at each stage of the selection, for the observed data, the Sherpa simulation of γ + j j backgrounds (not used for the actual background prediction), and two samples of the Z
0signals with g
q= 0 . 3. The pre-selection consists of the trigger, event quality, and primary vertex requirements, as well as requiring at least two jets with
|η | < 2 . 8 and p
T> 25 GeV and one tight isolated photon with p
T> 10 GeV.
A summary of the acceptances times efficiencies, A × , is given in Figure 5 and Tables 4–6 for the various signals considered. Acceptance is defined as the fraction of generated events containing a photon
p >
m
j j[GeV] N(obs) N(exp), nominal N(exp), alternate
203–216 10832 10873 10856
216–229 9473 9326 9324
229–243 8429 8612 8618
243–257 7374 7383 7391
257–272 6777 6781 6790
272–287 5982 5813 5820
287–303 5307 5317 5322
303–319 4487 4559 4562
319–335 3970 3929 3930
335–352 3638 3598 3597
352–369 3139 3101 3099
369–387 2750 2831 2829
387–405 2392 2442 2438
405–424 2254 2223 2220
424–443 1936 1919 1915
443–462 1642 1663 1659
462–482 1520 1517 1514
482–502 1257 1315 1313
502–523 1172 1198 1196
523–544 1064 1039 1037
544–566 952 944 943
566–588 815 820 819
588–611 765 744 744
611–634 671 647 647
634–657 592 564 564
657–681 528 513 513
681–705 428 447 448
705–730 411 406 407
730–755 350 355 356
755–781 312 322 323
781–807 269 281 282
807–834 245 255 256
834–861 234 223 224
861–889 218 202 203
889–917 195 177 177
917–946 138 160 161
946–976 139 144 145
976–1006 139 126 127
Table 2: Data and integrated background counts for the combined event selection, including counts for data, the
nominal fit function and the alternate fit function with one additional degree of freedom. Table 3 contains this
information for higher masses.
m
j j[GeV] N(obs) N(exp), nominal N(exp), alternate
1006–1037 113 114 114
1037–1068 86 100 100
1068–1100 105 90 90
1100–1133 86 81 81
1133–1166 60 71 71
1166–1200 67 63 63
1200–1234 56 55 55
1234–1269 50 50 50
1269–1305 37 45 44
1305–1341 36 39 39
1341–1378 41 35 35
1378–1416 31 31 31
1416–1454 32 27 27
1454–1493 24 24 24
Table 3: Data and integrated background counts for the combined event selection, including counts for data, the nominal fit function and the alternate fit function with one additional degree of freedom. Table 2 contains this information for lower masses.
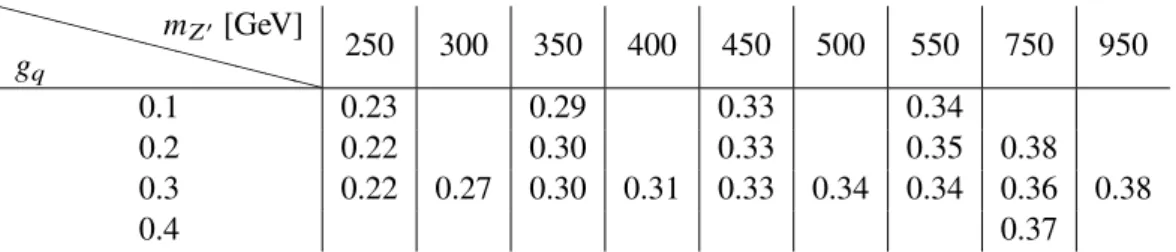
XX XX
XX XX XX X g
qm
Z0[GeV]
250 300 350 400 450 500 550 750 950
0.1 0.23 0.29 0.33 0.34
0.2 0.22 0.30 0.33 0.35 0.38
0.3 0.22 0.27 0.30 0.31 0.33 0.34 0.34 0.36 0.38
0.4 0.37
Table 4: A summary of the signal acceptance (ratio of generated events passing kinematic selection to generated events with photon p
T> 100 GeV) for the various signal mass points and couplings considered.
XX XX
XX XX XX X g
qm
Z0[GeV]
250 300 350 400 450 500 550 750 950
0.1 0.82 0.84 0.82 0.83
0.2 0.82 0.83 0.83 0.80 0.80
0.3 0.83 0.84 0.82 0.82 0.82 0.82 0.83 0.81 0.80
0.4 0.80
Table 5: A summary of the signal efficiency with respected to events passing kinematic selection for the various signal mass points and couplings considered.
XX XX
XX XX XX X g
qm
Z0[GeV]
250 300 350 400 450 500 550 750 950
0.1 0.19 0.24 0.27 0.28
0.2 0.18 0.25 0.27 0.28 0.30
0.3 0.18 0.22 0.25 0.26 0.28 0.28 0.28 0.30 0.30
0.4 0.29
m
GLimit [pb] Limit [pb] Limit [pb]
[GeV] ( σ / m = res.) ( σ / m = 7%.) ( σ / m = 10%)
250 0.085 0.13 -
300 0.092 0.15 0.22
350 0.11 0.12 0.13
400 0.055 0.076 0.095
450 0.057 0.068 0.075
500 0.033 0.052 0.07
550 0.054 0.075 0.1
600 0.062 0.1 0.13
650 0.062 0.086 0.099
700 0.028 0.044 0.052
750 0.022 0.03 0.04
800 0.018 0.03 0.039
900 0.029 0.032 0.036
1000 0.017 0.024 0.029
1200 0.011 0.016 0.021
Table 7: The 95% CL upper limits on cross-section times acceptance times branching ratio to a photon and two jets,
σ × A × BR, for a hypothetical signal with a cross-section σ that produces a Gaussian contribution to the observed
m
j jdistribution, as a function of the mean mass of the Gaussian distribution, m
G. Limits are obtained for three
different widths, from a width equal to the detector mass resolution (“res.”) to 10% of the mean of the Gaussian
mass distribution.
[TeV]
Reconstructed m
jj10
2×
3 4 × 10
210
3Events
10 10
210
310
4|y*| < 0.8
Fit Range: 203 - 1493 GeV -value = 0.89
p
[GeV]
m jj
300 400 500 1000
Significance
− 2 0 2
ATLAS Preliminary
=13 TeV, 3.2 fb
-1s
Data
Background fit BumpHunter interval
Figure 6: The reconstructed dijet mass distribution (filled points) for events containing a photon with p
T> 130 GeV and two jets with p
T> 25 GeV and |y
∗| < 0 . 8 and satisfying the other selection criteria described in the text. This version of Figure 2 omits the overlaid signal. The solid line depicts the fit to Equation 1. The vertical lines indicate the most discrepant interval identified by the BumpHunter algorithm. The lower panel shows the bin-by-bin significances of the data–fit differences, considering only statistical uncertainties.
Appendix: Additional Plots
This appendix contains figures with additional detail on the analysis results, intended for conference
speakers. Figure 6 is an alternate version of Figure 2 where no signal has been overlaid. Figures 7 and
8 summarize the results of the BumpHunter algorithm for all mass intervals considered. Figures 9 and
10 illustrate the relative background uncertainty as function of dijet mass. Figure 11 shows the limits
on visible cross-section of the lepto-phobic axial-vector Z
0for discrete values of coupling g
q. Figure 12
shows the limits on the coupling g
qof the Z
0model as a function of the resonance mass m
Z0, the equivalent
of Figure 3 while directly comparing to the limits obtained in Ref. [15].
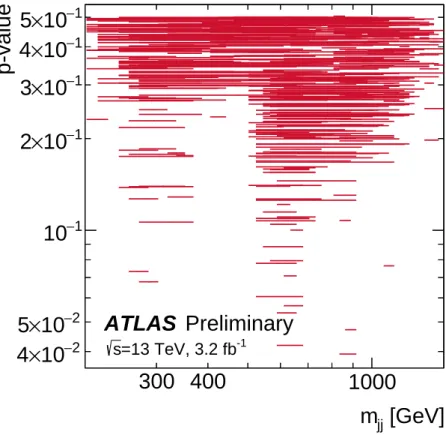
[GeV]
m jj
300 400 1000
p-value
− 2
× 10 4
− 2
× 10 5
− 1
10
− 1
× 10 2
− 1
× 10 3
− 1
× 10 4
− 1
× 10 5
ATLAS Preliminary
=13 TeV, 3.2 fb
-1s
Figure 7: Local p -value for all intervals examined by BumpHunter. For each interval, a line is drawn with horizontal
extent indicating the mass range covered and vertical position indicating the local p -value of the interval.
BumpHunter test statistic
2 4 6 8 10 12 14 16
Pseudo-experiments
1 10 10 2
10 3
Pseudo-experiments Value in Data
ATLAS Preliminary
=13 TeV, 3.2 fb
-1s
-value = 0.89 p
Figure 8: Distribution of the BumpHunter test statistic [42], the negative logarithm of the minimum p -value found,
for an ensemble of background-only pseudo-experiments drawn from the nominal background prediction. The
statistic for the observed m
j jdistribution is indicated by the arrow.
[GeV]
m
jj10
2×
3 4 × 10
210
3Events
10 10
210
310
4[GeV]
m jj
300 400 500 1000
Rel. Uncert. 0.1 −
0 0.1
|y*| < 0.8
Fit Range: 203 - 1493 GeV -value = 0.89
p
Data Fit
Statistical uncertainty on fit Function choice
=13 TeV, 3.2 fb
-1s
ATLAS Preliminary
Figure 9: The reconstructed dijet mass distribution (filled points) for events containing a photon with p
T> 130 GeV
and two jets with p
T> 25 GeV and |y
∗| < 0 . 8 and satisfying the other selection criteria described in the text. The
solid line drawn through the points indicates the fit to Equation 1. The dashed curve shows the relative uncertainty
on the background prediction due to the statistical uncertainty on the fit parameters. The dotted curve shows the
relative uncertainty due to the choice of the background parameterization. These are more easily visible in the lower
panel.
10
2×
3 4 × 10
210
3Events
10 10
210
310
4[GeV]
mjj
300 400 500 600 700 800 900 1000
Significance
−2 0 2
[GeV]
m
jj300 400 500 600 1000
Significance
−2 0 2
Nominal
Best Fit
ATLAS Preliminary
=13 TeV, 3.2 fb
-1s
Data Nominal fit Best fit
Figure 10: The reconstructed dijet mass distribution (filled points) for events containing a photon with p
T> 130 GeV and two jets with p
T> 25 GeV and | y
∗| < 0 . 8 and satisfying the other selection criteria described in the text.
The dark solid line depicts the fit to Equation 1 used for BumpHunter. The lighter (cyan) solid line depicts the best fit to a superposition of Equation 1 and an additional Z
0signal with mass of 300 GeV and g
q= 0 . 3 and arbitrary normalization, along with the full set of systematic uncertainties considered when computing the limits.
The fit has determined the normalization of the signal and the values of the nuisance parameters representing the
systematic uncertainties. The middle panel shows the bin-by-bin significances of the data–fit differences for the
nominal fit, considering only statistical uncertainties. The lower panel shows the bin-by-bin significances of the
data–fit differences for the best fit, considering only statistical uncertainties.
[GeV]
m
Z'200 300 400 500 600
BR [pb] × A × σ
−3
10
−2
10
−1
10 1
ATLAS Preliminary
= 0.10) Z' (gq
Observed 95% CL upper limit Expected 95% CL upper limit 68% and 95% bands
=13 TeV, 3.2 fb-1
s
|y*| < 0.8
[GeV]
m
Z'200 400 600 800
BR [pb] × A × σ
−3
10
−2
10
−1
10 1
ATLAS Preliminary
= 0.20) Z' (gq
Observed 95% CL upper limit Expected 95% CL upper limit 68% and 95% bands
=13 TeV, 3.2 fb-1
s
|y*| < 0.8
[GeV]
m
Z'200 400 600 800 1000
BR [pb] × A × σ
−3
10
−2
10
−1
10 1
ATLAS Preliminary
= 0.30) Z' (gq
Observed 95% CL upper limit Expected 95% CL upper limit 68% and 95% bands
=13 TeV, 3.2 fb-1
s
|y*| < 0.8
Figure 11: The 95% CL upper limits obtained on the visible cross-section, corrected for experimental inefficiencies,
as a function of the resonance mass m
Z0for the lepto-phobic Z
0model with three choices of coupling values, g
q, as
discussed in the main text. The black points and curves indicate the observed limit. The dotted curves (and colored
bands) indicate the limit one would expect to obtain when the observed data agree with the background prediction
(or fluctuate to a value one or two times higher or lower than the uncertainty on the prediction). The blue dashed
curves indicate the visible cross-section predicted in the model for each choice of coupling values.
[GeV]
m
Z’200 300 400 500 600 700 800 900 1000
q
g
0.05 0.1 0.15
0.2 0.25 0.3 0.35 0.4 0.45
= 13 TeV; 3.2-3.4 fb
-1s
Preliminary ATLAS
obs. limit, Dijet + γ exp. limit, Dijet + γ obs. limit, TLA exp. limit, TLA