ATLAS-CONF-2012-067 06July2012
ATLAS NOTE
ATLAS-CONF-2012-067
June 30, 2012
A search for high mass resonances decaying to τ
+τ
−in the ATLAS detector
The ATLAS Collaboration
Abstract
This note presents a search for high-mass resonances decaying into
τ+τ−final states, us- ing proton-proton collisions at
√s
=7 TeV, produced by the Large Hadron Collider (LHC).
The data were recorded with the ATLAS detector and correspond to an integrated luminos- ity of 4.7 fb
−1. No statistically significant excess above the Standard Model expectation is observed; upper limits are set at the 95% CL on the cross section times branching fraction of Z
′resonances decaying into
τ+τ−pairs as a function of the resonance mass. As a result, Z
′bosons of the Sequential Standard Model with masses less than 1.3 TeV are excluded at 95% CL.
c Copyright 2012 CERN for the benefit of the ATLAS Collaboration.
Reproduction of this article or parts of it is allowed as specified in the CC-BY-3.0 license.
1 Introduction
This note presents a search for high-mass resonances decaying into τ
+τ
−pairs using the ATLAS detec- tor [1]. Results are presented based on the analysis of pp collisions at a center-of-mass energy of 7 TeV at the Large Hadron Collider (LHC) [2], corresponding to an integrated luminosity of 4.7 fb
−1.
Heavy gauge bosons are predicted in various models [3–8]. In particular, some models with extended weak or hypercharge gauge groups, which motivate the high mass of the top quark, predict that such bosons preferentially couple to third generation fermions [9].
A typical benchmark model with heavy gauge bosons is the Sequential Standard Model (SSM), which has a heavy Z
′with the same couplings to fermions as the Z boson of the Standard Model (SM). This model is used to optimize the event selection of the search; model-independent Bayesian limits on the cross section times τ
+τ
−branching fraction of a generic neutral resonance are reported as a function of the resonance mass at the 95% CL. Examples of models with such a Z
′boson are the Grand Unification models in which the E
6gauge group is broken into SU(5) and two additional U(1) groups [10], and other models described in Ref. [11]. Lower limits on the mass of Z
SSM′are also reported.
Direct searches for high-mass ditau resonances have been performed previously by the CDF [12]
and CMS [13] Collaborations. The latter result sets the most stringent 95% CL limits and excludes Z
′masses below 1.4 TeV using 4.9 fb
−1of integrated luminosity at
√s
=7 TeV. Precision electroweak measurements at LEP [14] indirectly exclude non-universal Z
′masses below 1090 GeV. For comparison, the most stringent limits on a Z
′in the dielectron and dimuon decay channels combined are 2.2 TeV from ATLAS [11] and 2.32 TeV from CMS [15].
Tau leptons can decay leptonically, into e/µ and two neutrinos, or hadronically (τ
h), almost exclu- sively into one or three charged hadrons, possibly a few neutral hadrons, and one neutrino. The τ
hτ
h(BR=42%), µτ
h(BR=23%) and eµ (BR=6%) channels are analyzed. Due to the different dominant backgrounds and signal sensitivities, each channel is analyzed separately and a statistical combination is used to set exclusion limits.
The expected intrinsic width of the SSM Z
′is narrow, being
∼3% of the Z
′mass [11]. However, in ττ decay modes, the mass resolution is significantly degraded due to the undetected neutrinos from the tau decays, therefore a simple counting experiment is performed in all analysis channels from events that pass a high-mass requirement.
2 The ATLAS detector, data and simulated samples
The ATLAS detector consists of an inner tracking detector surrounded by a thin superconducting solenoid, electromagnetic and hadronic calorimeters, and an external muon spectrometer incorporating large super- conducting air-core toroid magnets. Electrons, muons, taus and jets can be reconstructed and identified in the ATLAS detector up to pseudorapidities
1of
|η
| =2.5, 2.7, 2.5 and 4.9, respectively. Only data taken with all ATLAS sub-systems operational are used. Together with the requirement of having pp collisions in stable beam conditions, this results in an integrated luminosity of 4.7 fb
−1for the full 2011 data sample.
Monte Carlo samples of background processes from W+jets and Z+jets events were generated with ALPGEN [16]. Samples of t¯t, Wt and diboson (WW, WZ, and ZZ) events were generated with MC@NLO [17, 18]. For all these Monte Carlo samples, the parton showering and hadronization were performed by HERWIG [19] interfaced to JIMMY [20] for multiple parton interactions. Samples of s-channel
1ATLAS uses a right-handed coordinate system with its origin at the nominal interaction point (IP) in the center of the detector and the z-axis along the beam pipe. The x-axis points from the IP to the center of the LHC ring, and they-axis points upwards. Cylindrical coordinates (r,φ) are used in the transverse plane,φbeing the azimuthal angle around the beam pipe. The pseudorapidity is defined in terms of the polar angleθasη=−ln tan(θ/2).
and t-channel single top events were generated with AcerMC [21], with the parton showering and hadronization done with PYTHIA [22]. SSM Z
′signal samples were generated with PYTHIA. The effects of QED radiation were generated with PHOTOS [23], and hadronic tau decays were generated with TAUOLA [24]. After generation, the detector response for each Monte Carlo sample was fully sim- ulated with a detailed GEANT4 [25] model of the ATLAS detector and subdetector-specific digitization algorithms [26].
The data are affected by the detector response to multiple proton-proton interactions occurring in the same or in neighboring bunch crossings (referred to as pile-up). To match the pile-up observed in data, minimum-bias interactions generated with PYTHIA (with a specific LHC tune [27]) are overlaid to the generated signal and background events, and the resulting events are reweighted so that the distribution of the average number of pile-up interactions per bunch crossing agrees with data.
3 Reconstruction and preselection
All search channels use a common preselection of objects from ATLAS reconstruction, which is outlined in this section. Geometric overlap between the preselected objects is resolved using the following cri- teria; any two objects closer than
∆R= p(∆η)
2+(∆φ)
2< 0.2 are considered overlapping; preselected electrons are removed if they overlap with a preselected muon; hadronic tau candidates are removed if they overlap with a preselected muon or electron; and jets are removed if they overlap with any prese- lected electron or selected hadronic tau decay. An initial selection of events is performed by requiring a vertex from the primary pp collisions that is consistent with the beam spot position, with at least four associated tracks, each with p
T> 0.5 GeV.
3.1 Muons
Muon candidates are formed from a track measured in the inner detector and linked to a track in the muon spectrometer. The muons used in this analysis are required to have p
T> 10 GeV and
|η
|< 2.5. Muon quality criteria based on, e.g., inner detector hit requirements are applied in order to achieve a precise measurement of the muon momentum and reduce the misidentification rate [28].
3.2 Electrons
Electrons are reconstructed by matching clustered energy deposits in the electromagnetic calorimeter to tracks reconstructed in the inner detector [29]. The electron candidates are preselected to have p
T> 15 GeV and to be in a fiducial volume of the detector with
|η
|< 2.47. The transition region be- tween the barrel and end-cap calorimeters, with 1.37 <
|η
|< 1.52, is excluded. The candidates are required to meet quality requirements based on the expected calorimeter shower shape and amount of ra- diation in the transition radiation tracker. These quality requirements correspond to an electron efficiency of approximately 90%.
3.3 Jets
Jets are reconstructed using the anti-k
talgorithm [30,31] with a radius parameter value of R
=0.4. The jet
finder uses reconstructed three-dimensional, noise-suppressed clusters of calorimeter cells [32]. Jets are
calibrated to the hadronic energy scale with correction factors based on simulation and validated using
test-beam and collision data [33]. All jets are required to have p
T> 25 GeV and
|η
|< 4.5. A method that
allows for the identification and selection of jets originating from the hard-scatter interaction through
the use of tracking and vertexing information is used. This uses a quantity referred to as the “Jet Vertex
Fraction” (JVF), defined as the fraction of the total momentum of the charged particle tracks associated to
the jet which belongs to tracks that are also compatible with the primary vertex. Jets within the tracking acceptance are required to have JVF > 0.75. Events are discarded if a jet is associated with out-of-time activity or calorimeter noise [34].
3.4 Hadronic tau decays
In order to reconstruct hadronically decaying tau leptons, anti-k
tjets with either one or three associated tracks reconstructed in the inner detector and depositing p
T> 10 GeV in the calorimeter are considered as hadronic tau candidates. The tau charge is reconstructed from the sum of the charges of the associated tracks. The charge misidentification probability is estimated to be negligible. Hadronic tau decays are identified using a multivariate algorithm that employs Boosted Decision Trees to discriminate against quark- and gluon-initiated jets with the use of shower shape and tracking information [35]. Working points with a τ
hidentification efficiency of about 50% (“medium”) for the µτ
hand 60% (“loose”) for the τ
hτ
hchannel are chosen, leading to rejection factors in the range 30–100 for jets [36]. Tau candidates are also required to have p
T> 35 GeV and to be in the fiducial volume of the detector,
|η
|< 2.47 (the calorimeter transition region is excluded). In some channels, hadronic tau candidates have additional selection criteria applied, which are described in their respective sections.
3.5 Missing transverse momentum
The signal events are characterized by true missing transverse momentum (E
Tmiss) due to the presence of neutrinos. The E
Tmissis calculated from the vector sum of the transverse momentum of all the high-p
Tobjects reconstructed in the event, as well as a term for the remaining soft activity in the calorime- ter [37]. Clusters associated with electrons, hadronic tau decays and jets are calibrated separately, with the remaining soft clusters calibrated at the electromagnetic energy scale.
4 Analysis of the τ
hτ
hchannel
This analysis relies on the detection of two hadronic tau decays with a large combined transverse mass.
The transverse mass, M
T, is defined as the mass of the visible tau lepton decay products and the E
Tmiss, neglecting longitudinal momentum components and the tau lepton mass:
M
T = q2p
T,1p
T,2(1
−cos
∆φ1,2)
+2E
missTp
T,1(1
−cos
∆φ1,Miss)
+2E
missTp
T,2(1
−cos
∆φ2,Miss), where p
T,1and p
T,2are the transverse momenta of the visible tau decay products;
∆φ1,2is the angle between them; and
∆φ1,Missand
∆φ2,Missare the angles between E
missTand the visible decay products of the two tau decays in the transverse plane. The dominant backgrounds are multijet production and Z/γ
∗ →ττ. Minor contributions come from W(
→τν)+jets and also from Z(
→ℓℓ)+jets, W(
→ℓν)+jets (where ℓ
=e or µ), t¯t, single top-quark and diboson production, which are collectively referred to as
‘others’. The shape of the multijet contribution is estimated from data with two tau candidates of the same electric charge and is normalized to events that have low-M
Tbut pass all other requirements. All other backgrounds are estimated with Monte Carlo (MC) simulation.
4.1 Event selection
The τ
hτ
hanalysis uses events passing either a ditau trigger with E
Tthresholds of 20 and 29 GeV, or
a single-tau trigger with an E
Tthreshold of 125 GeV. In addition, the following selection criteria are
required:
•
at least two τ
hcandidates with p
T> 50 GeV that pass the loose identification. If the event was selected by the ditau trigger and not the single-tau trigger, both τ
hcandidates are required to be matched to the objects that passed the trigger. The p
Tthreshold ensures that tau candidates are on the efficiency-plateau of the ditau trigger. The two leading-p
Tcandidates are selected;
•
no preselected electrons with E
T> 15 GeV or muons with p
T> 10 GeV;
•
opposite electric charge between the two selected τ
hcandidates;
• |∆φ(τ1
, τ
2)
|> 2.7 between the two selected τ
hcandidates.
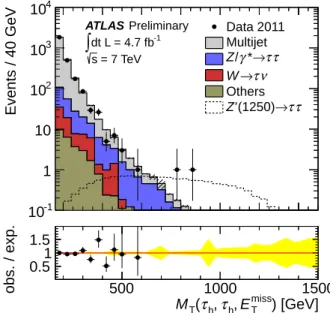
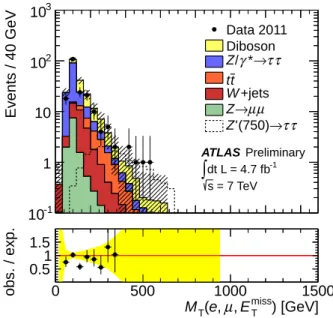
Figure 1 shows the M
Tdistribution after event selection. The search is performed by counting events with M
Tabove a threshold (defined as the signal region), optimized separately for each signal mass hypothesis to give the best expected exclusion limit. The M
Tthresholds are 350, 400, 500, 650 and 700 GeV for the mass points 500, 625, 750–875, 1000–1125, and
≥1250 GeV, respectively. Table 1 shows the number of events passing the selection criteria. The multijet contribution is estimated only in the signal region, and is not shown at each stage of the selection.
Events / 40 GeV
10-1
1 10 102
103
104
ATLAS Preliminary dt L = 4.7 fb-1
∫
s = 7 TeVData 2011 Multijet
τ τ
→ γ* / Z
ν
→τ W Others
τ
→τ (1250) Z’
) [GeV]
miss
ET h, τ
h, τ
T( M
500 1000 1500
obs. / exp.
0.51 1.5
Figure 1: The M
Tdistribution after event selection in the τ
hτ
hchannel. The estimated contributions from SM processes are stacked. A Z
′signal with a mass of 1250 GeV and the events observed in data are overlaid. The uncertainty on the total estimated background (hatched) includes only the statistical uncertainty from the simulated samples, while the uncertainty on the multijet contribution is not included. In the ratio, the statistical uncertainty from the data is included on the points, while the statistical uncertainty on the total estimated background is included in the band.
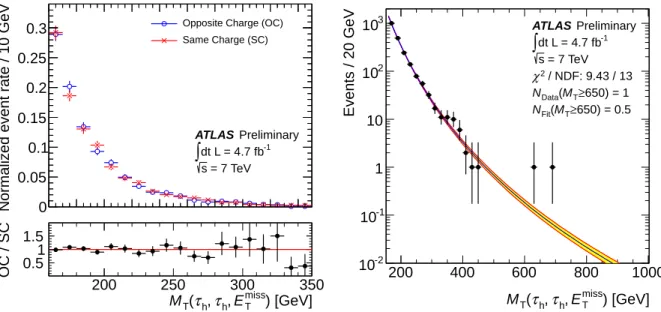
4.2 Multijet background
The shape of the M
Tdistribution for the multijet background is modeled using events in a control region that pass the standard event selection, but have two selected τ
hcandidates with the same electric charge and with M
T> 160 GeV. The M
Tthreshold is used to avoid the region affected by the τ
hp
Tthresholds.
The purity of the control region is very high, having only 0.8% contamination from other backgrounds
and negligible signal contamination. Figure 2 (left) shows a comparison of the M
Tdistribution after the
data total SM Z/γ
∗→ττ W(
→τν)+jet others Multijet Z
′(1250)
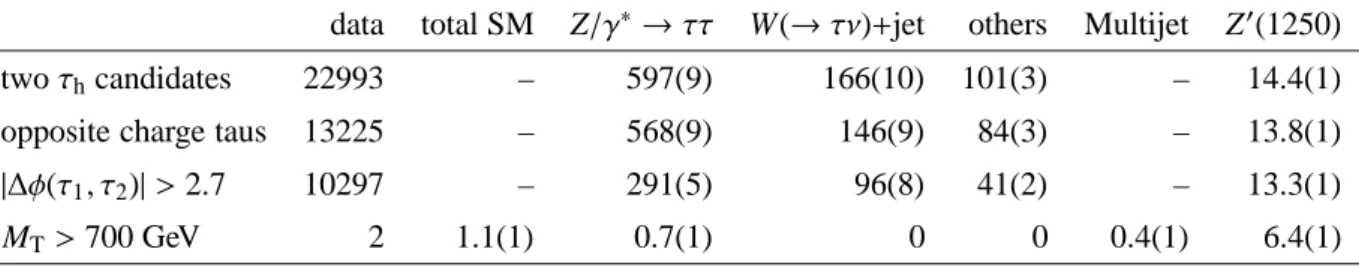
two τ
hcandidates 22993 – 597(9) 166(10) 101(3) – 14.4(1)
opposite charge taus 13225 – 568(9) 146(9) 84(3) – 13.8(1)
|∆φ(τ1
, τ
2)
|> 2.7 10297 – 291(5) 96(8) 41(2) – 13.3(1)
M
T> 700 GeV 2 1.1(1) 0.7(1) 0 0 0.4(1) 6.4(1)
Table 1: The number of events passing the selection criteria in the τ
hτ
hchannel, including the expected contributions from each background and an SSM Z
′signal with a mass of 1250 GeV. The multijet contribution is estimated only in the signal region, but is completely dominant before applying the M
Tthreshold. The statistical uncertainty arising from the limited size of the sim- ulated samples and the multijet control region is shown in parentheses.
event selection for opposite-charge (OC) and same-charge (SC) τ
hpairs, with the simulated contributions from other backgrounds subtracted. The comparison is made in the region M
T< 350 GeV, which is orthogonal to the signal regions. The agreement is reasonable given the statistical uncertainties. The M
Tdistribution is modeled by performing an unbinned maximum likelihood fit to the data in the control region using the following function:
f (M
T|p
0, p
1, p
2)
=p
0·M
Tp1+p2log MT.
This function has been shown to model the high-mass tail well using MC simulated dijet events. Figure 2 (right) shows the fit to data in the control region. The χ
2/NDF is good, and the integral of the fittedfunction in the tail matches the number of observed events well for any choice of the lower M
Tthreshold.
The statistical uncertainty is estimated using pseudo-experiments. In each pseudo-experiment, a pseudo- dataset is generated by randomly sampling N events from the fitted function, where N is the number of events observed in the control region. The pseudo-dataset is then re-fitted and the integral of the function in the signal region (N
SR) is recalculated. The uncertainty is quantified using the central 68% interval of the N
SRdistribution and ranges from 10–40% depending on the M
Tthreshold used to define the signal region.
The multijet model is normalized to data that pass all analysis requirements except the final M
Trequirement but have 160 < M
T< 200 GeV. These events have a 6% contamination from other back- grounds, which is subtracted, and negligible contamination from signal. The statistical uncertainty from the normalization is negligible compared to the statistical uncertainty from the model. Systematic uncer- tainties on the subtracted backgrounds are found to have a negligible effect.
5 Analysis of the µτ
hchannel
This channel requires one isolated muon and one hadronic tau decay with large combined M
T. The
main backgrounds are Z/γ
∗ →ττ, W+jets, t¯t and diboson production, with minor contributions from
Z(
→µµ)+jets, multijet and single top-quark events. The backgrounds involving fake hadronic tau de-
cays from multijet and W
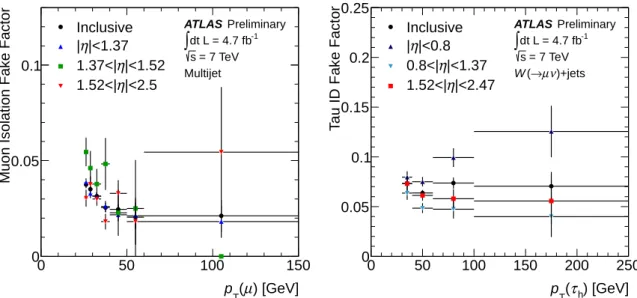
+jets events are modeled with data-driven techniques involving fake factors,which parameterize the rate for muons in jets to pass muon isolation or jets to fake tau identification,
respectively. The remaining backgrounds are estimated with MC simulation.
Normalized event rate / 10 GeV 0 0.05 0.1 0.15
0.2 0.25 0.3
ATLAS Preliminary dt L = 4.7 fb-1
∫
s = 7 TeV Opposite Charge (OC) Same Charge (SC)) [GeV]
miss
ET h, τ
h, τ
T( M
200 250 300 350
OC / SC 0.511.5
) [GeV]
miss
ET h, τ
h, τ
T( M
200 400 600 800 1000
Events / 20 GeV
10-2
10-1
1 10 102
103 ATLAS Preliminary
dt L = 4.7 fb-1
∫
s = 7 TeV / NDF: 9.43 / 13 χ2650) = 1
T≥ M
Data( N
650) = 0.5
T≥ M
Fit( N
Figure 2: Left: the transverse mass after the event selection in the τ
hτ
hchannel for opposite-charge and same-charge τ
hpairs with the simulated contributions of non-multijet backgrounds subtracted.
Both distributions are normalized to unity. Right: the fit to data in the control region used to model the multijet background shape. The band indicates the uncertainty estimated by the fitting algorithm.
5.1 Event selection
The µτ
hanalysis uses events passing a single muon trigger with a p
Tthreshold of 18 GeV. This trigger is supplemented by also accepting events that pass a single-muon trigger with a p
Tthreshold of 40 GeV that operates only in the barrel region but does not require a matching inner detector track. In addition, the following selection criteria are required:
•
exactly one muon with p
T> 25 GeV, passing an isolation requirement, such that the transverse energy in the electromagnetic and hadronic calorimeters in an annulus of radius 0.05 <
∆R< 0.2 around the muon direction must be less than 4% of the muon transverse momentum;
•
no additional preselected electrons with p
T> 15 GeV or muons with p
T> 4 GeV;
•
exactly one τ
hcandidate with one
2associated track and p
T> 35 GeV, which passes the medium BDT identification for rejecting jets, and passes a cut-based veto for rejecting muons;
• |∆φ(µ, τh
)
|> 2.7;
•
opposite electric charge between the µ and τ
h.
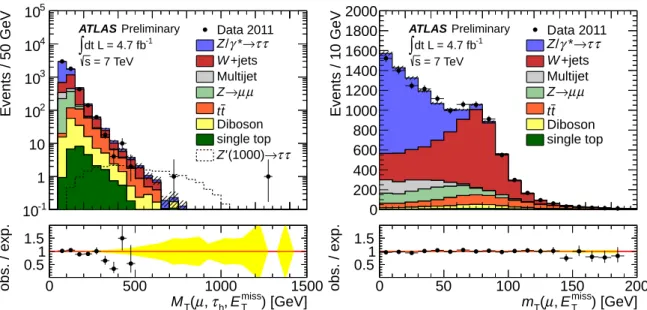
Figure 3 (left) shows the M
Tdistribution after the event selection. The search is performed by counting events with M
Tabove a threshold, optimized separately for each signal mass hypothesis to give the best expected exclusion limit. The M
Tthresholds are 400, 500, and 600 GeV for the mass points 500–625, 750–875, and
≥1000 GeV, respectively. Table 2 shows the number of events passing the selection criteria.
2Theµτhchannel does not select 3-prong tau decays because of the large background from W+jets, where 3-prong decays have a large fake rate.
Events / 50 GeV
10-1
1 10 102
103
104
105
ATLAS Preliminary dt L = 4.7 fb-1
∫
s = 7 TeVData 2011 τ
→τ γ* / Z
+jets W Multijet
µ µ
→ Z
t t Diboson single top
τ τ
→ (1000) Z’
) [GeV]
miss
ET h, τ µ,
T( M
0 500 1000 1500
obs. / exp.
0.51 1.5
Events / 10 GeV
0 200 400 600 800 1000 1200 1400 1600 1800 2000
ATLAS Preliminary dt L = 4.7 fb-1
∫
s = 7 TeVData 2011 τ τ
→ γ* / Z
+jets W Multijet
µ µ
→ Z
t t Diboson single top
) [GeV]
miss
ET
µ,
T( m
0 50 100 150 200
obs. / exp.
0.51 1.5
Figure 3: Left: the M
Tdistribution after event selection in the µτ
hchannel. The outlier event with M
T> 1 TeV was inspected in detail, and it is not a high quality signal candidate. The hadronic tau candidate is on the edge of the fiducial volume of the tracker and has a poor quality track.
Right: the transverse mass of the combination of the selected muon and the E
missT, m
T(µ, E
missT), in events with exactly one selected muon, no additional preselected electrons or muons, and exactly one selected 1-prong tau. The signal contamination is negligible. Statistical uncertain- ties are shown for both data and MC (hashed area).
data total SM Z→ττ W+jets multijet Z→µµ t¯t diboson single top Z′(1000)
oneµ, oneτh 11892 11989(48) 3976(36) 4980(21) 594(5) 945(21) 1029(7) 352(4) 114(3) 18.7(2)
|∆φ(µ, τh)|>2.7 6192 6110(39) 2909(32) 1837(14) 409(4) 567(18) 233(3) 126(2) 28(2) 17.9(2) opposite signµandτh 5424 5384(38) 2863(31) 1467(13) 217(3) 478(16) 219(3) 115(2) 26(1) 17.6(2) MT>300 GeV 36 55(2) 7.5(2) 18(2) 0.6(1) 0.3(2) 18.5(9) 7.0(6) 3.3(5) 14.1(2) MT>400 GeV 14 15(1) 2.37(5) 4.9(8) 0.15(7) 0.1(1) 4.6(4) 1.9(2) 1.0(3) 11.1(2) MT>500 GeV 2 4.6(5) 0.85(3) 1.6(5) 0.02(2) <0.1 1.2(2) 0.7(1) 0.3(2) 8.0(1) MT>600 GeV 2 1.4(3) 0.38(2) 0.3(2) <0.02 <0.1 0.3(1) 0.24(7) 0.2(1) 5.5(1)
Table 2: The number of events passing each step of the event selection of the µτ
hchannel, with the
expected contribution from each source of background and from a Z
′signal with a mass of
1000 GeV. The numbers in parentheses denote the statistical uncertainty in the least significant
digits.
5.2 Multijet background
The background from multijet events is negligible at high M
T, but it is important to estimate its contribu- tion at lower mass for modeling control regions. Multijet events are exceptional among the backgrounds because the muons produced in jets are typically not isolated in the calorimeter. To estimate the multijet background, events in the data that fail muon isolation are weighted event-by-event with fake factors for muon isolation, measured in a multijet-rich control region of the data. The multijet control region (multijet–CR) is defined by requiring exactly one selected muon (ignoring the isolation requirement); no additional preselected electrons or muons; at least one preselected hadronic tau candidate; zero selected 1-prong hadronic tau candidates; E
Tmiss< 15 GeV; the transverse mass between the muon and missing transverse momentum m
T(µ, E
missT) to be less than 30 GeV; and the transverse impact parameter of the muon ,
|d
0(µ)
|, to be greater than 0.08 mm. The muons in the multijet control region are divided into those that pass and those that fail the muon isolation requirement. Muon isolation fake factors, f
µ–iso, are defined as the number of isolated muons in the data, N
passµ–iso, divided by the number of non-isolated muons, N
failµ–iso, binned in p
Tand η:
f
µ–iso(p
T, η)
≡N
passµ–iso(p
T, η) N
failµ–iso(p
T, η)
multijet–CR
. (1)
The muon isolation fake factors are shown in Figure 4 (left). The number of multijet events passing muon isolation, N
multijet, is predicted by weighting the events that fail isolation by their fake factor:
N
multijet(p
T, η, x)
=f
µ–iso(p
T, η)
·N
datafailµ–iso(p
T, η, x)
−N
MCfailµ–iso(p
T, η, x)
. (2)
The shape of the multijet background in any kinematic variable, x
∈ {∆φ,M
T, . . .
}, is modeled from the events in the data with non-isolated muons, N
datafailµ–iso, corrected by subtracting the expected contamina- tion of electroweak processes predicted with Monte Carlo, N
MCfailµ–iso. This correction is approximately 5% of the number of isolated muons and negligible for the number of non-isolated muons.
This method assumes that the ratio of the number of isolated muons to the number of non-isolated muons in multijet events is not strongly correlated with the cuts used to enrich the multijet control sample.
This assumption has been verified by varying the d
0(µ) cut used to define the multijet control region, but a conservative 100% systematic uncertainty on the isolation fake factor is assumed, which has negligible effect on the final limit because the multijet background is less than a hundredth of an event compared to the total SM background of 1.4
±0.3 events.
5.3 W + jets background
The W+jets background is estimated using a technique similar to the multijet estimate, where hadronic tau candidates that fail the BDT-based identification are weighted event-by-event by fake factors for jets to fake tau identification in W
+jets events. A high purity W+jets control region (W–CR) is definedby selecting events that have exactly one selected muon, no additional preselected muons or electrons, at least one preselected hadronic tau candidate, and transverse mass of the muon and missing transverse momentum, m
T(µ, E
missT), between 70 and 200 GeV. The hadronic tau candidates in this region are divided into those that pass and those that fail the medium BDT tau identification. Tau identification fake factors, f
τ, are defined as the number of hadronic tau candidates that pass identification, N
passτ−ID, divided by the number that fail, N
failτ−ID, binned in p
Tand η:
f
τ(p
T, η)
≡N
passτ−ID(p
T, η) N
failτ−ID(p
T, η)
W–CR
. (3)
) [GeV]
µ
T( p
0 50 100 150
Muon Isolation Fake Factor
0 0.05 0.1
ATLAS Preliminary dt L = 4.7 fb-1
∫
s = 7 TeV MultijetInclusive
|<1.37 η
|
|<1.52 η 1.37<|
|<2.5 η 1.52<|
) [GeV]
τh T( p
0 50 100 150 200 250
Tau ID Fake Factor
0 0.05 0.1 0.15 0.2 0.25
ATLAS Preliminary dt L = 4.7 fb-1
∫
s = 7 TeV )+jets ν µ→ ( W
Inclusive
|<0.8 η
|
|<1.37 η 0.8<|
|<2.47 η 1.52<|
Figure 4: Left: muon isolation fake factors derived in the multijet control region. Right: tau identifica- tion fake factors derived in the W(
→µν) control region. The error bars indicate the statistical uncertainties.
The tau identification fake factors are shown in Figure 4 (right). The number of W
+jets events passingtau identification, N
W+jets, is predicted by weighting the events that fail tau identification by their fake factor:
N
W+jets(p
T, η, x)
=f
τ(p
T, η)
·N
datafailτ−ID(p
T, η, x)
−N
multijetfailτ−ID(p
T, η, x)
−N
MCfailτ−ID(p
T, η, x)
. (4)
The shape of the W
+jets background in any kinematic variable, x, is modeled using events in the data thatfailed tau identification, N
datafailτ−ID, with the multijet estimate, N
multijetfailτ−ID, and MC modeling of the other contaminations, N
failMCτ−ID, subtracted. Figure 3 (right) shows the distribution of m
T(µ, E
Tmiss), demon- strating that the W
+jets model, combined with the estimates of the other backgrounds, agrees well withthe data.
A 30% systematic uncertainty on the fake factors is assigned by comparing the fake factors to those measured in a data sample enriched in Z(
→µµ)+jets instead of W
+jets, which provides a sample of jetswith a similar quark/gluon fraction [38]. This background estimation method relies on the assumption that the tau identification fake factors for W
+jets events are not strongly correlated with the selectionused to define the W+jets control region. This assumption was verified by varying the m
Tcut used to define the W
+jets control region, resulting in a few percent variation that is well within the systematicuncertainty.
6 Analysis of the eµ channel
This analysis relies on the detection of one isolated electron and one isolated muon with a large combined M
T. The dominant backgrounds in the signal region are Z/γ
∗→ττ, t¯t and diboson production. Contribu- tions from background processes such as W
+jets, W+γand Z(
→µµ)+jets where a jet is misidentified as an electron are very small in the signal region. Multijet events are suppressed by tight isolation criteria.
Since backgrounds involving fake leptons make only minor contributions, all backgrounds are estimated
from MC simulation. The MC estimates of the dominant backgrounds are checked using high-purity
control regions.
6.1 Event selection
The eµ analysis uses the same trigger as the µτ
hanalysis. To suppress the presence of electrons and muons produced in jets, selected leptons are required to be isolated in the calorimeter as defined in Section 5.1, where the isolation requirement for electrons is less than 6% of the electron transverse energy. Additionally, the sum of the transverse momenta of associated tracks with p
Tabove 1 GeV and located within a cone of radius
∆R =0.4 around the lepton direction must be less than 8% of the transverse energy for electrons, or 6% of the transverse momentum for muons. The following event selection criteria are required:
•
one isolated muon with p
T> 25 GeV and one isolated electron with p
T> 35 GeV;
•
no additional preselected electrons with p
T> 15 GeV or muons with p
T> 10 GeV;
•
not more than one jet;
•
p
visζ< 10 GeV, where p
visζ =p ~
Te·ζ ˆ
+p ~
Tµ·ζ ˆ and ˆ ζ is a unit vector along the bisector of the visible tau decay products. This requirement selects eµ pairs that are back-to-back in the transverse plane;
• |∆φ(ℓ,
E
missT)
|> 2.6, where ℓ denotes the leading-p
Telectron or muon.
Figure 5 shows the M
Tdistribution after the event selection. The search is performed by counting events with M
Tabove a lower threshold, optimized separately for each signal mass hypothesis to give the best expected exclusion limit. The M
Tthresholds are 300, 350, and 500 GeV for the mass points 500, 625–
875, and
≥1000 GeV, respectively. Table 3 shows the number of events passing the selection criteria.
Events / 40 GeV
10-1
1 10 102
103
ATLAS Preliminary dt L = 4.7 fb-1
∫
s = 7 TeV Data 2011 Dibosonτ τ
→ γ* / Z
t t
+jets W→µµ Z
τ τ
→ (750) Z’
) [GeV]
miss
ET
µ, , e
T( M
0 500 1000 1500
obs. / exp.
0.51 1.5
Figure 5: The M
Tdistribution after the event selection in the eµ channel. The estimated contributions from SM processes are stacked and the observed events in data and contributions from hypo- thetical signal processes are overlaid. Statistical uncertainties are shown for both data and MC (hashed area).
6.2 Cross-checks of simulated backgrounds
As the dominant backgrounds produce real leptons, they are estimated using MC simulation. The model-
ing is checked by comparing simulated kinematic distributions to data in control regions that are of high
data total SM t¯t diboson Z/γ∗→ττ W+jets Z(→µµ)+jets Z′(750) one e, oneµ 6115 6255(25) 3981(12) 1200(5) 648(12) 293(15) 133(8) 35.3(6) N(jets)≤1 2615 2797(20) 701(5) 1073(4) 568(11) 202(13) 118(8) 30.5(5) pvisζ <10 GeV 682 667(13) 63(2) 169(2) 364(10) 34(6) 55(6) 21.2(4)
|∆φ(ℓ, ETmiss)|>2.6 197 216(9) 13(1) 55(1) 116(5) 25(7) 12(2) 16.2(4) MT >350 GeV 5 3.6(3) 1.0(2) 1.7(2) 0.56(2) 0.33(4) 0.06(1) 6.8(2)
Table 3: The number of events passing each step of the event selection of the eµ channel, with the expected contribution from each source of background and from a Z
′signal with a mass of 750 GeV. The numbers in parentheses denote the statistical uncertainty in the least significant digits.
purity in each background. The requirements of each control region are
•
t¯t: remove the p
visζand
∆φ(ℓ,E
missT) selection and require at least three jets;
•
diboson: remove the
∆φ(ℓ,E
missT) selection and require no jets and p
visζ> 10 GeV;
•
Z/γ
∗→ττ: remove the
∆φ(ℓ,E
missT) selection and require no jets and M
T< 200 GeV.
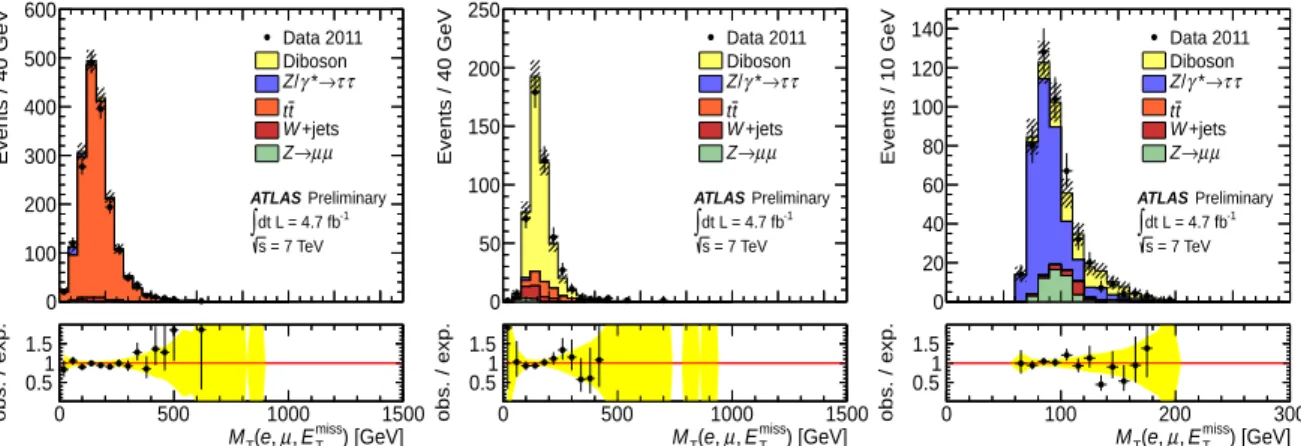
Figure 6 shows the M
Tdistribution in each control region.
To reduce the statistical uncertainty in the MC on the W+jets and Z(
→µµ)+jets backgrounds (which have low event counts in the signal region), they are estimated by requiring a loose electron identification selection, as described in Ref. [29]. The resulting M
Tdistributions after the object selection are normal- ized to the total number of events of the respective background after the full selection. The multijet background is found to be negligible.
Events / 40 GeV
0 100 200 300 400 500 600
ATLAS Preliminary dt L = 4.7 fb-1
∫s = 7 TeV Data 2011 Diboson
τ τ
→ γ* / Z
t t
+jets W
µ µ
→ Z
) [GeV]
miss
ET
µ, , e
T( M
0 500 1000 1500
obs. / exp.
0.51 1.5
Events / 40 GeV
0 50 100 150 200 250
ATLAS Preliminary dt L = 4.7 fb-1
∫s = 7 TeV Data 2011 Diboson
τ τ
→ γ* / Z
t t
+jets W
µ µ
→ Z
) [GeV]
miss
ET
µ, , e
T( M
0 500 1000 1500
obs. / exp.
0.51 1.5
Events / 10 GeV
0 20 40 60 80 100 120 140
ATLAS Preliminary dt L = 4.7 fb-1
∫s = 7 TeV Data 2011 Diboson
τ τ
→ γ* / Z
t t
+jets W
µ µ
→ Z
) [GeV]
miss
ET
µ, , e
T( M
0 100 200 300
obs. / exp.
0.51 1.5
Figure 6: Left, middle and right: transverse mass distributions in the t¯t, diboson and Z/γ
∗→ττ control regions, respectively. Statistical uncertainties are shown for both data and MC (hashed area).
7 Systematic uncertainties
Theoretical systematic uncertainties on the cross sections of simulated processes are considered. Exper-
imental uncertainties on the trigger, reconstruction and identification efficiencies of electrons, muons,
τ
hdecays, jets and E
missT, as well as on the integrated luminosity are also considered. For each source
of uncertainty, the correlations across analysis channels, as well as the correlations between signal and background, are taken into account.
The overall uncertainty on the Z/γ
∗→ττ background due to parton distribution functions (PDFs), α
Sand scale variations is estimated to be 12% at 1.5 TeV, dominated by PDF uncertainty [11]. Additionally, a systematic uncertainty of 10% is attributed to electroweak corrections [39]. An uncertainty of 4–5% is assumed for the inclusive cross section of the single gauge boson and diboson production mechanisms and a relative uncertainty of 24% is added in quadrature per additional jet
3. For t¯t and single top-quark production, the QCD scale uncertainties are in the range of 3–6% [42–44]. The uncertainties related to the proton PDFs amount to 8% for the predominantly gluon-initiated processes such as t¯t and 4% for the predominantly quark-initiated processes such as single gauge boson and diboson production [45–48].
These numbers include the systematic uncertainty arising from the choice of different sets of PDFs.
The uncertainty on the integrated luminosity is 3.9% [49,50]. Scale factors for the trigger efficiencies of electron, muon and hadronic tau triggers are obtained from data and applied to the Monte Carlo simulations. The associated systematic uncertainties are typically 1–2% for electrons and muons, 2.5%
for the ditau trigger and 5% for the high-p
Tsingle-tau trigger. Differences between data and Monte Carlo simulations in the reconstruction and identification efficiencies of electrons, muons, and hadronic tau decays are taken into account, as well as the differences in the momentum scales and resolutions.
The associated uncertainties for muons and electrons are typically <1%.
The systematic uncertainties on the identification of hadronic tau decays are estimated at low-p
Tfrom data samples enriched in W
→τν and Z/γ
∗→ττ events. At high p
T, there are no abundant sources of real hadronic tau decays to make an efficiency measurement. Rather, the rate of jets to fake hadronic tau decays is studied in high-p
Tdijet events as a function of the jet p
T, which indicates that there is no degradation in the modeling of the detector response as a function of p
T(τ
h). From these studies, an efficiency uncertainty of up to 8% is assigned to high-p
Tτ
hcandidates. The energy scale uncertainty on τ
hand jets is evaluated based on the single-hadron response in the calorimeters [33, 51]. In addition, the τ
henergy scale is validated in data samples enriched in Z/γ
∗→ττ events. The systematic uncertainties related to the jet and tau energy scale and resolution are functions of η and p
Tand are generally near 3%.
These uncertainties are treated as correlated. Energy scale and resolution uncertainties on all objects are propagated to the E
Tmisscalculation. Uncertainty on the E
missTdue to soft clusters has a negligible effect in all channels.
Table 4 summarizes the systematic uncertainties in each channel. For the τ
hτ
hchannel the dominant uncertainty on the background comes from the multijet shape estimation and the tau energy scale un- certainty on Z/γ
∗→ττ, while the dominant uncertainty on the signal comes from the tau identification efficiency. For the µτ
hchannel, the dominant uncertainty on the background comes from the statistics and the fake factor estimate of the W
+jets background, while the dominant uncertainty on the signalcomes from the tau identification efficiency. For the eµ channel, the dominant uncertainty on the signal is the luminosity while on the backgrounds it is the statistical uncertainty on the MC samples.
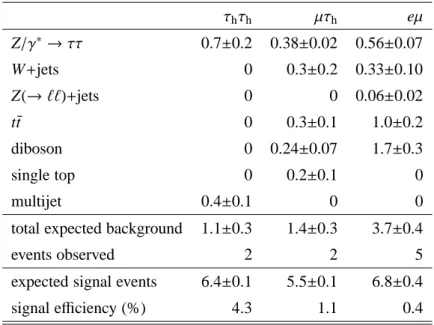
8 Statistical combination
Table 5 summarizes the number of observed and expected events, along with their total uncertainties, for all channels. The number of observed events is consistent with the expected Standard Model back- ground, therefore upper limits are set on the production of a high-mass resonance decaying to τ
+τ
−pairs.
The statistical combination of the channels employs a likelihood function constructed as the product of Poisson probability terms describing the total number of events observed in each channel. The Poisson probability in each channel is evaluated for the observed number of data events given the signal plus
3This is the irreducible Berends-scaling uncertainty [40, 41].
τ
hτ
hµτ
heµ sig. bkg. sig. bkg. sig. bkg.
expected number of events 6.4 1.1 5.5 1.4 6.8 3.7 Uncertainties (%)
statistical uncertainty negl. 5 2 20 3 7
trigger efficiency 4 3 negl. negl. negl. negl.
e efficiency – – – – negl. 3
e energy scale – – – – negl. 2
τ
hID efficiency 15 9 10 4 – –
τ
h3-prong reco. eff. 4 3 – – – –
jet
→τ
hfake rate – negl. – 3 – –
e
→τ
hfake rate – – – 16 – –
jet energy scale 5
+20−106 6 negl. 4
jet energy resolution negl. negl. negl. 2 negl. negl.
theoretical cross sections – 8 – 5 – 5
luminosity 4 3 4 3 4 4
multijet shape –
+10−12– – – –
τ
hfake factor – – – 6 – –
Table 4: Expected number of signal and background events and their associated uncertainties (in per- cent) for each channel. Signal masses of 1250, 1000 and 750 GeV are used in the τ
hτ
h, µτ
hand eµ channels, respectively. A dash denotes that the uncertainty is not applicable. Negligible entries (negl.) are typically
∼0.5% and always less than 2%. Rows that contain only negligible entries are omitted. The statistical uncertainty corresponds to the uncertainty due to limited sample size of the MC and control regions.
background expectation. Systematic uncertainties on the expected number of events are incorporated into the likelihood via Gaussian distributed nuisance parameters. Correlations across channels are taken into account. A signal strength parameter multiplies the expected signal in each channel, for which a uniform prior probability distribution is assumed.
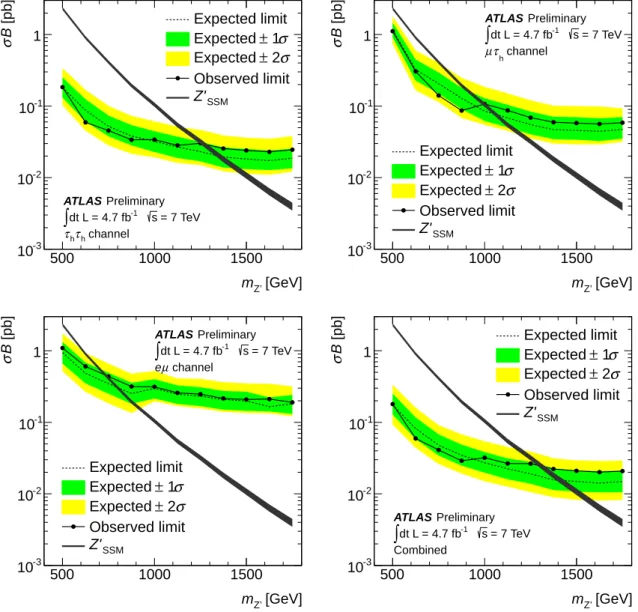
Bayesian credibility intervals are determined leading to 95% CL upper limits on the cross section
times branching fraction for a high-mass resonance decaying into a τ
+τ
−pair as a function of the res-
onance mass, using the Bayesian Analysis Toolkit [52]. Figure 7 shows the limits for the individual
channels and for the combination. The resulting 95% CL lower limit on the mass of a SSM Z
′decaying
to τ
+τ
−pairs is 1.3 TeV. The expected limit is 1.4 TeV. The observed and expected limits in the individual
channels are, respectively: 1.25 and 1.35 TeV for τ
hτ
h; 1.00 and 1.05 TeV for µτ
hand 0.75 and 0.80 TeV
for eµ. Figures 8 and 9 show event displays of high-M
Tevents in the τ
hτ
hand µτ
hchannels.
[GeV]
mZ’
500 1000 1500
[pb]Bσ
10-3
10-2
10-1
1
ATLAS Preliminary dt L = 4.7 fb-1
∫
s = 7 TeVchannel τh
τh
Expected limit σ
± 1 Expected
σ
± 2 Expected Observed limit Z’SSM
[GeV]
mZ’
500 1000 1500
[pb]Bσ
10-3
10-2
10-1
1
ATLAS Preliminary dt L = 4.7 fb-1
∫
s = 7 TeVchannel τh
µ
Expected limit σ
± 1 Expected
σ
± 2 Expected Observed limit Z’SSM
[GeV]
mZ’
500 1000 1500
[pb]Bσ
10-3
10-2
10-1
1
ATLAS Preliminary dt L = 4.7 fb-1
∫
s = 7 TeVchannel µ e
Expected limit σ
± 1 Expected
σ
± 2 Expected Observed limit Z’SSM
[GeV]
mZ’
500 1000 1500
[pb]Bσ
10-3
10-2
10-1
1
ATLAS Preliminary dt L = 4.7 fb-1
∫
s = 7 TeVCombined
Expected limit σ
± 1 Expected
σ
± 2 Expected Observed limit Z’SSM
Figure 7: Top left, top right and bottom left: expected and observed 95% CL upper limits on the cross section times τ
+τ
−branching fraction, σB, as a function of the Z
′mass, for the τ
hτ
h, µτ
hand eµ channels, respectively. The expected SSM Z
′production cross section is also included.
The thickness of the line represents the theoretical uncertainty on the production cross section.
Bottom right: the combined limit excludes Z
′masses up to 1.3 TeV, with an expected limit of
1.4 TeV.
τ
hτ
hµτ
heµ Z/γ
∗→ττ 0.7
±0.2 0.38
±0.02 0.56
±0.07
W+jets 0 0.3
±0.2 0.33
±0.10
Z(
→ℓℓ)+jets 0 0 0.06
±0.02
t¯t 0 0.3
±0.1 1.0
±0.2
diboson 0 0.24
±0.07 1.7
±0.3
single top 0 0.2
±0.1 0
multijet 0.4
±0.1 0 0
total expected background 1.1
±0.3 1.4
±0.3 3.7
±0.4
events observed 2 2 5
expected signal events 6.4
±0.1 5.5
±0.1 6.8
±0.4
signal efficiency (%) 4.3 1.1 0.4
Table 5: Number of expected and observed events in selected signal regions for each analysis channel.
The expected contribution from the signal in each channel is calculated for the mass point
closest to the Z
SSM′exclusion limit: 1250 GeV for τ
hτ
h, 1000 GeV for µτ
hand 750 GeV for
eµ. The signal regions corresponding to these mass points are used. The total uncertainties on
each estimated contribution are shown. The signal efficiency denotes the expected signal events
divided by the product of the Z
SSM′cross section and the integrated luminosity.
3-prong τh
pT = 304 GeV
1-prong τh
pT = 401 GeV
ETmiss = 91 GeV
MT = 796 GeV