ATLAS-CONF-2013-060 27/06/2013
ATLAS NOTE
ATLAS-CONF-2013-060
June 21, 2013
Minor revision: June 27, 2013
Search for pair production of a heavy top-like quark decaying to a high- p
TW boson and a b quark in the lepton plus jets final state in pp collisions at
√ s = 8 TeV with the ATLAS detector
The ATLAS Collaboration
Abstract
A search is presented for production of a heavy top-like quark (T ) together with its antiparticle, assuming a significant branching ratio for subsequent decay into a W boson and a b quark. The search is based on 14.3 fb
−1of pp collisions at
√s
=8 TeV recorded in 2012 with the ATLAS detector at the CERN Large Hadron Collider. Data are analysed in the lepton+jets final state, characterised by a high-transverse-momentum isolated electron or muon, large missing transverse momentum and at least four jets, with at least one of them b tagged. The analysis strategy relies on the substantial boost of the W bosons in the T ¯ T signal when m
T &400 GeV. No significant excess of events above the Standard Model expectation is observed. For a chiral fourth generation quark, and under the assumption of a branching ratio BR(T
→Wb)
=1, a mass lower than 740 GeV is excluded at 95% CL.
For vector-like T quarks, and under the assumption that only the T
→Wb, T
→Zt and T
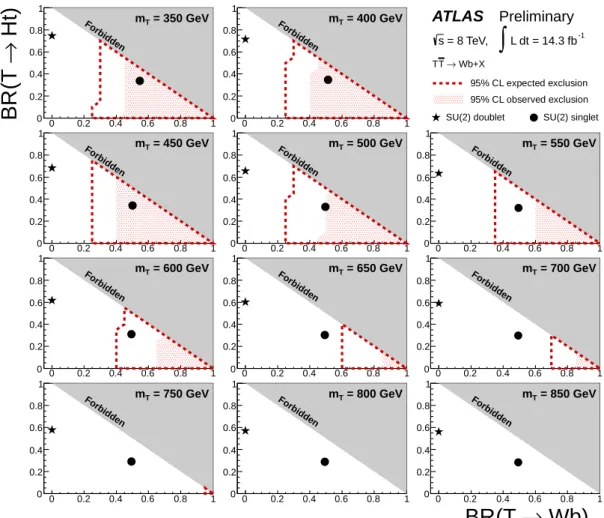
→Ht decay modes contribute, 95% CL upper limits are derived for various masses in the two-dimensional plane of BR(T
→Wb) versus BR(T
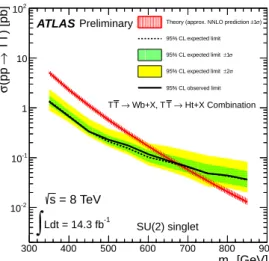
→Ht), where H is the Standard Model Higgs boson. These limits are significantly improved by combining this search with a previous search for T ¯ T
→Ht
+X, with H
→b¯b.
Minor correction in label of Figure 9 with respect to the version of June 21, 2013
c Copyright 2013 CERN for the benefit of the ATLAS Collaboration.
Reproduction of this article or parts of it is allowed as specified in the CC-BY-3.0 license.
1 Introduction
Since the discovery of the top quark [1,2], which completed the third generation of fundamental fermions in the quark sector of the Standard Model (SM) of particle physics, searches for heavier quarks have been of particular interest in high energy physics research. These quarks are often present in new physics models aimed at solving some of the limitations of the SM. Models with an extra family of heavy chiral fermions [3, 4] have been a prominent example for many years. In particular, these models can accom- modate new sources of CP violation that could explain the matter-antimatter asymmetry in the universe.
In the quark sector, the new weak-isospin doublet contains heavy up-type (T ) and down-type (B) quarks which are nearly degenerate in mass [5] and mix with the lighter quarks via an extended CKM matrix.
Based on the mixing pattern of the known quarks, it is natural to expect the mixing with third-generation quarks to fdominate and thus that T
→Wb and B
→Wt decays occur with nearly 100% branching ratio. The observation of a new scalar boson by the ATLAS [6] and CMS [7] Collaborations with a mass of
∼126 GeV and couplings close to those expected for the SM Higgs boson severely constrains min- imal perturbative fourth-generation models [5, 8, 9]. Despite being disfavored, the feature of dominant charged-current decays, also present in other extensions of the SM involving exotic heavy quarks, still make them useful benchmarks in the experimental searches.
Currently, a more compelling possibility is the addition of weak-isospin singlets, doublets or triplets of vector-like quarks [10], defined as quarks for which both chiralities have the same transformation properties under the electroweak group S U(2)
×U(1). Vector-like quarks appear in many extensions of the SM such as little Higgs [11–13] or extra-dimensional models [14, 15]. In these models, a top-partner quark, for simplicity referred to here as T , often plays a key role in cancelling the quadratic divergences in the Higgs boson mass induced by radiative corrections involving the top quark. Therefore, vector- like quarks are expected to mix preferentially with third generation and as a result they present a rich phenomenology. Under this assumption, a vector-like T quark has a priori three possible decay modes, T
→Wb, T
→Zt, and T
→Ht, with branching ratios that depend on m
Tand the weak-isospin quantum number of the T quark. While all three decay modes can be sizable for a weak-isospin singlet T quark with electric charge of 2/3, decays to only Zt and Ht are most natural for a doublet T quark.
In contrast, a doublet Y quark (following the naming convention in Ref. [10]) with charge
−4/3 would decay exclusively into W
−b, giving a signature experimentally indistinguishable from that of a chiral fourth-generation T quark
1. In the case of a triplet, the T quark can decay either as a singlet or a doublet depending on its hypercharge. The observation of a SM-like Higgs boson raises the level of interest in vector-like quark searches, as T
→Ht and B
→Hb decays now have completely specified final states.
In addition, it has been pointed out [16–18] that the mixing of the b quark with a B quark, the isospin partner of the Y quark, with mass as low as 700 GeV, could explain the anomalies in the A
bFBand R
bobservables in Z
→b¯b at LEP. This provides additional motivation to search for, not only the B quark, but also the Y quark.
The large centre-of-mass energy (
√s) and integrated luminosity in proton-proton (pp) collisions pro- duced at the CERN Large Hadron Collider (LHC) offer a unique opportunity to probe these models. At the LHC, these exotic heavy quarks would be produced predominantly in pairs via the strong interaction for masses below O(1 TeV) [10], with sizable cross sections and clean experimental signatures.
Most searches for T ¯ T production by the ATLAS and CMS collaborations using pp collision data at
√s
=7 TeV focused on the T
→Wb decay mode, exploiting both the lepton+jets signature [19, 20], where one of the W bosons decays leptonically and the other hadronically, and the dilepton signature [21, 22], where both W bosons decay leptonically. These searches make the assumption that BR(T
→Wb)
=1, which is reasonable for a chiral fourth generation T quark, but unrealistic in general in the case of vector-like quark models. Under this assumption, the most restrictive lower limit obtained on the mass
1Information on b jet charge is not yet being used in these experimental searches.
of a T quark is m
T >656 GeV at 95% confidence level (CL) [19]. The CMS Collaboration has also used the lepton+jets signature to search for the T
→Zt decay mode, also under the assumption that BR(T
→Zt)
=1 [23]. The limits derived by these searches can not easily be applied to other branching ratio values, due to the potentially large expected signal contamination from mixed decay modes. A consistent treatment of those additional signal contributions is thus necessary to set quasi-model independent limits on the plane of BR(T
→Ht) vs BR(T
→Wb) as a function of m
T. The branching ratio BR(T
→Zt) is fixed by the assumption that BR(T
→Zt)
=1
−BR(T
→Wb)
−BR(T
→Ht). Such an analysis was done by the ATLAS Collaboration [19] using a search for T ¯ T
→WbWb at
√s
=7 TeV [19]. More recently, a search for T ¯ T
→Ht
+X, with H
→b¯b, was performed by the ATLAS Collaboration [24]
using 14.3 fb
−1of data at
√s
=8 TeV. This search was particularly sensitive to T quark decays with large branching ratio to Ht and set the most restrictive limits to date on the plane of BR(T
→Ht) vs BR(T
→Wb) as a function of m
T. In particular, under the branching ratio assumptions corresponding to a weak-isospin doublet (singlet) scenario, a T quark with mass lower than 790 (640) GeV was excluded at the 95% confidence level.
In this note a search is presented for T ¯ T production using 14.3 fb
−1of pp collision data at
√s
=8 TeV collected with the ATLAS detector. The search is optimized for T quark decays with large branch- ing ratio to Wb, thus being complementary to that in Ref. [24]. Events are selected in the lepton+jets channel, requiring a high transverse momentum isolated electron or muon, large missing transverse mo- mentum and at least four jets. Following the strategy advocated in Refs. [25–27], and implemented in Ref. [19], further background suppression is achieved by making additional kinematic requirements that exploit the distinct topology of signal events, which involve W bosons with substantial boost. The result of the search is interpreted both in the context of a chiral fourth-generation T quark, as well as more generically in the context of vector-like quark models.
This note is organised as follows. After a brief overview of the ATLAS detector in Section 2, the main physics objects used in this search, as well as the dataset and event preselection requirements made are discussed in Sections 3 and 4, respectively. Section 5 summarises the simulated samples used for signal and backgrounds, while Section 6 is devoted to the background predictions based on data-driven techniques. The final event selection is presented in Section 7 and the procedure to reconstruct the mass of the T quark, which is the final discriminating variable used in this search, is given in Section 8. A discussion of the systematic uncertainties considered in this search is given in Section 9. The statistical analysis and results obtained are presented in Sections 10 and 11, respectively. Finally, a summary is given in Section 12.
2 ATLAS Detector
The ATLAS detector [28] consists of the following main subsystems: an inner tracking system sur- rounded by a superconducting solenoid, electromagnetic and hadronic calorimeters, and a muon spec- trometer. The inner detector provides tracking information from pixel and silicon microstrip detectors in the pseudorapidity
2range
|η| <2.5 and from a transition radiation tracker covering
|η| <2.0, all immersed in a 2 T magnetic field provided by a superconducting solenoid. The electromagnetic (EM) sampling calorimeter uses lead and liquid-argon (LAr) and is divided into barrel (
|η| <1.475) and end- cap (1.375
< |η| <3.2) regions. Hadron calorimetry is based on two different detector technologies,
2ATLAS uses a right-handed coordinate system with its origin at the nominal interaction point (IP) in the centre of the detector and the z-axis coinciding with the axis of the beam pipe. The x-axis points from the IP to the centre of the LHC ring, and they-axis points upward. Cylindrical coordinates (r,φ) are used in the transverse plane,φbeing the azimuthal angle around the beam pipe. The pseudorapidity is defined in terms of the polar angleθasη=−ln tan(θ/2). For the purpose of the fiducial selection, this is calculated relative to the geometric centre of the detector; otherwise, it is relative to the reconstructed primary vertex of each event.
with scintillator tiles or LAr as active media, and with either steel, copper, or tungsten as the absorber material. The calorimeters cover
|η| <4.9. The muon spectrometer measures the deflection of muon tracks within
|η| <2.7 using multiple layers of high-precision tracking chambers located in a toroidal field of approximately 0.5 T and 1 T in the central and end-cap regions of ATLAS, respectively. The muon spectrometer is also instrumented with separate trigger chambers covering
|η|<2.4.
3 Object Reconstruction
The main physics objects considered in this search are electrons, muons, jets, b jets and missing trans- verse momentum. A brief summary of the main identification criteria applied for each of these physics objects is given below.
Electron candidates [29] are reconstructed from energy deposits (clusters) in the EM calorimeter that are associated to reconstructed tracks in the inner detector. They are required to have a transverse energy, E
T, greater than 25 GeV (where E
T =E
cluster/cosh
ηtrack) and
|ηcluster| <2.47 (where
|ηcluster|is the pseudorapidity of the cluster associated with the electron candidate). Candidates in the calorimetry transition region 1.37
<|ηcluster|<1.52 are excluded. The longitudinal impact parameter of the electron track with respect to the selected event primary vertex (see Section 4), z
0, is required to be less than 2 mm. Electrons are required to be separated by
∆R>0.4 from any selected jet (see below). To reduce the background from non-prompt electrons, i.e. from decays of hadrons (including heavy flavour) produced in jets, electron candidates are required to be isolated. An
η-dependent, 90% efficient isolation cut,based on the energy sum of cells around the direction of each candidate, is made for a cone of radius R
= p(∆φ)
2+(∆η)
2 =0.2. This energy sum excludes cells associated with the electron cluster and is corrected for leakage from the electron cluster itself. A further 90% efficient isolation cut is made on the track transverse momentum (p
T) sum around the electron in a cone of radius R
=0.3.
Muon candidates are reconstructed from track segments in the various layers of the muon spectrom- eter, and matched with tracks found in the inner detector. The final candidates are refitted using the com- plete track information from both detector systems, and required to satisfy p
T >25 GeV and
|η| <2.5.
Muons are required to have a hit pattern in the inner detector consistent with a well-reconstructed track.
Analogously to the electrons, the muon track longitudinal impact parameter with respect to the primary vertex, z
0, is required to be less than 2 mm. Additionally, muons are required to be separated by
∆R>0.4 from any selected jet. Muons are required to satisfy a p
T-dependent track-based isolation requirement that has good performance even under high pileup conditions or in boosted configurations where the muon is close to a jet: the scalar sum of the track p
Tin a cone of variable radius R
=10 GeV/ p
µTaround the muon (excluding the muon track itself) must be less than 5% of the muon p
T.
Jets are reconstructed with the anti-k
talgorithm [30–32] with a radius parameter R
=0.4 from calibrated topological clusters [28] built from energy deposits in the calorimeters. Prior to jet finding, a local cluster calibration scheme [33, 34] is applied to correct the topological cluster energies for the effects of non-compensation, dead material and out-of-cluster leakage. The corrections are obtained from simulations of charged and neutral particles. After energy calibration [35], jets are required to have
p
T>25 GeV and
|η|<2.5.
To avoid selecting jets from additional pp interactions in the same bunch crossing, a selection on the so-called “jet vertex fraction” (JVF) variable above 0.5 is applied, representing a requirement that at least 50% of the sum of the p
Tof tracks with p
T >1 GeV associated with a jet, comes from tracks compatible with originating from the primary vertex.
Jets are identified as originating from the hadronisation of a b quark (b tagging) via an algorithm [36]
using multivariate techniques to combine information from the impact parameters of displaced tracks as well as topological properties of secondary and tertiary decay vertices reconstructed within the jet.
The working point used for this search corresponds to 70% efficiency to tag a b-quark jet, with a light-
jet rejection factor of
∼130 and a charm jet rejection factor of 5, as determined for b-tagged jets with p
T>20 GeV and
|η|<2.5 in simulated t¯t events.
The missing transverse momentum (E
missT) is used to estimate the transverse momentum of an as- sumed neutrino originating from the leptonic decay of one of the W bosons in the T ¯ T
→WbWb process.
E
Tmissis reconstructed by first matching each calorimeter energy cluster with a high-p
Tobject, either a reconstructed lepton or a jet. The energies of cells belonging to these clusters are corrected using the calibration constants associated with the high-p
Tobject. Clusters not associated with a high-p
Tob- ject are then calibrated for energy losses in un-instrumented regions and for different responses of the calorimeters to electromagnetic and hadronic shower components. This calibration scheme is similar to that described in Ref. [37]. E
missTis calculated from a vector sum of the calibrated cluster momenta, together with a term associated with muon momenta.
4 Event Preselection
This search is based on pp collision data at
√s
=8 TeV collected by the ATLAS experiment between April and October 2012. Only events collected using a single electron or muon trigger under stable beam conditions and for which all detector subsystems were operational are considered. The corresponding integrated luminosity is 14.3 fb
−1. Triggers with different p
Tthresholds are combined in a logical OR in order to maximise the overall efficiency. The p
Tthresholds are 24 or 60 GeV for electrons and 24 or 36 GeV for muons. The triggers with the lower p
Tthreshold include isolation requirements on the candidate lepton, resulting in inefficiencies at high p
Tthat are recovered by the triggers with higher p
Tthreshold. The triggers use similar but looser selection criteria to the final reconstruction requirements.
Events accepted by the trigger are required to have at least one reconstructed vertex with at least five associated tracks, consistent with the beam collision region in the x
−yplane. If more than one vertex is found, the primary vertex is taken to be the one which has the largest sum of the squared transverse momenta of its associated tracks.
Events are required to have exactly one reconstructed electron or muon firing the trigger and at least four jets satisfying the quality and kinematic criteria discussed in Section 3. In addition, at least one b- tagged jet is required. The background from multijet production is suppressed by a requirement on E
missTas well as on the transverse mass
3of the lepton and E
missT(m
T). For both electron and muon channels the requirements are E
missT >20 GeV and E
Tmiss+m
T>60 GeV. Finally, events with
≥6 jets and
≥3 b-tagged jet are rejected, in order to avoid overlap with the events selected by a recent search for T ¯ T
→Ht
+X, with H
→b¯b [24].
5 Background and Signal Modelling
After event preselection the main background is t¯t+jets production, with the production of a W boson in association with jets (W
+jets) and multijet events contributing to a lesser extent. Small contributionsarise from single top quark, Z+jets and diboson (WW
,WZ, ZZ) production, as well as from the associ- ated production of a vector boson and a t¯t pair. Multijet events contribute to the selected sample via the misidentification of a jet or a photon as an electron or the presence of a non-prompt lepton, e.g. from a semileptonic b- or c-hadron decay, and the corresponding yield is estimated via data-driven meth- ods [38]. For the W
+jets background, predictions for the shape of kinematic variables are obtained fromthe simulation but the normalisation is determined from the data, using the predicted asymmetry between W
++jets and W−+jets production in pp collisions [39], and separating the events into categories based3mT = q
2pℓTEmissT (1−cos∆φ), where pℓT is the transverse momentum (energy) of the muon (electron) and ∆φis the azimuthal angle separation between the lepton and the direction of the missing transverse momentum.
on the multiplicity of b and c jets. Details of the estimation of the multijet and W+jets backgrounds are given in Section 6. The rest of the backgrounds, as well as the signal, are estimated from the simulation and normalised using their theoretical cross sections. In the case of the t¯t+jets background prediction, further corrections to match the data are applied, as discussed in Section 7.
Simulated samples of t¯t and single top quark backgrounds (in the s channel and for the associated production with a W boson) are generated with MC@NLO v4.01 [40–42] using the CT10 set of parton distribution functions (PDFs) [43]. In the case of t channel single top quark production, the A
cerMC v3.8 leading-order (LO) generator [44] with the MRST LO** PDF set [45] is used. The parton-shower and fragmentation steps are performed by H
erwigv6.520 [46] in the case of MC@NLO, and by P
ythia6.421 [47] in the case of A
cerMC. These samples are generated assuming a top quark mass of 172.5 GeV and are normalized to approximate next-to-next-to-LO (NNLO) theoretical cross sections [48–51]. The t¯t cross section used is
σt¯t=238
+22−24pb, and has been computed with H
athor1.2 [48] using the MSTW2008 NNLO PDF set [52]. The total uncertainty results from the sum in quadrature of the scale and PDF+α
Suncertainties according to the MSTW prescription [53].
Samples of W/Z+jets events are generated with up to five additional partons using the A
lpgen v2.13 [54] LO generator and the CTEQ6L1 PDF set [55], interfaced to H
erwigv6.520 for parton show- ering and fragmentation. To avoid double-counting of partonic configurations in W/Z+jets events gener- ated by both the matrix-element calculation and the parton shower, a parton-jet matching scheme (“MLM matching”) [56] is employed. The W+jets samples are generated separately for W+light jets, Wb¯b+jets, Wc¯c+jets, and Wc+jets, and their relative contributions are normalized using the fraction of b-tagged jets in W
+1-jet and W+2-jets data control samples [57]. The Z+jets samples are generated separatelyfor Z+light jets, Zb¯b+jets, and Zc¯c+jets. The Z+jets background is normalized to the inclusive NNLO theoretical cross section [58]. Overlap between W/ZQ ¯ Q+jets (Q
=b, c) events generated from the matrix element calculation and those generated from parton-shower evolution in the W/Z+light jets samples is avoided via an algorithm based on the angular separation between the extra heavy quarks. The diboson backgrounds are modeled using H
erwigwith the MRST LO** PDF set, and are normalized to their NLO theoretical cross sections [59]. Samples of t¯tV (V
=W
,Z) are generated with the M
adgraph v5 LO gen- erator [60] and the CTEQ6L1 PDF set and are normalised to the NLO cross section predictions [61, 62].
Parton shower and fragmentation are modelled with P
ythia6.425. Samples of t¯tH are generated with the P
ythia6.425 [47] LO generator and the MRST LO** PDF set [45], assuming a Higgs boson mass of 125 GeV and considering the H
→b¯b, c¯c,
gg, and W+W
−decay modes. The t¯tH samples are normalised using the NLO theoretical cross section and branching ratio predictions [63]. The t¯tV and t¯tH samples are also generated assuming a top quark mass of 172.5 GeV.
For vector-like T signals, samples corresponding to a singlet T quark decaying to Wb, Zt and Ht are generated with the P
rotosv2.2 LO generator [10, 64] using the MSTW2008 LO PDF set, and interfaced to P
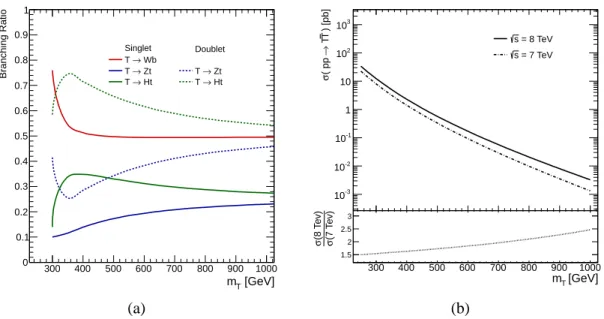
ythiafor the parton shower and fragmentation. The predicted branching ratios in the weak-isospin singlet and doublet scenarios as a function of m
Tare shown in Fig. 1a. The m
Tvalues considered range from 350 GeV to 850 GeV in steps of 50 GeV, and the Higgs boson mass is assumed to be 125 GeV.
All Higgs boson decay modes are considered, with branching ratios as predicted by
hdecay[65]. Signal samples are normalized to the approximate NNLO theoretical cross sections [48] using the MSTW2008 NNLO PDF set. The theoretical cross sections as a function of m
Tare shown in Fig. 1b.
All event generators using H
erwigare also interfaced to J
immyv4.31 [66] to simulate the underlying
event. With the exception of the P
rotossamples, all simulated samples utilise P
hotos2.15 [67] to model
photon radiation and T
auola1.20 [68] to model
τdecays. Finally, all simulated samples include multiple
pp interactions and are processed through a simulation [69] of the detector geometry and response using
G
eant4 [70], with the exception of the signal samples, for which a fast simulation of the calorimeter
response is used. All simulated samples are processed through the same reconstruction software as the
data. Additional corrections are applied so that the object identification efficiencies, energy scales and
[GeV]
mT
300 400 500 600 700 800 900 1000
Branching Ratio
0 0.1 0.2 0.3 0.4 0.5 0.6 0.7 0.8 0.9 1
Singlet Doublet
→ Wb T
→ Zt
T T → Zt
→ Ht
T T → Ht
300 400 500 600 700 800 900 1000
) [pb]T T→( pp σ
10-3
10-2
10-1
1 10 102
103
= 8 TeV s
= 7 TeV s
[GeV]
mT
300 400 500 600 700 800 900 1000
(7 Tev)σ(8 Tev)σ
1.5 2 2.5 3
(a) (b)
Figure 1:
(a) Branching ratios for T decay as a function of mT as computed with Protosin the weak-isospin singlet and doublet scenarios. (b) Theoretical cross sections at NNLO for T ¯T production in pp collisions at two center-of-mass energies, √s=7 TeV and √
s=8 TeV, as a function of mT as computed by Hathor. Also shown is the ratio of production cross sections between both center-of-mass energies.
energy resolutions match those determined in data control samples.
6 Data-Driven Background Estimates
The multijet and W+jets backgrounds are determined with data. The methods for these determinations are described in the following sections.
6.1 Multijet Background
Multijet events can enter the selected data sample through several production and mis-reconstruction mechanisms. In the electron channel, the multijet background consists of both non-prompt electrons and
“fake” electrons, where the latter includes both electrons from photon conversions and mis-identified jets with a high fraction of their energy deposited in the EM calorimeter. In the muon channel, the background contributed by multijet events is predominantly due to non-prompt muons, such as those from semileptonic b- or c-hadron decays.
The multijet background normalisation and shape are estimated directly from data by using the “Ma-
trix Method” (MM) technique [38]. The MM exploits differences in lepton identification-related proper-
ties between prompt, isolated leptons from W and Z boson decays (referred to as “real leptons” below)
and those where the leptons are either non-isolated or result from the mis-identification of photons or
jets. For this purpose, two samples are defined after imposing the final kinematic selection criteria, dif-
fering only in the lepton identification criteria: a “tight” sample and a “loose” sample, the former being
a subset of the latter. The tight selection employs the final lepton identification criteria used in the anal-
ysis. For the loose selection the lepton isolation requirements are omitted. The method assumes that the
number of selected events in each sample (N
looseand N
tight) can be expressed as a linear combination of
the numbers of events with real and fake leptons, in such a way that the following system of equations
applies:
N
loose =N
realloose+N
loosefake ,N
tight = ǫrealN
realloose+ǫfakeN
fakeloose,(1) where
ǫreal(ǫ
fake) represents the probability for a real (fake) lepton that satisfies the loose criteria to also satisfy the tight ones, and both are measured in data control samples. To measure
ǫrealsamples enriched in real leptons from W bosons decays are selected by requiring high E
Tmissor m
T. The average
ǫrealis
∼
0.75 (
∼0.98) in the electron (muon) channel. To measure
ǫfakesamples enriched in multijet background are selected by requiring either low E
missT(electron channel) or high impact parameter significance for the lepton track (muon channel). The average
ǫfakevalue is
∼0.35 (
∼0.20) in the electron (muon) channel.
Dependences of
ǫrealand
ǫfakeon quantities such as lepton p
Tand
η, ∆R between the lepton and theclosest jet, or number of b-tagged jets, are taken into account in order to obtain a more accurate estimate.
6.2 W+jets Background
The estimate of the W
+jets background is based on data for its normalisation and on the simulation forits shape. In proton-proton collisions W
+jets production is charge asymmetric. The total number ofW+jets events in data, N
W =N
W++N
W−, can be estimated based on the measured difference between the number of positively- and negatively-charged W bosons, (N
W+−N
W−)
meas, and the asymmetry predicted from the simulation:
N
W =N
W++N
W−N
W+−N
W−!
MC
(N
W+−N
W−)
meas.(2)
The simulation overestimates the number of W+jets events compared to the data-driven determi- nation by up to
∼20%, depending on the jet multiplicity. Corresponding scale factors to correct the prediction from the simulation have been derived [71] using Eq. (2) separately for W
+4 jets and W+≥5 jets events and are used in this analysis to calibrate the W
+jets background to data before b tagging.Scale factors for the fractions of Wb¯b+jets, Wc¯c+jets and Wc+jets are also determined from data [71]
and are used to correct the simulation. These factors are determined by simultaneously analysing W
+2jets events with 0 b tagged jets and with
≥1 b-tagged jets. The fraction of W+light jets events is scaled accordingly in order to preserve the overall normalisation of the W
+jets background before b tagging.7 Final Event Selection
After preselection, further background suppression is achieved by applying requirements aimed at ex- ploiting the distinct kinematic features of the signal. The large T quark mass results in energetic W bosons and b quarks in the final state with large angular separation between them, while the decay prod- ucts from the boosted W bosons have small angular separation. The combination of these properties is very effective in suppressing the dominant t¯t background since t¯t events with boosted W boson configu- rations are rare, and are typically characterized by a small angular separation between the W boson and b quark from the top quark decay.
To take advantage of these properties, it is necessary to identify the hadronically-decaying W boson
(W
had) as well as the b jets in the event. The candidate b jets are defined as the two jets with the
highest b-tag discriminant (although only one of them is explicitly required to be b tagged in the event
selection). Two types of W
hadcandidates are defined, W
hadtype Iand W
hadtype II, depending on the angular
separation between their decay products. W
hadtype Icandidates correspond to boosted W bosons, where the
quarks from the W boson decay have small angular separation between them and are reconstructed as a
single jet. W
hadtype IIcandidates correspond to W bosons where both quarks from the W boson decay are
Events / 10 GeV
0 500 1000 1500 2000 2500 3000 3500
4000 Data (s = 8 TeV)
t t
t Non-t Total BG uncert.
(600) Chiral x 50 T
T L dt = 14.3 fb-1
∫ Preliminary ATLAS
candidate mass [GeV]
type I
Whad
0 20 40 60 80 100 120 140 160
Data / BG
0.5 1 1.5 0
Events / 10 GeV
0 500 1000 1500 2000 2500
3000 Data (s = 8 TeV) t
t t Non-t Total BG uncert.
(600) Chiral x 50 T
T
L dt = 14.3 fb-1
∫ Preliminary ATLAS
candidate mass [GeV]
type II
Whad
0 20 40 60 80 100 120 140 160
Data / BG
0.5 1 1.5 0
(a) (b)
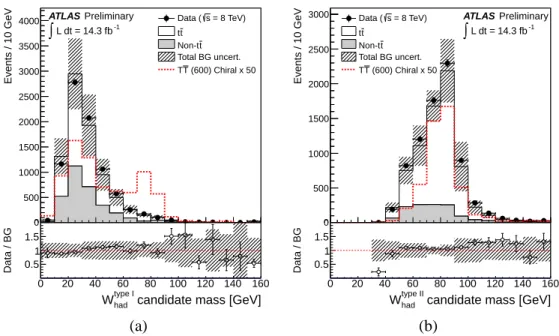
Figure 2: Distribution of the reconstructed mass for (a) W
hadtype Iand (b) W
hadtype IIcandidates for the com- bined e+jets and
µ+jets channels after preselection. These events have≥1 W
hadcandidates (see text for details) but have not had the mass requirement imposed. The data (solid black points) are compared to the SM prediction (stacked histograms). The total uncertainty on the background estimation (see Section 9 for details) is shown as a black hashed band. The expected contribution from a chiral fourth-generation T quark with mass m
T =600 GeV, multiplied by a factor of 50, is also shown (red dashed histogram).
The lower panel shows the ratio of data to SM prediction. The overflow has been added to the last bin.
reconstructed as separate jets. In the construction of both types of W
hadcandidates, the two candidate b jets are excluded from consideration. W
hadtype Iis defined as a single jet with p
T >250 GeV and mass in the range of 60–120 GeV. The asymmetric window about the world-average W boson mass value is chosen in order to increase the acceptance for hadronically-decaying Z bosons. The mass distribution for W
hadtype Icandidates, prior to the jet mass requirement itself, is shown in Fig. 2. W
hadtype IIis defined as a dijet system with p
T>200 GeV, angular separation
∆R( j,j)
<0.8 and mass within the range of 60–120 GeV.
Any jets satisfying the W
hadtype Irequirements are excluded from consideration to form W
hadtype IIcandidates.
If multiple pairs satisfy the above requirements, the one with mass closest to the nominal W boson mass is chosen. The mass distribution for W
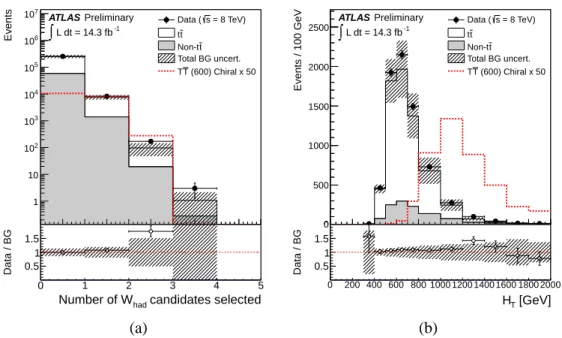
hadtype IIcandidates, prior to the dijet mass requirement, is shown in Fig. 2. Figure 3a shows the number of W
hadcandidates after preselection.
The leptonically-decaying W boson is reconstructed using the lepton and E
missT, which is identified as the neutrino p
T. Requiring that the invariant mass of the lepton–neutrino system equals the nominal W boson mass allows reconstruction of the neutrino longitudinal momentum up to a two-fold ambiguity.
If two solutions exist, they are both considered (see Section 8). If no real solution exists, the neutrino pseudorapidity is set equal to that of the lepton, since in the kinematic regime of interest the decay products of the W boson tend to be collinear.
Two final selections, loose and tight, are defined (see Table 1 for a summary). The loose selection
considers events with
≥4 jets and with at least one W
hadtype Ior W
hadtype IIcandidate. The events must
satisfy H
T >800 GeV, where H
Tis the scalar sum of the lepton p
T, E
Tmissand the p
Tof the four
highest-p
Tjets. The H
Tdistribution peaks at
∼2m
Tfor signal events, which makes the H
T >800 GeV
requirement particularly efficient for signal with m
T &400 GeV, while rejecting a large fraction of
the background. Figure 3b shows the distribution of H
Tprior to the H
T >800 GeV requirement. In
Events
1 10 102
103
104
105
106
107
= 8 TeV) s Data (
t t
t Non-t Total BG uncert.
(600) Chiral x 50 T
T L dt = 14.3 fb-1
∫ Preliminary ATLAS
candidates selected Number of Whad
0 1 2 3 4 5
Data / BG
0.5 1 1.5
Events / 100 GeV
0 500 1000 1500 2000
2500 Data (s = 8 TeV)
t t
t Non-t Total BG uncert.
(600) Chiral x 50 T
T L dt = 14.3 fb-1
∫ Preliminary ATLAS
[GeV]
HT
0 200 400 600 800 1000 1200 1400 1600 1800 2000
Data / BG
0.5 1 1.5 0
(a) (b)
Figure 3: Distribution of (a) number of W
hadcandidates at the preselection level, and (b) H
Tafter re- quirement of
≥1 W
hadcandidate, for the combined e+jets and
µ+jets channels. The data (solid blackpoints) are compared to the SM prediction (stacked histograms). The total uncertainty on the background estimation (see Section 9 for details) is shown as a black hashed band. The expected contribution from a chiral fourth-generation T quark with mass m
T =600 GeV, multiplied by a factor of 50, is also shown (red dashed histogram), The lower panel shows the ratio of data to SM prediction. The overflow has been added to the last bin.
Table 1:
Summary of event selection requirements.Selection Requirements
Preselection One electron or muon
E
Tmiss>20 GeV, E
missT +m
T >60 GeV
≥
4 jets,
≥1 b-tagged jets loose selection Preselection
≥
1 W
hadcandidates H
T>800 GeV
p
T(b
1)
>160 GeV, p
T(b
2)
>80 GeV
∆R(ℓ, ν)<
1.2 tight selection loose selection
min∆R(ℓ, b)
>1.4, min∆R(W
had,b)
>1.4
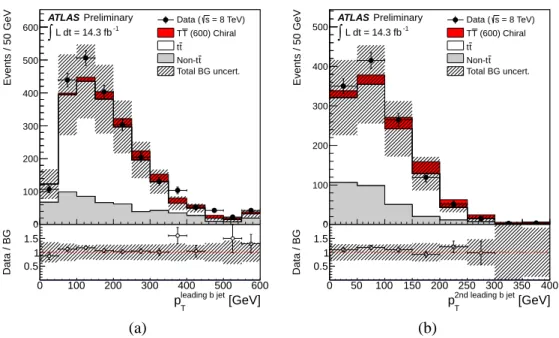
addition, the highest-p
Tb-jet candidate (b
1) and the next-to-highest-p
Tb-jet candidate (b
2) are required to have p
T >160 GeV and p
T >80 GeV, respectively. Figure 4 shows the distributions of p
T(b
1) and p
T(b
2) after all previous requirements and prior to the p
T(b
1) and p
T(b
2) requirements, respectively.
Finally, the angular separation between the lepton and the reconstructed neutrino is required to satisfy
∆R(ℓ, ν) <
1.2. The tight selection adds the following isolation requirements to the loose selection:
min(∆R(W
had,b
1,2))
>1.4 and min(∆R(ℓ, b
1,2))
>1.4, which are particularly effective at suppressing
t¯t background. If an event has multiple W
hadcandidates, the one with highest p
Tis selected. Figure 5
Events / 50 GeV
0 100 200 300 400 500
600 Data (s = 8 TeV)
(600) Chiral T T
t t
t Non-t Total BG uncert.
L dt = 14.3 fb-1
∫ Preliminary ATLAS
[GeV]
leading b jet
pT
0 100 200 300 400 500 600
Data / BG
0.5 1 1.5 0
Events / 50 GeV
0 100 200 300 400
500 Data (s = 8 TeV)
(600) Chiral T T
t t
t Non-t Total BG uncert.
L dt = 14.3 fb-1
∫ Preliminary ATLAS
[GeV]
2nd leading b jet
pT
0 50 100 150 200 250 300 350 400
Data / BG
0.5 1 1.5 0
(a) (b)
Figure 4: Distribution of (a) p
Tof leading b jet candidate, p
T(b
1), and (b) p
Tof subleading b jet can- didate, p
T(b
2), for the combined e+jets and
µ+jets channels after all previous selection requirements(see text for details), except for the requirements on p
T(b
1) and p
T(b
2) themselves. The data (solid black points) are compared to the SM prediction (stacked histograms). The total uncertainty on the background estimation (see Section 9 for details) is shown as a black hashed band. The expected contribution from a chiral fourth-generation T quark with mass m
T =600 GeV is also shown (red shaded histogram), stacked on top of the SM background. The lower panel shows the ratio of data to SM prediction. The overflow has been added to the last bin.
shows the distributions of
∆R(ℓ, ν) and min(∆R(ℓ,b
1,2)) after all previous requirements and prior to the
∆R(ℓ, ν) and min(∆R(ℓ,
b
1,2)) requirements, respectively.
Table 2 presents a summary of the background estimates for the loose and tight selections, respec- tively, as well as a comparison of the total predicted and observed yields. The quoted uncertainties include both statistical and systematic contributions. The latter are discussed in Section 9. The predicted and observed yields are in agreement within these uncertainties.
8 Heavy Quark Mass Reconstruction
The main discriminant variable used in this search is the reconstructed heavy-quark mass (m
reco), built from the W
hadcandidate and one of the two b-jet candidates. The reconstruction of the leptonically- decaying W boson usually yields two solutions, and there are two possible ways to pair the b-jet candi- dates with the W boson candidates to form the heavy quarks. Among all possible combinations, the one yielding the smallest absolute difference between the two reconstructed heavy quark masses is chosen.
The resulting m
recodistributions in Fig. 6 show that the SM background has been effectively suppressed,
and that, as is most visible for the loose selection, good discrimination between signal and background
is achieved. The small contributions from W
+jets, Z+jets, diboson, single-top and multi-jet events arecombined into a single background source referred to as non-t¯t. It was verified a priori that the tight
selection has the better sensitivity, and it is therefore chosen to derive the final result for the search. The
loose selection, displaying a significant t¯t background at low m
recowhich is in good agreement with the
expectation, provides further confidence in the background modeling prior to the application of b-jet
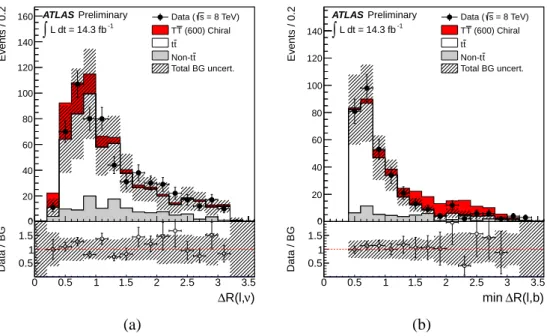
Events / 0.2
0 20 40 60 80 100 120 140
160 Data (s = 8 TeV)
(600) Chiral T T
t t
t Non-t Total BG uncert.
L dt = 14.3 fb-1
∫ Preliminary ATLAS
ν)
∆R(l,
0 0.5 1 1.5 2 2.5 3 3.5
Data / BG
0.5 1 1.5 0
Events / 0.2
0 20 40 60 80 100 120 140
= 8 TeV) s Data (
(600) Chiral T T
t t
t Non-t Total BG uncert.
L dt = 14.3 fb-1
∫ Preliminary ATLAS
R(l,b)
∆ min
0 0.5 1 1.5 2 2.5 3 3.5
Data / BG
0.5 1 1.5 0
(a) (b)
Figure 5: Distribution of (a)
∆R(ℓ, ν) and (b) min(∆R(ℓ,b
1,2))
>1.4 for the combined e+jets and
µ+jetschannels after all previous selection requirements (see text for details), except for the requirements on
∆R(ℓ, ν) and min(∆R(ℓ,
b
1,2))
>1.4 themselves. In the case of (b), this corresponds to the loose selection.
The data (solid black points) are compared to the SM prediction (stacked histograms). The total uncer- tainty on the background estimation (see Section 9 for details) is shown as a black hashed band. The expected contribution from a chiral fourth-generation T quark with mass m
T =600 GeV is also shown (red shaded histogram), stacked on top of the SM background. The lower panel shows the ratio of data to SM prediction. The overflow has been added to the last bin.
Table 2:
Number of observed events, integrated over the whole mass spectrum, compared to the SM expectation for the combined e+jets andµ+jets channels after thelooseandtightselections. The expected signal yields in two different scenarios, a chiral fourth-generation T quark and a vector-like singlet T quark, assuming mT =600 GeV, are also shown. The quoted uncertainties include both statistical and systematic contributions.loose selection tight selection
t¯t 264
±80 10
±6
t¯tV 5.1
±1.8 0.5
±0.2
W+jets 16
±11 6
±5
Z+jets 1.1
±1.4 0.2
±0.5
Single top 30
±7 4.4
±1.6
Dibosons 0.21
±0.15 0.06
±0.05
Total background 317
±90 21
±9
Data 348 37
T ¯ T (600 GeV)
Chiral fourth-generation 88
±10 54
±7
Vector-like singlet 41
±4 20.3
±2.2
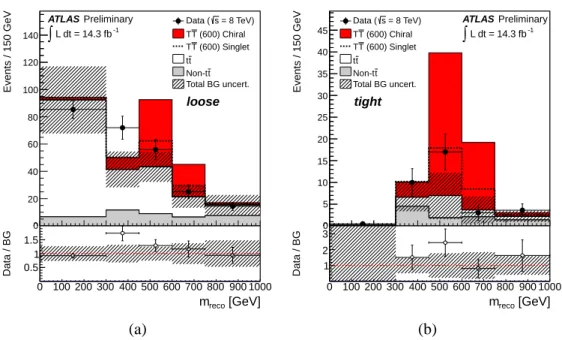
Events / 150 GeV
0 20 40 60 80 100 120 140
= 8 TeV) s Data (
(600) Chiral T T
(600) Singlet T
T t t
t Non-t Total BG uncert.
loose
L dt = 14.3 fb-1
∫ Preliminary ATLAS
[GeV]
mreco
0 100 200 300 400 500 600 700 800 900 1000
Data / BG
0.5 1 1.5 0
Events / 150 GeV
0 5 10 15 20 25 30 35 40 45
= 8 TeV) s Data (
(600) Chiral T T
(600) Singlet T
T t t
t Non-t Total BG uncert.
tight
L dt = 14.3 fb-1
∫ Preliminary ATLAS
[GeV]
mreco
0 100 200 300 400 500 600 700 800 900 1000
Data / BG
1 2 30
(a) (b)
Figure 6: Distribution of m
recofor the combined e+jets and
µ+jets channels after the (a)loose and (b) tight selection. The data (solid black points) are compared to the SM prediction. The shaded area represents the total background uncertainty (see Section 9 for details). Also shown, stacked on top of the SM background, is the expected contribution from signal corresponding to a chiral T quark with mass m
T =600 GeV. The overflow has been added to the last bin.
isolation requirements in the tight selection.
9 Systematic Uncertainties
Several sources of systematic uncertainties have been considered that can affect the normalisation of sig- nal and background and/or the shape of their corresponding final discriminant distributions. Individual sources of systematic uncertainty are considered uncorrelated. Correlations of a given systematic un- certainty are maintained across processes. Table 3 presents a summary of the systematic uncertainties considered in the analysis indicating whether they are taken to be normalisation-only, or to affect both shape and normalisation. The following sections describe each of the systematic uncertainties considered in the analysis.
9.1 Luminosity
The luminosity estimate has an uncertainty of 3.6% [72]. This systematic uncertainty is applied to all processes except the multijet background.
9.2 Uncertainties on Object Definitions
In this section uncertainties in the reconstruction of jets, leptons and b-, c-, and light flavour-tagging are
considered.
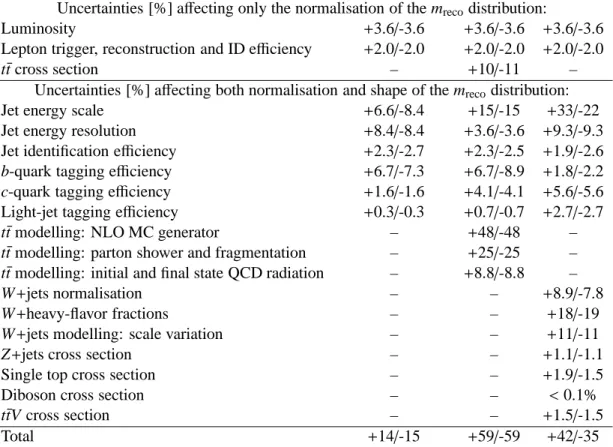
Table 3: List of all systematic uncertainties (in %) considered in the analysis, indicating which ones are treated as normalisation and/or shape uncertainties, with their impact on normalisation in the case of the tight selection, for signal and backgrounds. The signal given here is a chiral fourth-generation T quark with mass m
T =600 GeV.
T ¯ T (600 GeV) t¯t Non-t¯t Uncertainties [%] affecting only the normalisation of the m
recodistribution:
Luminosity
+3.6/-3.6 +3.6/-3.6 +3.6/-3.6Lepton trigger, reconstruction and ID efficiency
+2.0/-2.0 +2.0/-2.0 +2.0/-2.0t¯t cross section –
+10/-11–
Uncertainties [%] affecting both normalisation and shape of the m
recodistribution:
Jet energy scale
+6.6/-8.4 +15/-15 +33/-22Jet energy resolution
+8.4/-8.4 +3.6/-3.6 +9.3/-9.3Jet identification efficiency
+2.3/-2.7 +2.3/-2.5 +1.9/-2.6b-quark tagging efficiency
+6.7/-7.3 +6.7/-8.9 +1.8/-2.2c-quark tagging efficiency
+1.6/-1.6 +4.1/-4.1 +5.6/-5.6Light-jet tagging efficiency
+0.3/-0.3 +0.7/-0.7 +2.7/-2.7t¯t modelling: NLO MC generator –
+48/-48–
t¯t modelling: parton shower and fragmentation –
+25/-25– t¯t modelling: initial and final state QCD radiation –
+8.8/-8.8–
W+jets normalisation – –
+8.9/-7.8W+heavy-flavor fractions – –
+18/-19W+jets modelling: scale variation – –
+11/-11Z+jets cross section – –
+1.1/-1.1Single top cross section – –
+1.9/-1.5Diboson cross section – –
<0.1%
t¯tV cross section – –
+1.5/-1.5Total
+14/-15 +59/-59 +42/-359.2.1 Lepton Reconstruction, Identification and Trigger
The reconstruction and identification efficiency of electrons and muons, as well as the efficiency of the trigger used to record the events, differ between data and simulation. Scale factors are derived using tag- and-probe techniques on Z
→ ℓ+ℓ−(ℓ
=e, µ) data and simulated samples to correct the simulation for these discrepancies. For each source of uncertainty, the quadratic sum of the statistical and systematic uncertainties on the corresponding scale factor is taken as the overall systematic uncertainty. A total uncertainty on the signal and background acceptances of 2% is estimated.
9.2.2 Lepton Momentum Scale and Resolution
The accuracy of lepton momentum scale and resolution in simulation is checked using reconstructed
distributions of the Z
→ ℓ+ℓ−and J/ψ
→ ℓ+ℓ−masses. In the case of electrons, E
/p studies usingW
→eν events are also used. Small discrepancies are observed between data and simulation, and
corrections for the lepton energy scale and resolution in the latter are applied. In the case of electrons,
energy scale corrections need to be applied to data (all regions) and simulation (calorimeter transition
region), while energy resolution corrections are applied to the simulation only. In the case of muons,
momentum scale and resolution corrections are only applied to the simulation. Uncertainties on both
the momentum scale and resolution are considered, and varied separately. The resulting uncertainties
on the total yields predicted by the simulation are at the sub-percent level and therefore neglected in the analysis.
9.2.3 Jet Vertex Fraction Efficiency
The per-jet efficiency to satisfy the
|JVF
| >0.5 requirement is measured in Z(
→ ℓ+ℓ−)+1-jet events in data and simulation, selecting separately events enriched in hard-scatter jets and events enriched in jets from other proton interactions in the same bunch crossing (pileup). Dedicated data/simulation efficiency and inefficiency scale factors are measured separately for both types of jets. The efficiency scale factor for hard-scatter jets decreases from
∼1.03 at p
T =25 GeV to
∼1.01 for p
T>150 GeV. The scale factors for pileup jets are found to be consistent with 1. The product of all per-jet scale factors define a per-event weight used to calibrate the simulation to data. The propagation of the per-jet scale factor uncertainty results in an overall uncertainty on the signal and background acceptance of
∼2.5%.
9.2.4 Jet Energy Scale
The jet energy scale and its uncertainty have been derived combining information from test-beam data, LHC collision data and simulation [35, 73, 74]. The overall jet energy scale uncertainty in the central detector region ranges from
∼4% at p
T =25 GeV to
∼1% at p
T =500 GeV [75]. The effect of the jet energy scale uncertainty is assessed by varying the jet p
Tof all selected jets in the simulation by
±1 standard deviation. The missing transverse momentum is corrected according to the varied p
Tof the jets in each event and all jet-related kinematic variables are recomputed accordingly.
9.2.5 Jet Energy Resolution
The jet energy resolution has been measured as a function of the jet p
Tand rapidity using two in- situ techniques [35], and found to be consistent between data and simulation. The quadratic difference between the jet energy resolutions for jets in data and the simulation is used to derive a systematic uncertainty in the analysis. The energy of jets in the simulation is smeared by this residual difference, and the changes in the normalisation and shape of the final discriminant is compared to the default (unsmeared) prediction by the simulation. This uncertainty is then symmetrised.
9.2.6 Heavy- and Light-Flavour Tagging